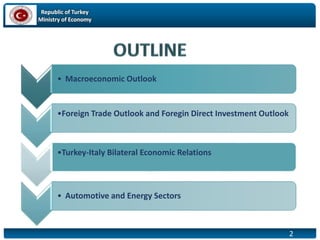
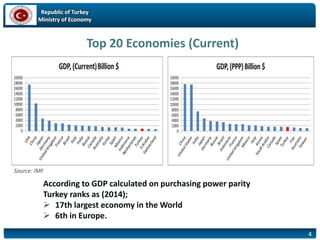
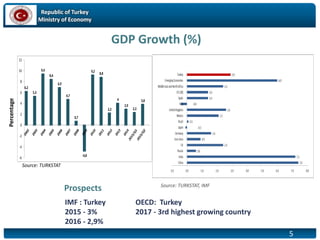
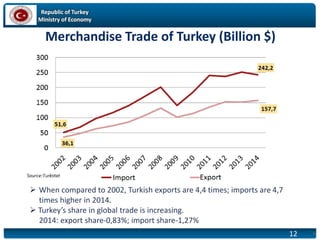
Republic of Turkey
Ministry of Economy
Melis Atamer
Commercial Councellor
18 Februrary 2016
Republic of Turkey
Ministry of Economy
2
• Macroeconomic Outlook
•Foreign Trade Outlook and Foregin Direct Investment Outlook
•Turkey-Italy Bilateral Economic Relations
• Automotive and Energy Sectors
Republic of Turkey
Ministry of Economy
3
21
Republic of Turkey
Ministry of Economy
Top 20 Economies (Current)
Source: IMF
According to GDP calculated on purchasing power parity
Turkey ranks as (2014);
 17th largest economy in the World
 6th in Europe.
4
Republic of Turkey
Ministry of Economy
5
GDP Growth (%)
6,2
5,3
9,4
8,4
6,9
4,7
0,7
-4,8
9,2
8,8
2,2
4
2,9
2,3
3,8
-6
-4
-2
0
2
4
6
8
10
12
8,
4
6,
9
4,
7
8,8
4,
8
Percentage
Source: TURKSTAT
IMF : Turkey
2015 - 3%
2016 - 2,9%
OECD: Turkey
2017 - 3rd highest growing country
Prospects Source: TURKSTAT, IMF
Republic of Turkey
Ministry of Economy
6
GDP per capita has
tripled since 2002
Per Capita GDP (USD)
3,492
4,565
5,775
7,036
7,597
9,247
10,444
8,561
10,003
10,428 10,459
10,822
10.390
2,000
3,000
4,000
5,000
6,000
7,000
8,000
9,000
10,000
11,000
2002 2003 2004 2005 2006 2007 2008 2009 2010 2011 2012 2013 2014
Republic of Turkey
Ministry of Economy
Central Government Budget Deficit/ GDP (%)
Source: Eurostat, TUİK
* 2014
7
Republic of Turkey
Ministry of Economy
Government Debt / GDP (%)
Source: Eurostat
*2014
8
Republic of Turkey
Ministry of Economy
Inflation (Annual Percentage Change)
Source: TURKSTAT
9
 As of December 2015, inflation rate is 8,8%
Republic of Turkey
Ministry of Economy
Unemployment Rates (%)
Source: TURKSTAT
 As of October 2015, unemployment rate is 10,5%
 WB: Turkey has the 5th largest labor force in Europe.
Republic of Turkey
Ministry of Economy
11
FOREIGN TRADE
OUTLOOK
MERCHANDISE
Republic of Turkey
Ministry of Economy
12
Merchandise Trade of Turkey (Billion $)
12
 When compared to 2002, Turkish exports are 4,4 times; imports are 4,7
times higher in 2014.
 Turkey’s share in global trade is increasing.
2014: export share-0,83%; import share-1,27%
Republic of Turkey
Ministry of Economy
13
Shares of Country Groups in Merchandise Trade
Turkish Exports Turkish Imports
EU
Countries
43,5%
Other
European
Countries
9.6%
African
Countries
8.7%
American
Countries
6.4%
Near East
and
Middle
East
Countries
22.4%
Other
Asian
Countries
7.4%
Others
2.0% EU
Countries
36,7%
Other
European
Countries
15,0%
African
Countries
2.5%
American
Countries
7,8%
Near and
Middle
East
Countries
8,5%
Other
Asian
Countries
23,2%
Others
6,4%
13
Republic of Turkey
Ministry of Economy
14
TOP TEN IMPORT COUNTRIES (2014)
Country
Import
(billion USD)
Share (%)
Russia 25,3 10,4
China 24,9 10,3
Germany 22,4 9,2
USA 12,7 5,3
Italy 12,2 5,0
Iran 9,8 4,1
France 8,2 3,4
South Korea 7,6 3,1
India 6,9 2,9
Spain 6,1 2,5
List Total 136,1 56,2
Total 242,2 100,0
TOP TEN EXPORT COUNTRIES (2014)
Country
Import
(billion USD)
Share (%)
Germany 15,1 9,6
Iraq 10,9 6,9
United Kingdom 9,9 6,3
Italy 7,1 4,5
France 6,5 4,1
USA 6,4 4,0
Russia 5,9 3,8
Spain 4,8 3,0
U.A.E 4.,7 3,0
Iran 3,9 2,5
List Total 75,1 47,7
Total 157,7 100,00
Shares of Top Countries in Merchandise Trade
Republic of Turkey
Ministry of Economy
15
Structure of Imports (2014)
15
TOTAL
IMPORTS
242,2 Billion $
Intermediate Goods
176,7 Billion $
(Energy Imports: 54,9 Billion $)
Capital Goods
36,0 Billion $
Consumption Goods
29,0 Billion $
73 %
15 %
12 %
Republic of Turkey
Ministry of Economy
16
Top 10 Product Groups in Turkey’s Imports
16
Product Groups 2014
(million $)
2014
(%) Share
27 Mineral fuels, mineral oils etc. 54.906 22,7%
84 Machinery and mechanical appliances 28.104 11,6%
85 Electrical machinery and equipment 17.950 7,4%
72 Iron and steel 17.606 7,3%
87 Motor vehicles, parts and accessories 15.736 6,5%
39 Plastic and articles thereof 14.151 5,8%
71 Precious stones, precious metals and articles thereof 8.121 3,4%
29 Organic chemicals 5.833 2,4%
90 Optical, photographic,measuring, precision 4.878 2,0%
30 Pharmaceutical products 4.428 1,8%
LIST TOTAL 171.713 70,9%
TOTAL 242.224 100%
Republic of Turkey
Ministry of Economy
17
Structure of Exports (2014)
17
TOTAL
EXPORTS
157,6 Billion $
Intermediate Goods
75,1 Billion $
Consumption Goods
65 Billion $
Capital Goods
16,1 Billion $
48 %
42 %
10 %
Republic of Turkey
Ministry of Economy
18
Top 10 Product Groups in Turkey’s Exports
18
Product Groups 2014 (million $) 2014 (%) Share
87 Motor vehicles, parts and accessories 18.064 11,5%
84 Machinery and mechanical appliances 13.595 8,6%
61 Knitted and crocheted goods and articles thereof 10.029 6,4%
85 Electrical, electronic equipment 9.693 6,1%
72 Iron and steel 9.246 5,9%
71 Precious stones, precious metals and articles
thereof
7.717
4,9%
73 Articles of iron and steel 6.356 4,0%
62 Non knitted and crocheted goods and articles 6.234 4,0%
27 Mineral fuels, mineral oils etc. 6.112 3,9%
39 Plastic and Articles Thereof 6.098 3,9%
LIST TOTAL 93.145 59,1%
TOTAL 157.642 100,0%
Republic of Turkey
Ministry of Economy
19 19
Customs Union
 Customs Union Agreement: come into force on January 1, 1996
(the Decision No: 1/95 of the Association Council)
 Scope
 All customs duties as well as quantitative restrictions applied on imports
of industrial products from the Community are eliminated.
 For products imported into Turkey from third countries, Turkey started to
apply the Common Customs Tariff (CCT) of the Community.
Covers only the industrial
and the processed
agricultural products
Traditional agricultural goods
are outside the scope
Republic of Turkey
Ministry of Economy
FOREIGN DIRECT INVESTMENT
OUTLOOK
October 2015 Ministry of Economy 20
Republic of Turkey
Ministry of Economy
21
FDI Inflow # of Companies
• 2002 : 15 billion USD 6.000
• 2003-2014 : 150 billion USD 41.528
BillionUSD
FDI INFLOW TO TURKEY
1.1
1.7
2.8
10.0
2.0
22.0
19.9
8.6 9.1
16.2
13.3
12.5 12.6
14,1*
0
5
10
15
20
25
1993-2002
Average
2003
2004
2005
2006
2007
2008
2009
2010
2011
2012
2013
2014
2015*
Source: CBRT *Jan-
November
Republic of Turkey
Ministry of Economy
The Sectoral Breakdown of Foreign Direct Investments
Source: CBRT
*January-July
22
Republic of Turkey
Ministry of Economy
23
FDI SOURCES
Source: Central Bank of Turkey
EU, 70,4%, 66%Non-EU, 5,1%,
5%
USA, 7,9%, 7%
Gulf Region,
7,8%,7%
Others,16,5%,
15%
2002-2013
EU, 63,5%
Non-EU, 15,8%
USA, 2,3%
Gulf Region,
4,6%
Others,18,4%
2014
Republic of Turkey
Ministry of Economy
24
* Million USD
TOP TEN FDI INFLOWS AT A TIME (2002-2014)
Republic of Turkey
Ministry of Economy
BILATERAL ECONOMIC
RELATIONS
Republic of Turkey
Ministry of Economy
26
Turkey-Italy Agreements
Bilateral Investment Treaty
signed in 22/3/1995
entry into force in 2/3/2004
Avoidance of Double Taxation Treaty
signed in 27/7/1990
entry into force in 1/1/1994
26
Republic of Turkey
Ministry of Economy
27
Inflows (million USD)
Total Italy Investments between 2002-2014 in Turkey 2,8 billion $
Number of Companies with Italian Capital 1.264
0
200
400
600
800
MillionUSD
Years
Turkish Investments in Italy
Number of companies 51
Capital (million USD) 322
27
Italy FDI in Turkey
Republic of Turkey
Ministry of Economy
28
Main Export Items 2014 % Share
Motor Vehicles 1,488 20,84
Fibre and Textile Products 924 12,95
Vegetables, Fruits 764 10,70
Clothing and Accessories 633 8,87
Electrical Machinery and Equipment 341 4,78
Total 7,141 100
Main Import Items 2014 % Share
Crude Oil Products 1,548 38
Machinery and Equipment (general
use)
1,381 20
Machinery and Equipment (specific
use)
1,222 13
Motor Vehicles 906 9
Iron and Steel 584 7
Total 12,195 100
*Million USD
Source: Ministry of
Economy
TradewithItaly
Republic of Turkey
Ministry of Economy
29
MEGA Projects Under Construction
Italy-Turkey Partnership
Izmit Bay Bridge along Istanbul-
Izmir Highway BOT Project
3rd Istanbul Bridge and
Connected Highways
Etlik Entegre Health
Campus Project
Republic of Turkey
Ministry of Economy
30
3rd Country Projects of Italian-Turkish Companies
Astaldi-Ictas
Pulkovo Airport /Motorway (St Petersburg)
Russian Federation
Astaldi-Gulermak
Warsaw Metro
Poland
Republic of Turkey
Ministry of Economy
AUTOMOTIVE
AND ENERGY
Republic of Turkey
Ministry of Economy
AUTOMOTIVE SECTOR
Turkey
Production (2014) 1,170 million units
Export (2014) 885.000 units
Global Manufacturers in Turkey:
6th in Europe:
 Leader in light commercial vehicles
 2st rank in CV production
 6th in motor vehicle production
17th in the World
Republic of Turkey
Ministry of Economy
 14 OEMs production capacity over 1.7
million units
 4.000 component manufacturers
 400.000 employment
Export champion
(%16 share in total exports)
%75 of production is designed for foreign
markets
50 R&D Centers belongs to
automotive manufacturers/suppliers
AUTOMOTIVE SECTOR
Republic of Turkey
Ministry of Economy
ENERGY SECTOR
Limited primary energy sources
Dependent on imported energy
One of the fastest growing energy markets
A natural energy corridor
Close proximity to more than 70% of worlds’ oil and gas reserves
On-going privatization process
Power distribution is completely in private sector hands
The share of entities in the electricity generation sector
increased from 32% in 2002 to 75% in 2015
Energy stock exhange has been recently
established
Republic of Turkey
Ministry of Economy
ENERGY SECTOR
• Baku-Tbilisi-Ceyhan (BTC) Petrol Oil Pipeline
• Kerkuk-Yumurtalik Oil Petrol Pipeline
• Samsun-Ceyhan Oil Petrol Pipeline
• Baku-Tbilisi-Erzurum (BTE) Natural Gas Pipeline
• Southern Gas Corridor
• Trans-Anatolian Pipeline (TANAP)
• Bosphorus (3.7% of the world’s daily oil consumption passes
through the Turkish straits)
Republic of Turkey
Ministry of Economy
AVIATION SECTOR
Turkish Airlines
Flies to more destinations than any other (283 destinations in 111
countries)
Best Airline in Europe in 2015 (5th time in a row)
 The only airline to be decorated with 4 stars on all categories
 11 destinations in Italy
(Rome, Bologna, Catania, Genoa, Milan, Naples,
Pisa,Rome,Tulin, Venice and Bari)
Republic of Turkey
Ministry of Economy
37
Strategic Location of Turkey
Republic of Turkey
Ministry of Economy
38
Turkey - Production and Export Hub
According to WTO data;
 Turkey is the World’s 22nd biggest exporter
 Europe’s number 2 and World’s number 9 commercial vehicle producer
 Europe’s number 1 and World’s number 9 bus, midi bus and mini bus producer
 Europe’s number 2 and World’s number 12 ship producer
 Europe’s number 6 and the World’s number 17 in Automotive Industry
production
 Europe’s number 1 and the World’s number 2 cement exporter
 Europe’s number 3 in plastic industry production
 World’s number 5 in exports of ceramic cover material and medical
appliances
 Europe’s number 6 in paint production
 Europe’s number 1 and the World’s number 8 in steel production
Republic of Turkey
Ministry of Economy
39
Turkey - Production and Export Hub
 Among the World’s elite 5 jewellery producers
 Europe’s number 4 and the World’s number 7 in washing machine exports.
 The leading exporter of washing machines to the EU
 Europe’s number 3 and the World’s number 4 in dishwasher exports.
 The leading exporter of dishwasher to the EU
 Europe’s number 2 and the World’s number 6 exporter of fridges
and freezers.
 Number 2 exporter of fridges and freezers to the EU
 World’s number 3 in exports of processed marbles
 Europe’s number 9 and the World’s number 14 in furniture exports
 World’s number 7 exporters of textile and garments
 Europe’s and the World’s number 2 in exports of carpets
 Europe’s and the World’s leading exporter of many agricultural goods
Republic of Turkey
Ministry of Economy
40
Thank you
For more information
Address: Office of Councellor Commercial Affairs
Viale Pasteur 77, 00144, Rome / Tel: 0039065922334
E-mail: roma@ekonomi.gov.tr / www.economy.gov.tr
21
We are
here

Presentazione Turchia

  • 1.
    Republic of Turkey Ministryof Economy Melis Atamer Commercial Councellor 18 Februrary 2016
  • 2.
    Republic of Turkey Ministryof Economy 2 • Macroeconomic Outlook •Foreign Trade Outlook and Foregin Direct Investment Outlook •Turkey-Italy Bilateral Economic Relations • Automotive and Energy Sectors
  • 3.
  • 4.
    Republic of Turkey Ministryof Economy Top 20 Economies (Current) Source: IMF According to GDP calculated on purchasing power parity Turkey ranks as (2014);  17th largest economy in the World  6th in Europe. 4
  • 5.
    Republic of Turkey Ministryof Economy 5 GDP Growth (%) 6,2 5,3 9,4 8,4 6,9 4,7 0,7 -4,8 9,2 8,8 2,2 4 2,9 2,3 3,8 -6 -4 -2 0 2 4 6 8 10 12 8, 4 6, 9 4, 7 8,8 4, 8 Percentage Source: TURKSTAT IMF : Turkey 2015 - 3% 2016 - 2,9% OECD: Turkey 2017 - 3rd highest growing country Prospects Source: TURKSTAT, IMF
  • 6.
    Republic of Turkey Ministryof Economy 6 GDP per capita has tripled since 2002 Per Capita GDP (USD) 3,492 4,565 5,775 7,036 7,597 9,247 10,444 8,561 10,003 10,428 10,459 10,822 10.390 2,000 3,000 4,000 5,000 6,000 7,000 8,000 9,000 10,000 11,000 2002 2003 2004 2005 2006 2007 2008 2009 2010 2011 2012 2013 2014
  • 7.
    Republic of Turkey Ministryof Economy Central Government Budget Deficit/ GDP (%) Source: Eurostat, TUİK * 2014 7
  • 8.
    Republic of Turkey Ministryof Economy Government Debt / GDP (%) Source: Eurostat *2014 8
  • 9.
    Republic of Turkey Ministryof Economy Inflation (Annual Percentage Change) Source: TURKSTAT 9  As of December 2015, inflation rate is 8,8%
  • 10.
    Republic of Turkey Ministryof Economy Unemployment Rates (%) Source: TURKSTAT  As of October 2015, unemployment rate is 10,5%  WB: Turkey has the 5th largest labor force in Europe.
  • 11.
    Republic of Turkey Ministryof Economy 11 FOREIGN TRADE OUTLOOK MERCHANDISE
  • 12.
    Republic of Turkey Ministryof Economy 12 Merchandise Trade of Turkey (Billion $) 12  When compared to 2002, Turkish exports are 4,4 times; imports are 4,7 times higher in 2014.  Turkey’s share in global trade is increasing. 2014: export share-0,83%; import share-1,27%
  • 13.
    Republic of Turkey Ministryof Economy 13 Shares of Country Groups in Merchandise Trade Turkish Exports Turkish Imports EU Countries 43,5% Other European Countries 9.6% African Countries 8.7% American Countries 6.4% Near East and Middle East Countries 22.4% Other Asian Countries 7.4% Others 2.0% EU Countries 36,7% Other European Countries 15,0% African Countries 2.5% American Countries 7,8% Near and Middle East Countries 8,5% Other Asian Countries 23,2% Others 6,4% 13
  • 14.
    Republic of Turkey Ministryof Economy 14 TOP TEN IMPORT COUNTRIES (2014) Country Import (billion USD) Share (%) Russia 25,3 10,4 China 24,9 10,3 Germany 22,4 9,2 USA 12,7 5,3 Italy 12,2 5,0 Iran 9,8 4,1 France 8,2 3,4 South Korea 7,6 3,1 India 6,9 2,9 Spain 6,1 2,5 List Total 136,1 56,2 Total 242,2 100,0 TOP TEN EXPORT COUNTRIES (2014) Country Import (billion USD) Share (%) Germany 15,1 9,6 Iraq 10,9 6,9 United Kingdom 9,9 6,3 Italy 7,1 4,5 France 6,5 4,1 USA 6,4 4,0 Russia 5,9 3,8 Spain 4,8 3,0 U.A.E 4.,7 3,0 Iran 3,9 2,5 List Total 75,1 47,7 Total 157,7 100,00 Shares of Top Countries in Merchandise Trade
  • 15.
    Republic of Turkey Ministryof Economy 15 Structure of Imports (2014) 15 TOTAL IMPORTS 242,2 Billion $ Intermediate Goods 176,7 Billion $ (Energy Imports: 54,9 Billion $) Capital Goods 36,0 Billion $ Consumption Goods 29,0 Billion $ 73 % 15 % 12 %
  • 16.
    Republic of Turkey Ministryof Economy 16 Top 10 Product Groups in Turkey’s Imports 16 Product Groups 2014 (million $) 2014 (%) Share 27 Mineral fuels, mineral oils etc. 54.906 22,7% 84 Machinery and mechanical appliances 28.104 11,6% 85 Electrical machinery and equipment 17.950 7,4% 72 Iron and steel 17.606 7,3% 87 Motor vehicles, parts and accessories 15.736 6,5% 39 Plastic and articles thereof 14.151 5,8% 71 Precious stones, precious metals and articles thereof 8.121 3,4% 29 Organic chemicals 5.833 2,4% 90 Optical, photographic,measuring, precision 4.878 2,0% 30 Pharmaceutical products 4.428 1,8% LIST TOTAL 171.713 70,9% TOTAL 242.224 100%
  • 17.
    Republic of Turkey Ministryof Economy 17 Structure of Exports (2014) 17 TOTAL EXPORTS 157,6 Billion $ Intermediate Goods 75,1 Billion $ Consumption Goods 65 Billion $ Capital Goods 16,1 Billion $ 48 % 42 % 10 %
  • 18.
    Republic of Turkey Ministryof Economy 18 Top 10 Product Groups in Turkey’s Exports 18 Product Groups 2014 (million $) 2014 (%) Share 87 Motor vehicles, parts and accessories 18.064 11,5% 84 Machinery and mechanical appliances 13.595 8,6% 61 Knitted and crocheted goods and articles thereof 10.029 6,4% 85 Electrical, electronic equipment 9.693 6,1% 72 Iron and steel 9.246 5,9% 71 Precious stones, precious metals and articles thereof 7.717 4,9% 73 Articles of iron and steel 6.356 4,0% 62 Non knitted and crocheted goods and articles 6.234 4,0% 27 Mineral fuels, mineral oils etc. 6.112 3,9% 39 Plastic and Articles Thereof 6.098 3,9% LIST TOTAL 93.145 59,1% TOTAL 157.642 100,0%
  • 19.
    Republic of Turkey Ministryof Economy 19 19 Customs Union  Customs Union Agreement: come into force on January 1, 1996 (the Decision No: 1/95 of the Association Council)  Scope  All customs duties as well as quantitative restrictions applied on imports of industrial products from the Community are eliminated.  For products imported into Turkey from third countries, Turkey started to apply the Common Customs Tariff (CCT) of the Community. Covers only the industrial and the processed agricultural products Traditional agricultural goods are outside the scope
  • 20.
    Republic of Turkey Ministryof Economy FOREIGN DIRECT INVESTMENT OUTLOOK October 2015 Ministry of Economy 20
  • 21.
    Republic of Turkey Ministryof Economy 21 FDI Inflow # of Companies • 2002 : 15 billion USD 6.000 • 2003-2014 : 150 billion USD 41.528 BillionUSD FDI INFLOW TO TURKEY 1.1 1.7 2.8 10.0 2.0 22.0 19.9 8.6 9.1 16.2 13.3 12.5 12.6 14,1* 0 5 10 15 20 25 1993-2002 Average 2003 2004 2005 2006 2007 2008 2009 2010 2011 2012 2013 2014 2015* Source: CBRT *Jan- November
  • 22.
    Republic of Turkey Ministryof Economy The Sectoral Breakdown of Foreign Direct Investments Source: CBRT *January-July 22
  • 23.
    Republic of Turkey Ministryof Economy 23 FDI SOURCES Source: Central Bank of Turkey EU, 70,4%, 66%Non-EU, 5,1%, 5% USA, 7,9%, 7% Gulf Region, 7,8%,7% Others,16,5%, 15% 2002-2013 EU, 63,5% Non-EU, 15,8% USA, 2,3% Gulf Region, 4,6% Others,18,4% 2014
  • 24.
    Republic of Turkey Ministryof Economy 24 * Million USD TOP TEN FDI INFLOWS AT A TIME (2002-2014)
  • 25.
    Republic of Turkey Ministryof Economy BILATERAL ECONOMIC RELATIONS
  • 26.
    Republic of Turkey Ministryof Economy 26 Turkey-Italy Agreements Bilateral Investment Treaty signed in 22/3/1995 entry into force in 2/3/2004 Avoidance of Double Taxation Treaty signed in 27/7/1990 entry into force in 1/1/1994 26
  • 27.
    Republic of Turkey Ministryof Economy 27 Inflows (million USD) Total Italy Investments between 2002-2014 in Turkey 2,8 billion $ Number of Companies with Italian Capital 1.264 0 200 400 600 800 MillionUSD Years Turkish Investments in Italy Number of companies 51 Capital (million USD) 322 27 Italy FDI in Turkey
  • 28.
    Republic of Turkey Ministryof Economy 28 Main Export Items 2014 % Share Motor Vehicles 1,488 20,84 Fibre and Textile Products 924 12,95 Vegetables, Fruits 764 10,70 Clothing and Accessories 633 8,87 Electrical Machinery and Equipment 341 4,78 Total 7,141 100 Main Import Items 2014 % Share Crude Oil Products 1,548 38 Machinery and Equipment (general use) 1,381 20 Machinery and Equipment (specific use) 1,222 13 Motor Vehicles 906 9 Iron and Steel 584 7 Total 12,195 100 *Million USD Source: Ministry of Economy TradewithItaly
  • 29.
    Republic of Turkey Ministryof Economy 29 MEGA Projects Under Construction Italy-Turkey Partnership Izmit Bay Bridge along Istanbul- Izmir Highway BOT Project 3rd Istanbul Bridge and Connected Highways Etlik Entegre Health Campus Project
  • 30.
    Republic of Turkey Ministryof Economy 30 3rd Country Projects of Italian-Turkish Companies Astaldi-Ictas Pulkovo Airport /Motorway (St Petersburg) Russian Federation Astaldi-Gulermak Warsaw Metro Poland
  • 31.
    Republic of Turkey Ministryof Economy AUTOMOTIVE AND ENERGY
  • 32.
    Republic of Turkey Ministryof Economy AUTOMOTIVE SECTOR Turkey Production (2014) 1,170 million units Export (2014) 885.000 units Global Manufacturers in Turkey: 6th in Europe:  Leader in light commercial vehicles  2st rank in CV production  6th in motor vehicle production 17th in the World
  • 33.
    Republic of Turkey Ministryof Economy  14 OEMs production capacity over 1.7 million units  4.000 component manufacturers  400.000 employment Export champion (%16 share in total exports) %75 of production is designed for foreign markets 50 R&D Centers belongs to automotive manufacturers/suppliers AUTOMOTIVE SECTOR
  • 34.
    Republic of Turkey Ministryof Economy ENERGY SECTOR Limited primary energy sources Dependent on imported energy One of the fastest growing energy markets A natural energy corridor Close proximity to more than 70% of worlds’ oil and gas reserves On-going privatization process Power distribution is completely in private sector hands The share of entities in the electricity generation sector increased from 32% in 2002 to 75% in 2015 Energy stock exhange has been recently established
  • 35.
    Republic of Turkey Ministryof Economy ENERGY SECTOR • Baku-Tbilisi-Ceyhan (BTC) Petrol Oil Pipeline • Kerkuk-Yumurtalik Oil Petrol Pipeline • Samsun-Ceyhan Oil Petrol Pipeline • Baku-Tbilisi-Erzurum (BTE) Natural Gas Pipeline • Southern Gas Corridor • Trans-Anatolian Pipeline (TANAP) • Bosphorus (3.7% of the world’s daily oil consumption passes through the Turkish straits)
  • 36.
    Republic of Turkey Ministryof Economy AVIATION SECTOR Turkish Airlines Flies to more destinations than any other (283 destinations in 111 countries) Best Airline in Europe in 2015 (5th time in a row)  The only airline to be decorated with 4 stars on all categories  11 destinations in Italy (Rome, Bologna, Catania, Genoa, Milan, Naples, Pisa,Rome,Tulin, Venice and Bari)
  • 37.
    Republic of Turkey Ministryof Economy 37 Strategic Location of Turkey
  • 38.
    Republic of Turkey Ministryof Economy 38 Turkey - Production and Export Hub According to WTO data;  Turkey is the World’s 22nd biggest exporter  Europe’s number 2 and World’s number 9 commercial vehicle producer  Europe’s number 1 and World’s number 9 bus, midi bus and mini bus producer  Europe’s number 2 and World’s number 12 ship producer  Europe’s number 6 and the World’s number 17 in Automotive Industry production  Europe’s number 1 and the World’s number 2 cement exporter  Europe’s number 3 in plastic industry production  World’s number 5 in exports of ceramic cover material and medical appliances  Europe’s number 6 in paint production  Europe’s number 1 and the World’s number 8 in steel production
  • 39.
    Republic of Turkey Ministryof Economy 39 Turkey - Production and Export Hub  Among the World’s elite 5 jewellery producers  Europe’s number 4 and the World’s number 7 in washing machine exports.  The leading exporter of washing machines to the EU  Europe’s number 3 and the World’s number 4 in dishwasher exports.  The leading exporter of dishwasher to the EU  Europe’s number 2 and the World’s number 6 exporter of fridges and freezers.  Number 2 exporter of fridges and freezers to the EU  World’s number 3 in exports of processed marbles  Europe’s number 9 and the World’s number 14 in furniture exports  World’s number 7 exporters of textile and garments  Europe’s and the World’s number 2 in exports of carpets  Europe’s and the World’s leading exporter of many agricultural goods
  • 40.
    Republic of Turkey Ministryof Economy 40 Thank you For more information Address: Office of Councellor Commercial Affairs Viale Pasteur 77, 00144, Rome / Tel: 0039065922334 E-mail: roma@ekonomi.gov.tr / www.economy.gov.tr 21 We are here