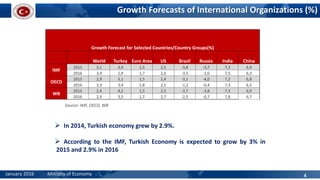
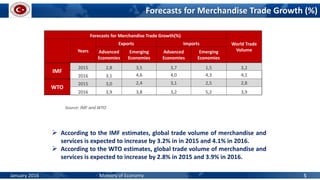
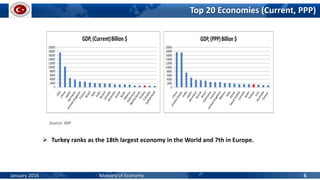
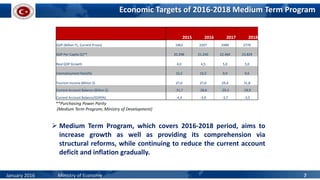
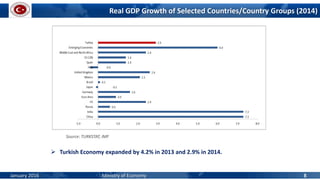
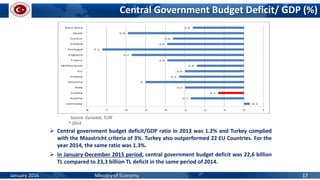
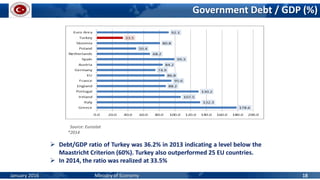
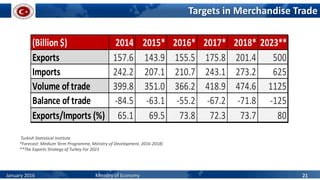
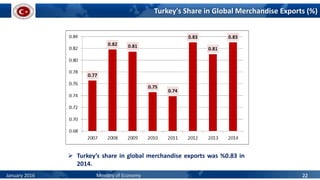
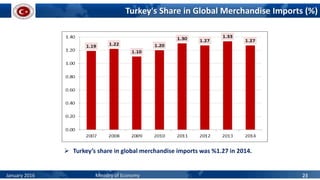
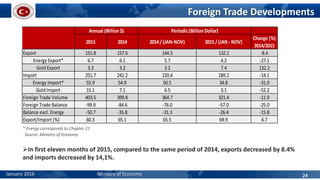
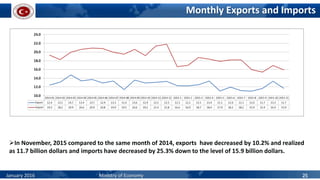
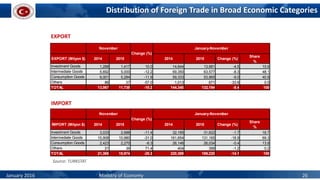
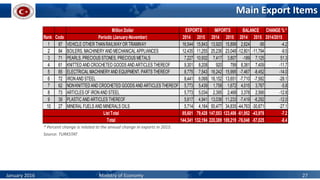
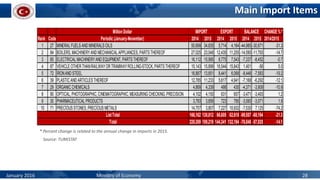
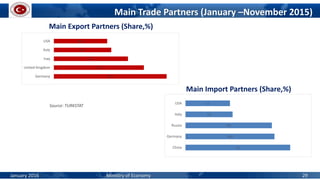
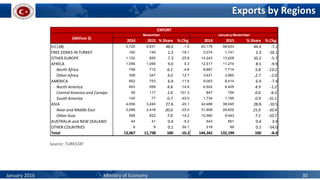
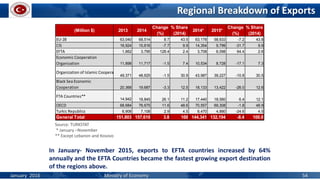
The document provides an economic outlook from the Ministry of Economy of Turkey for January 2016. It includes macroeconomic forecasts from international organizations showing Turkey's GDP growth expected around 3% in 2015-2016. The medium term program targets 4.5% GDP growth in 2016 with a reduced current account deficit. Exports decreased 8.4% in the first 11 months of 2015 while imports decreased 14.1%. Top exports include vehicles, machinery, precious metals and textiles, while machinery, intermediate goods and consumption goods dominate imports.
This report is designed to chart out the economic outlook of Thailand on a monthly basis. It is ideal for corporate management, investors as well as anyone interested in the second largest economy in ASEAN.
There is a lot of concern about the sustainability of the economic recovery. As a result, the Belgian Federal Planning Bureau revised its GDP growth forecast 2014 downwards.
What can we expect ?
Monthly statistical e-bulletin comprising about 30 tables and some charts with the latest available economic/financial market indicators, both Indian and Global.
This study investigates specifically the impact of Oil and Non-Oil Products on Nigeria Gross Domestic Product
(GDP). Data were collected for period 1981-2016 Descriptive Statistics and Multiple Linear Regression Approach
was used, defining Oil, and Non-Oil Products as independent variables and Gross Domestic Product (GDP) as
dependent variable. From the analysis, Oil, and Non-Oil Products contributes immensely to the Nigeria Gross
Domestic Product (GDP). Contrary, the Oil Product is positively and insignificant on economic growth of Nigeria
(GDP) and the Non-Oil Product has positively and significant on economic growth of Nigeria (GDP). This study
therefore recommends that Nigeria should enhance her export promotion strategies and diversify her economy far
away from Crude oil.
'Inflation Dynamics and Macroeconomic Stability in Ethiopia: Decomposition Ap...Jared Vaile
The Ethiopian Economics Association (EEA) 27th General Assembly (GA) meeting was held on 30th January 2021 at the EEA conference Hall in Addis Ababa, Ethiopia. There was a presentation followed by a panel discussion on Inflation Dynamics and Macroeconomic Stability in Ethiopia.
The study presented by Dr. Atnafu was driven by the fact that inflation has become one of the binding constraints for policymakers both in their short- and long-term efforts to advance economic progress. There is a growing need to examine the commodity-wise contributions and drivers of inflation, and to decompose them into their permanent and transitory components. Therefore, the objectives of this study are first, to investigate the evolution and dynamics of inflation by decomposing the headline inflation (raw inflation) into its core (permanent) and transitory (non-permanent) components from highly disaggregated commodities’ prices. Secondly, it aims to investigate the association between core inflation (the predictor of headline inflation) and macroeconomic stability.
The full working paper can be found on the EEA website, along with other publications: https://eea-et.org/course/inflation-dynamics-and-macroeconomic-stability-in-ethiopia-decomposition-approach/.
Advance Estimates of National Income, 2015-16 D Murali ☆
Advance Estimates of National Income, 2015-16 and Quarterly Estimates of Gross Domestic Product for the Third Quarter (Oct-Dec), 2015-16
(Source: http://pibphoto.nic.in/documents/rlink/2016/feb/p20162801.pdf)
The 2016 selection of trade sectors includes five areas: 1) agriculture, 2) financing, banking and insurance, 3)
information and communication technology (ICT) sector, 4) energy sector and 5) automotive industry. These
sectors were selected taking into consideration their impact on commercial flows and overall economic
developments and the intensity of changes taking place during the last year.
Due to the fact that some sectors were covered in previous 2015 edition of the Trade Sector Briefs 2015, selected
information will appear repeatedly. However, new tendencies, trends and evolutions, as well as updated
recommendations were collected for this recent analysis.
Albania being a small country with approx. 3 million people faces some challenges in its economy such as nepotism, corruption, excessive drinking, smoking, ...
Agriculture is still one of the sectors that would lead to development but then it is faced by subsistence practices, poor technology, rural-urban migration and lack of government support.
Other problems that Albania faces in its economy include brain drain and it being a dumping place from other European countries.
The major solution is the reform of Government policies and also change of the old communist mentality in People.
EU: Clocks – Market Report. Analysis and Forecast to 2020IndexBox Marketing
IndexBox Marketing has just published its report: “EU: Clocks - Market Report. Analysis And Forecast To 2020”. This report focuses on the EU clock market, providing a comprehensive analysis and the most recent data on its market size and volume, EU trade, price dynamics, domestic production, and turnover in the industry. The market trends section reveals the main issues and uncertainties concerning the industry, while the medium-term outlook uncovers market prospects. The attractivity index (IB Index) summarizes the source of existing opportunities as they appear in this market, as well as an interpretation of the trade figures.
World: Motorcycles And Scooters - Market Report. Analysis and Forecast to 2020IndexBox Marketing
IndexBox Marketing has just published its report: "World: Motorcycles And Scooters - Market Report. Analysis and Forecast to 2020". This report has been designed to provide a detailed analysis of the global motorcycle and scooter market. It covers the most recent data sets of quantitative medium-term projections, as well as developments in production, trade, consumption and prices. The report also includes a comparative analysis of the leading consuming countries, revealing opportunities opened for producers and exporters across the globe. The forecast outlines market prospects to 2020.
Monthly statistical e-bulletin comprising about 30 tables and some charts with the latest available economic/financial market indicators, both Indian and Global.
EU: Parts And Accessories Of Motor Vehicles - Market Report. Analysis And For...IndexBox Marketing
IndexBox Marketing has just published its report: “EU: Parts And Accessories Of Motor Vehicles - Market Report. Analysis And Forecast To 2020”. This report focuses on the EU motor vehicle accessory market, providing a comprehensive analysis and the most recent data on its market size and volume, EU trade, price dynamics, domestic production, and turnover in the industry. The market trends section reveals the main issues and uncertainties concerning the industry, while the medium-term outlook uncovers market prospects. The attractivity index (IB Index) summarizes the source of existing opportunities as they appear in this market, as well as an interpretation of the trade figures.
In continuation of NITI Brief # 1, it is now sought to analyse the expenditure outlays under the Central Plan in the Union Budget 2015-16, and their implications for the remaining two years of the Twelfth Five Year Plan, the national development agenda and expected outcomes.
EU: Automatic Circuit Breakers – Market Report. Analysis and Forecast to 2020IndexBox Marketing
IndexBox Marketing has just published its report: “EU: Automatic Circuit Breakers - Market Report. Analysis And Forecast To 2020”. This report focuses on the EU automatic circuit breaker market, providing a comprehensive analysis and the most recent data on its market size and volume, EU trade, price dynamics, domestic production, and turnover in the industry. The market trends section reveals the main issues and uncertainties concerning the industry, while the medium-term outlook uncovers market prospects. The attractivity index (IB Index) summarizes the source of existing opportunities as they appear in this market, as well as an interpretation of the trade figures.
World: Sulphur - Market Report. Analysis And Forecast To 2020IndexBox Marketing
IndexBox Marketing has just published its report: "World: Sulphur - Market Report. Analysis And Forecast To 2020". This report has been designed to provide a detailed analysis of the global sulphur market. It covers the most recent data sets of quantitative medium-term projections, as well as developments in production, trade, consumption and prices. The report also includes a comparative analysis of the leading consuming countries, revealing opportunities opened for producers and exporters across the globe. The forecast outlines market prospects to 2020.
EU: Relays - Market Report. Analysis And Forecast To 2020IndexBox Marketing
IndexBox Marketing has just published its report: "EU: Relays - Market Report. Analysis And Forecast To 2020". The report provides an in-depth analysis of the EU relay market. It presents the latest data of the market size and volume, domestic production, exports and imports, price dynamics and turnover in the industry. The report shows the sales data, allowing you to identify the key drivers and restraints. You can find here a strategic analysis of key factors influencing the market. Forecasts illustrate how the market will be transformed in the medium term. Profiles of the leading companies and brands are also included.
EU: Cyclic Hydrocarbons – Market Report. Analysis and Forecast to 2020IndexBox Marketing
IndexBox Marketing has just published its report: “EU: Cyclic Hydrocarbons - Market Report. Analysis And Forecast To 2020”. This report focuses on the EU cyclic hydrocarbon market, providing a comprehensive analysis and the most recent data on its market size and volume, EU trade, price dynamics, domestic production, and turnover in the industry. The market trends section reveals the main issues and uncertainties concerning the industry, while the medium-term outlook uncovers market prospects. The attractivity index (IB Index) summarizes the source of existing opportunities as they appear in this market, as well as an interpretation of the trade figures.
BCN Turkey is a leading international business development and marketing consulting firm that specializes in foreign investment consulting, media and public relation services in Turkey.
how can i use my minded pi coins I need some funds.DOT TECH
If you are interested in selling your pi coins, i have a verified pi merchant, who buys pi coins and resell them to exchanges looking forward to hold till mainnet launch.
Because the core team has announced that pi network will not be doing any pre-sale. The only way exchanges like huobi, bitmart and hotbit can get pi is by buying from miners.
Now a merchant stands in between these exchanges and the miners. As a link to make transactions smooth. Because right now in the enclosed mainnet you can't sell pi coins your self. You need the help of a merchant,
i will leave the telegram contact of my personal pi merchant below. 👇 I and my friends has traded more than 3000pi coins with him successfully.
@Pi_vendor_247
Introduction to Indian Financial System ()Avanish Goel
The financial system of a country is an important tool for economic development of the country, as it helps in creation of wealth by linking savings with investments.
It facilitates the flow of funds form the households (savers) to business firms (investors) to aid in wealth creation and development of both the parties
how can I sell pi coins after successfully completing KYCDOT TECH
Pi coins is not launched yet in any exchange 💱 this means it's not swappable, the current pi displaying on coin market cap is the iou version of pi. And you can learn all about that on my previous post.
RIGHT NOW THE ONLY WAY you can sell pi coins is through verified pi merchants. A pi merchant is someone who buys pi coins and resell them to exchanges and crypto whales. Looking forward to hold massive quantities of pi coins before the mainnet launch.
This is because pi network is not doing any pre-sale or ico offerings, the only way to get my coins is from buying from miners. So a merchant facilitates the transactions between the miners and these exchanges holding pi.
I and my friends has sold more than 6000 pi coins successfully with this method. I will be happy to share the contact of my personal pi merchant. The one i trade with, if you have your own merchant you can trade with them. For those who are new.
Message: @Pi_vendor_247 on telegram.
I wouldn't advise you selling all percentage of the pi coins. Leave at least a before so its a win win during open mainnet. Have a nice day pioneers ♥️
#kyc #mainnet #picoins #pi #sellpi #piwallet
#pinetwork
Falcon stands out as a top-tier P2P Invoice Discounting platform in India, bridging esteemed blue-chip companies and eager investors. Our goal is to transform the investment landscape in India by establishing a comprehensive destination for borrowers and investors with diverse profiles and needs, all while minimizing risk. What sets Falcon apart is the elimination of intermediaries such as commercial banks and depository institutions, allowing investors to enjoy higher yields.
what is the best method to sell pi coins in 2024DOT TECH
The best way to sell your pi coins safely is trading with an exchange..but since pi is not launched in any exchange, and second option is through a VERIFIED pi merchant.
Who is a pi merchant?
A pi merchant is someone who buys pi coins from miners and pioneers and resell them to Investors looking forward to hold massive amounts before mainnet launch in 2026.
I will leave the telegram contact of my personal pi merchant to trade pi coins with.
@Pi_vendor_247
What website can I sell pi coins securely.DOT TECH
Currently there are no website or exchange that allow buying or selling of pi coins..
But you can still easily sell pi coins, by reselling it to exchanges/crypto whales interested in holding thousands of pi coins before the mainnet launch.
Who is a pi merchant?
A pi merchant is someone who buys pi coins from miners and resell to these crypto whales and holders of pi..
This is because pi network is not doing any pre-sale. The only way exchanges can get pi is by buying from miners and pi merchants stands in between the miners and the exchanges.
How can I sell my pi coins?
Selling pi coins is really easy, but first you need to migrate to mainnet wallet before you can do that. I will leave the telegram contact of my personal pi merchant to trade with.
Tele-gram.
@Pi_vendor_247
Turin Startup Ecosystem 2024 - Ricerca sulle Startup e il Sistema dell'Innov...Quotidiano Piemontese
Turin Startup Ecosystem 2024
Una ricerca de il Club degli Investitori, in collaborazione con ToTeM Torino Tech Map e con il supporto della ESCP Business School e di Growth Capital
US Economic Outlook - Being Decided - M Capital Group August 2021.pdfpchutichetpong
The U.S. economy is continuing its impressive recovery from the COVID-19 pandemic and not slowing down despite re-occurring bumps. The U.S. savings rate reached its highest ever recorded level at 34% in April 2020 and Americans seem ready to spend. The sectors that had been hurt the most by the pandemic specifically reduced consumer spending, like retail, leisure, hospitality, and travel, are now experiencing massive growth in revenue and job openings.
Could this growth lead to a “Roaring Twenties”? As quickly as the U.S. economy contracted, experiencing a 9.1% drop in economic output relative to the business cycle in Q2 2020, the largest in recorded history, it has rebounded beyond expectations. This surprising growth seems to be fueled by the U.S. government’s aggressive fiscal and monetary policies, and an increase in consumer spending as mobility restrictions are lifted. Unemployment rates between June 2020 and June 2021 decreased by 5.2%, while the demand for labor is increasing, coupled with increasing wages to incentivize Americans to rejoin the labor force. Schools and businesses are expected to fully reopen soon. In parallel, vaccination rates across the country and the world continue to rise, with full vaccination rates of 50% and 14.8% respectively.
However, it is not completely smooth sailing from here. According to M Capital Group, the main risks that threaten the continued growth of the U.S. economy are inflation, unsettled trade relations, and another wave of Covid-19 mutations that could shut down the world again. Have we learned from the past year of COVID-19 and adapted our economy accordingly?
“In order for the U.S. economy to continue growing, whether there is another wave or not, the U.S. needs to focus on diversifying supply chains, supporting business investment, and maintaining consumer spending,” says Grace Feeley, a research analyst at M Capital Group.
While the economic indicators are positive, the risks are coming closer to manifesting and threatening such growth. The new variants spreading throughout the world, Delta, Lambda, and Gamma, are vaccine-resistant and muddy the predictions made about the economy and health of the country. These variants bring back the feeling of uncertainty that has wreaked havoc not only on the stock market but the mindset of people around the world. MCG provides unique insight on how to mitigate these risks to possibly ensure a bright economic future.
USDA Loans in California: A Comprehensive Overview.pptxmarketing367770
USDA Loans in California: A Comprehensive Overview
If you're dreaming of owning a home in California's rural or suburban areas, a USDA loan might be the perfect solution. The U.S. Department of Agriculture (USDA) offers these loans to help low-to-moderate-income individuals and families achieve homeownership.
Key Features of USDA Loans:
Zero Down Payment: USDA loans require no down payment, making homeownership more accessible.
Competitive Interest Rates: These loans often come with lower interest rates compared to conventional loans.
Flexible Credit Requirements: USDA loans have more lenient credit score requirements, helping those with less-than-perfect credit.
Guaranteed Loan Program: The USDA guarantees a portion of the loan, reducing risk for lenders and expanding borrowing options.
Eligibility Criteria:
Location: The property must be located in a USDA-designated rural or suburban area. Many areas in California qualify.
Income Limits: Applicants must meet income guidelines, which vary by region and household size.
Primary Residence: The home must be used as the borrower's primary residence.
Application Process:
Find a USDA-Approved Lender: Not all lenders offer USDA loans, so it's essential to choose one approved by the USDA.
Pre-Qualification: Determine your eligibility and the amount you can borrow.
Property Search: Look for properties in eligible rural or suburban areas.
Loan Application: Submit your application, including financial and personal information.
Processing and Approval: The lender and USDA will review your application. If approved, you can proceed to closing.
USDA loans are an excellent option for those looking to buy a home in California's rural and suburban areas. With no down payment and flexible requirements, these loans make homeownership more attainable for many families. Explore your eligibility today and take the first step toward owning your dream home.
How to get verified on Coinbase Account?_.docxBuy bitget
t's important to note that buying verified Coinbase accounts is not recommended and may violate Coinbase's terms of service. Instead of searching to "buy verified Coinbase accounts," follow the proper steps to verify your own account to ensure compliance and security.
when will pi network coin be available on crypto exchange.DOT TECH
There is no set date for when Pi coins will enter the market.
However, the developers are working hard to get them released as soon as possible.
Once they are available, users will be able to exchange other cryptocurrencies for Pi coins on designated exchanges.
But for now the only way to sell your pi coins is through verified pi vendor.
Here is the telegram contact of my personal pi vendor
@Pi_vendor_247
The secret way to sell pi coins effortlessly.DOT TECH
Well as we all know pi isn't launched yet. But you can still sell your pi coins effortlessly because some whales in China are interested in holding massive pi coins. And they are willing to pay good money for it. If you are interested in selling I will leave a contact for you. Just telegram this number below. I sold about 3000 pi coins to him and he paid me immediately.
Telegram: @Pi_vendor_247
Even tho Pi network is not listed on any exchange yet.
Buying/Selling or investing in pi network coins is highly possible through the help of vendors. You can buy from vendors[ buy directly from the pi network miners and resell it]. I will leave the telegram contact of my personal vendor.
@Pi_vendor_247
4. Growth Forecasts of International Organizations (%)
In 2014, Turkish economy grew by 2.9%.
According to the IMF, Turkish Economy is expected to grow by 3% in
2015 and 2.9% in 2016
Source: IMF, OECD, WB
January 2016 Ministry of Economy 4
Growth Forecast for Selected Countries/Country Groups(%)
World Turkey Euro Area US Brazil Russia India China
IMF
2015 3,1 3,0 1,5 2,5 -3,8 -3,7 7,3 6,9
2016 3,4 2,9 1,7 2,6 -3,5 -1,0 7,5 6,3
OECD
2015 2,9 3,1 1,5 2,4 -3,1 -4,0 7,2 6,8
2016 3,3 3,4 1,8 2,5 -1,2 -0,4 7,3 6,5
WB
2015 2,4 4,2 1,5 2,5 -3,7 -3,8 7,3 6,9
2016 2,9 3,5 1,7 2,7 -2,5 -0,7 7,8 6,7
5. According to the IMF estimates, global trade volume of merchandise and
services is expected to increase by 3.2% in in 2015 and 4.1% in 2016.
According to the WTO estimates, global trade volume of merchandise and
services is expected to increase by 2.8% in 2015 and 3.9% in 2016.
Forecasts for Merchandise Trade Growth (%)
Source: IMF and WTO
January 2016 Ministry of Economy 5
Forecasts for Merchandise Trade Growth(%)
World Trade
VolumeYears
Exports Imports
Advanced
Economies
Emerging
Economies
Advanced
Economies
Emerging
Economies
IMF
2015 2,8 3,5 3,7 1,5 3,2
2016 3,1 4,6 4,0 4,3 4,1
WTO
2015 3,0 2,4 3,1 2,5 2,8
2016 3,9 3,8 3,2 5,2 3,9
6. Top 20 Economies (Current, PPP)
Source: IMF
Turkey ranks as the 18th largest economy in the World and 7th in Europe.
January 2016 Ministry of Economy 6
7. Economic Targets of 2016-2018 Medium Term Program
**Purchasing Power Parity
(Medium Term Program, Ministry of Development)
Medium Term Program, which covers 2016-2018 period, aims to
increase growth as well as providing its comprehension via
structural reforms, while continuing to reduce the current account
deficit and inflation gradually.
January 2016 Ministry of Economy 7
2015 2016 2017 2018
GDP (Billion TL, Current Prices) 1963 2207 2489 2770
GDP Per Capita ($)** 20.298 21.240 22.460 23.829
Real GDP Growth 4,0 4,5 5,0 5,0
Unemployment Rate(%) 10,2 10,2 9,9 9,6
Tourism Income (Billion $) 27,0 27,0 29,4 31,8
Current Account Balance (Billion $) -31,7 -28,6 -29,3 -29,9
Current Account Balance/GDP(%) -4,4 -3,9 -3,7 -3,5
8. Real GDP Growth of Selected Countries/Country Groups (2014)
Turkish Economy expanded by 4.2% in 2013 and 2.9% in 2014.
Source: TURKSTAT, IMF
January 2016 Ministry of Economy 8
9. Economic Growth Rates (2002-2015)
Source: TURKSTAT
Mean annual growth rate between 2002 and 2014 was 4.7%.
GDP growth for the 1st quarter of 2015 was 2.5%, 3.8% for the 2nd quarter
and 4% for the third quarter
Growth rate was 3.4% for the first 9 months of this year.
January 2016 Ministry of Economy 9
5.3
9.4
8.4
6.9
4.7
0.7
-4.8
9.2
8.8
2.1
4.2
2.9
2.5
3.8 4.0
-6.0
-4.0
-2.0
0.0
2.0
4.0
6.0
8.0
10.0
12.0
2003 2004 2005 2006 2007 2008 2009 2010 2011 2012 2013 2014 2015-I 2015-II 2015-III
10. GDP Per Capita
Source: TURKSTAT,
Since 2002 GDP per capita has tripled from 3,492 USD to 10,390 USD in
2014. In PPP terms GDP per capita exceeded 19,000 USD in 2014.
January 2016 Ministry of Economy 10
11. Capacity Utilization Ratio (%)
Source: CBRT
Capacity utilization ratio in january 2016 decreased by 0.9 points
compared to that of previous month and realized as 74,9%.
January 2016 Ministry of Economy 11
12. Industrial Production Index (2010=100)
Source: TURKSTAT
Industrial production index rose by 3,6% year-on-year to 130,0 (2010=100) in
October 2015.
January 2016 Ministry of Economy 12
13. PMI (Purchasing Manager Index)
PMI increased to 52,2 in December 2015, higher than the
previous month’s level (50,9).
January 2016 Ministry of Economy 13
14. Inflation (Annual Percentage Change)
Inflation rates in December 2015 were 8.8% and 5.71% according to CPI
and PPI, respectively.
Source: TURKSTAT
January 2016 Ministry of Economy 14
15. Unemployment Rates (%)
Source: TURKSTAT
In October 2015, unemployment rate was 10.5% . In 2014, it was 9.9%.
Seasonally adjusted unemployment rate in Euro Area was 10.5 % and 9.1 % in (EU28) in
October 2015. In terms of unemployment ratio Turkey outperformed 6 EU members according
to current data.
After Russia, Germany, England and France, Turkey has the 5th largest labor force among the
European countries. (2014, Economist Intelligence Unit)
January 2016 Ministry of Economy 15
16. CDS Premiums (January 25th, 2016)
Source: Deutsche Bank Research, Bloomberg
* Higher CDS premiums indicate higher risk levels.
January 2016 Ministry of Economy 16
44
68
105
128
119
166
209
174
286
294
489
374
0 100 200 300 400 500 600
Ireland
S.Korea
Spain
China
Italy
Hungary
Portugal
Bulgaria
Turkey
Croatia
Brazil
Russia
17. Central Government Budget Deficit/ GDP (%)
Central government budget deficit/GDP ratio in 2013 was 1.2% and Turkey complied
with the Maastricht criteria of 3%. Turkey also outperformed 22 EU Countries. For the
year 2014, the same ratio was 1.3%.
In January-December 2015 period, central government budget deficit was 22,6 billion
TL compared to 23,3 billion TL deficit in the same period of 2014.
Source: Eurostat, TUİK
* 2014
January 2016 Ministry of Economy 17
18. Government Debt / GDP (%)
Debt/GDP ratio of Turkey was 36.2% in 2013 indicating a level below the
Maastricht Criterion (60%). Turkey also outperformed 25 EU countries.
In 2014, the ratio was realized at 33.5%
Source: Eurostat
*2014
January 2016 Ministry of Economy 18
21. Targets in Merchandise Trade
Turkish Statistical Institute
*Forecast: Medium Term Programme, Ministry of Development, 2016-2018)
**The Exports Strategy of Turkey For 2023
January 2016 Ministry of Economy 21
(Billion $) 2014 2015* 2016* 2017* 2018* 2023**
Exports 157.6 143.9 155.5 175.8 201.4 500
Imports 242.2 207.1 210.7 243.1 273.2 625
Volume of trade 399.8 351.0 366.2 418.9 474.6 1125
Balance of trade -84.5 -63.1 -55.2 -67.2 -71.8 -125
Exports/Imports (%) 65.1 69.5 73.8 72.3 73.7 80
22. Turkey's Share in Global Merchandise Exports (%)
Turkey’s share in global merchandise exports was %0.83 in
2014.
January 2016 Ministry of Economy 22
23. Turkey's Share in Global Merchandise Imports (%)
Turkey’s share in global merchandise imports was %1.27 in 2014.
January 2016 Ministry of Economy 23
24. Foreign Trade Developments
In first eleven months of 2015, compared to the same period of 2014, exports decreased by 8.4%
and imports decreased by 14,1%.
Source: Ministry of Economy
* Energy corresponds to Chapter 27.
January 2016 Ministry of Economy 24
2013 2014 2014/(JAN-NOV) 2015/(JAN - NOV)
Change (%)
2014/2015
Export 151.8 157.6 144.3 132.2 -8.4
Energy Export* 6.7 6.1 5.7 4.2 -27.1
Gold Export 3.3 3.2 3.2 7.4 132.2
Import 251.7 242.2 220.4 189.2 -14.1
Energy Import* 55.9 54.9 50.5 34.8 -31.0
Gold Import 15.1 7.1 6.5 3.1 -52.2
Foreign Trade Volume 403.5 399.8 364.7 321.4 -11.9
Foreign Trade Balance -99.9 -84.6 -76.0 -57.0 -25.0
Balance excl. Energy -50.7 -35.8 -31.3 -26.4 -15.8
Export/Import (%) 60.3 65.1 65.5 69.9 6.7
Annual (Billion $) Periodic (Billion Dollar)
25. Monthly Exports and Imports
In November, 2015 compared to the same month of 2014, exports have decreased by 10.2% and realized
as 11.7 billion dollars and imports have decreased by 25.3% down to the level of 15.9 billion dollars.
January 2016 Ministry of Economy 25
29. Main Export Partners (Share,%)
Main Trade Partners (January –November 2015)
Main Import Partners (Share,%)
Source: TURKSTAT
January 2016 Ministry of Economy 29
9.3
7.4
6.1
4.7
4.4
Germany
United Kingdom
Iraq
Italy
USA
12
10.2
9.9
5.4
5.1
China
Germany
Russia
Italy
USA
30. Exports by Regions
Source: TURKSTAT
January 2016 Ministry of Economy 30
2014 2015 % Share % Chg. 2014 2015 % Share % Chg.
EU (28) 5,720 5,631 48.0 -1.5 63,178 58,633 44.4 -7.2
FREE ZONES IN TURKEY 182 149 1.3 -18.1 2,074 1,741 1.3 -16.1
OTHER EUROPE 1,152 855 7.3 -25.8 14,243 13,428 10.2 -5.7
AFRİCA 1,056 1,059 9.0 0.3 12,517 11,274 8.5 -9.9
North Africa 748 712 6.1 -4.8 8,887 7,714 5.8 -13.2
Other Africa 308 347 3.0 12.7 3,631 3,560 2.7 -2.0
AMERICA 852 753 6.4 -11.6 9,083 8,414 6.4 -7.4
North America 653 559 4.8 -14.4 6,502 6,425 4.9 -1.2
Central America and Caraips 58 117 1.0 101.3 847 794 0.6 -6.3
South America 140 77 0.7 -45.0 1,734 1,195 0.9 -31.1
ASIA 4,056 3,240 27.6 -20.1 42,488 38,045 28.8 -10.5
Near and Middle East 3,099 2,418 20.6 -22.0 31,908 28,602 21.6 -10.4
Other Asia 958 822 7.0 -14.2 10,580 9,443 7.1 -10.7
AUSTRALIA and NEW ZEALAND 44 41 0.4 -5.2 543 561 0.4 3.4
OTHER COUNTRIES 6 9 0.1 50.1 216 99 0.1 -54.0
Total 13,067 11,738 100 -10.2 144,341 132,194 100 -8.4
EXPORT
(Million $)
November January-November
31. Imports by Regions
Source: TURKSTAT
January 2016 Ministry of Economy 31
2014 2015 % Share % Chg. 2014 2015 % Share % Chg.
EU(28) 7,426 6,395 40.0 -13.9 80,647 71,588 37.8 -11.2
FREE ZONES IN TURKEY 98 95 0.6 -3.7 1,165 1,128 0.6 -3.1
OTHER EUROPE 3,675 1,911 12.0 -48.0 33,283 25,771 13.6 -22.6
AFRİCA 657 380 2.4 -42.1 5,363 4,654 2.5 -13.2
North Africa 272 209 1.3 -23.0 3,127 2,733 1.4 -12.6
Other Africa 385 171 1.1 -55.6 2,236 1,921 1.0 -14.1
AMERICA 1,647 1,233 7.7 -25.1 17,168 15,323 8.1 -10.7
North America 1,168 850 5.3 -27.2 12,593 11,026 5.8 -12.4
Central America and Caraips 98 70 0.4 -28.5 1,019 962 0.5 -5.6
South America 381 313 2.0 -17.9 3,555 3,335 1.8 -6.2
ASIA 6,428 5,149 32.2 -19.9 69,864 61,203 32.3 -12.4
Near and Middle East 1,938 987 6.2 -49.1 18,887 12,485 6.6 -33.9
Other Asia 4,489 4,162 26.1 -7.3 50,978 48,718 25.7 -4.4
AUSTRALIA and NEW ZEALAND 92 78 0.5 -15.8 479 560 0.3 16.9
OTHER COUNTRIES 1,363 733 4.6 -46.2 12,421 8,994 4.8 -27.6
Total 21,385 15,974 100 -25.3 220,389 189,219 100 -14.1
(Million $)
November January-November
34. Turkey's Share in Global Services Exports (%)
Source: WTO
Turkey’s share in global exports of services was 1.03% in 2014.
January 2016 Ministry of Economy 34
35. Turkey's Share in Global Services Imports (%)
Source: WTO
Turkey’s share in global imports of services was 0.49% in 2014.
January 2016 Ministry of Economy 35
36. Contracting Services Abroad
42 out of the world’s top 250
contracting companies are Turkish.
Turkey ranks as the 2nd country
(following China) in terms of the
number of top contracting companies.
Contributions to the overall
economic performance: Creating
foreign exchange inflow, exports,
employment, technology transfer;
adding to the machinery stock,
facilitating internationalization.
Regional Breakdown of Projects(%)
Years Projects Countries
Project
Volume
(Million $)
Cum.
Project
Volume
(Million $)
Avr.
Project
Volume
(Million $)
1971-2001 2256 48 46,584 46,584 21
2002 208 34 4,127 50,711 20
2003 343 35 6,401 57,112 19
2004 476 36 8,460 65,573 18
2005 451 33 13,245 78,818 29
2006 575 35 22,205 101,023 39
2007 610 45 25,122 126,145 41
2008 657 39 23,874 150,019 36
2009 512 45 20,189 170,207 39
2010 624 50 23,446 193,653 38
2011 552 51 23,027 216,680 42
2012 533 48 29,741 246,421 56
2013 416 48 29,977 276,398 73
2014 324 46 26,824 303,222 83
2015 156 42 19,366 322,588 124
Last updated on December 2015
January 2016 Ministry of Economy 36
38. Foreign Direct Investment
FDI reached 148.75 billion USD in 2003-2014 period, while it
was 14.6 billion USD in 1984-2002 period.
FDI increased 23.2 % in 2015 January-November with respect to
previous period and reached 14.1 billion USD.
Source: CBRT
January 2016 Ministry of Economy 38
39. Foreign Direct Investment Abroad
Turkish citizens’ direct investments abroad reached 33 billion USD from
2003 to date.
Outward FDI, for the period 2015 January-November and reached 4.9 billion
USD.
Source: CBRT
January 2016 Ministry of Economy 39
40. The Sectoral Breakdown of Foreign Investments
Source: CBRT
*January-November
January 2016 Ministry of Economy 40
(Million $) 2013 2014 2014* 2015*
AGRICULTURE 47 61 57 46
INDUSTRIAL SECTORS 4,819 4,844 4,346 5,132
Mining and Quarrying 242 364 364 194
Manufacturing 2,207 2,894 2,646 3,601
Production and Distribution of Electricity & Gas 2,334 1,583 1,333 1,335
SERVICES SECTOR 5,000 3,979 3,370 4,794
TOTAL 9,866 8,884 7,773 9,972
41. Breakdown of Foreign Investments by Country
*January-November
Source: CBRT
January 2016 Ministry of Economy 41
2013 2014* 2015*
1 Spain 506 57 2,154
2 USA 326 175 1,479
3 Netherlands 918 1,949 1,024
4 Russia 875 729 757
5 Belgium 60 39 733
6 England 300 1,033 454
7 China 9 28 446
8 Qatar 469 8 350
9 Luxembourg 278 522 337
10 Malaysia 12 0 327
11 Germany 1,968 624 324
12 Japan 439 211 298
13 Azerbaijan 803 716 294
14 Swiss 204 152 161
15 France 217 97 158
16 Italy 146 473 150
17 Greece 68 92 89
18 United Arab Emirates 176 98 67
19 South Korea 61 42 61
20 Austria 647 48 54
LIST TOTAL 8,482 7,093 9,717
TOTAL 9,866 7,773 9,972
Million Dolar
42. Investment Incentive System
The current investment incentive system of
Turkey is structured in four sub systems:
General Investment Incentive System
Regional Investment Incentive System
Investment Incentive System for Big Scale
Projects
Incentive System for Strategic Investments
January 2016 Ministry of Economy 42
43. Investment Incentives
*January – November
Source: General Directorate of Incentive Implementation and Foreign Investment
January 2016 Ministry of Economy 43
Certificates
Issued
Amount of
Fixed
Investment
(Million TL)
Potential
Employment
(People)
Total Total Total
2013 4,856 96,121 194,385
2014 4,033 64,022 144,471
2015* 3,959 90,655 128,430
Region 1 Region 2 Region 3 Region 4 Region 5 Region 6 Various TOTAL
2013 1,753 797 686 505 470 619 26 4,856
2014 1,446 707 591 447 365 459 17 4,033
2015* 1,303 788 579 426 417 436 10 3,959
CERTIFICATESISSUED
44. D - FREE ZONES IN TURKEY
January 2016 Ministry of Economy 44
45. Tax advantages for manufacturers
Medium-and long-term investment view
Availability to transfer profits
Commercial facilities
Exemption from customs duties
Acquisition of the documents relating to the free movement of goods under
the scope of Customs Union with the EU
Principle of equality
No time restrictions
Flexibility to adjust to the market needs and conditions
Reliable inflation accounting
Market access to domestic and foreign markets
Reduced bureaucratic procedures and dynamic business management
Strategic advantages
Affordable and compatible infrastructure
Supply chain opportunities
The Advantages of Free Zones for Users
January 2016 Ministry of Economy 45
46. Free Zones in Turkey
61,505 people have been employed in Free Zones of Turkey in 2014.
January 2016 Ministry of Economy 46
47. Trade Flows of Free Zones
In 2014, total trade volume of the Free Zones reached 22.4
billion dollars, decreasing 3.5% annually.
Source: General Directorate of Free Zones, Foreign Investments and Services
2008 2009 2010 2011 2012 2013 2014
3,195 2,177 2,295 2,668 2,971 2,887 2,732
5,874 4,913 4,361 6,924 7,071 7,701 7,958
8,248 5,493 6,625 7,253 7,257 7,490 7,059
7,262 5,173 5,291 5,801 5,754 5,162 4,683
24,579 17,756 18,572 22,646 23,053 23,240 22,432TOTAL TRADE VOLUME
Million Dollar
From Domestic Market to Free Zones
From Free Zones to Abroad
From Abroad to Free Zones
From Free Zones to Domestic Markets
January 2016 Ministry of Economy 47
48. Concentration in Free Zones by Industries
Source: General Directorate of Free Zones, Foreign Investments and Services
Istanbul Ataturk Airport FZ Services and Software
Antalya FZ Yacht-building, Medical Equipment
Kocaeli FZ Ship-building
Avrupa FZ Ready-Wear
Mersin FZ Ready-Wear
Bursa FZ Automotive sub-industries
Izmir FZ Leather
TUBITAK-MAMFZ R&D Activities
Adana-Yumurtalik FZ Ship Repair and Maintenance
January 2016 Ministry of Economy 48
49. E - BILATERAL, REGIONAL,
PLURILATERAL and MULTILATERAL
TRADE
January 2016 Ministry of Economy 49
50. Trade Relationships of Turkey with Others
Bilateral Trade Relationships of Turkey
Europe, Asia-Pacific, Eurasia, Middle East and North Africa,
Sub-Saharan Africa, Americas
Regional and Multiple Trade Relationships of
Turkey
EU, ECO, D8, BSEC, OIC, COMCEC
Multilateral Trade Relationships of Turkey
WTO, OECD, G20
January 2016 Ministry of Economy 50
51. 1. EFTA (Norway, Switzerland, Iceland,
Liechtenstein)
2. Israel
3. Macedonia
4. Bosnia and Herzegovina
5. Palestine
6. Tunisia
7. Morocco
8. Syria (**)
9. Egypt
10. Albania
(*) Agreements that are in the approval process
(**) Pending
FTA Countries
11. Georgia
12. Montenegro
13. Serbia
14. Chile
15. Jordan
16. South Korea
17. Mauritius
18. Lebanon*
19. Kosovo*
20.Malaysia
21. Moldova*
22. Faroe Islands*
23. Singapore
January 2016 Ministry of Economy 51
52. 1. Ghana*
2. Ukraine
3. Colombia
4. Ecuador
5. Democratic Republic of the
Congo
6. Cameroon
7. Seychelles
FTA Countries(On-going Negotiations)
8. Gulf Cooperation Council
9. Libya
10. MERCOSUR
11. Japan
12. Peru
13. Mexico
* Negotiations completed.
January 2016 Ministry of Economy 52
53. Multilateral Trade Relationships
Trade in Services Aggrement (TISA)
Due to the stumble of Doha Development Round and ambitious targets of top services
exporters, TISA negotiations which continue between countries, who makes up 70% of
total world services, in order to increase liberalisation in services trade while Turkey is
included in the negotiations.
Non Agricultural Market Access (NAMA)
NAMA refering to all products not covered by the WTO-Agreement on Agriculture
(manufacturing products, fuels and mining products, fish and fish products, and forestry
products) targets to further liberalization on these product by both reducing tariff and
non-tariff barriers.
G-20 Presidency
The G-20 economies consisting of USA, Germany, Argentina, the European Union
Australia, Brazil, China, Indonesia, France, South Africa, South Korea, India, Britain, Italy,
Japan, Canada, Mexico, Russia, Saudi Arabia and Turkey represent approximately 90% of
the World GDP, 80% of the world trade, and two-thirds of the world population.
January 2016 Ministry of Economy 53
54. Regional Breakdown of Exports
Source: TURKSTAT
* January –November
** Except Lebanon and Kosovo
In January- November 2015, exports to EFTA countries increased by 64%
annually and the EFTA Countries became the fastest growing export destination
of the regions above.
January 2016 Ministry of Economy 54
(Million $) 2013 2014
Change
(%)
% Share
(2014)
2014* 2015*
Change
(%)
% Share
(2014)
EU-28 63,040 68,514 8.7 43.5 63,178 58,633 -7.2 43.8
CIS 16,924 15,616 -7.7 9.9 14,354 9,799 -31.7 9.9
EFTA 1,662 3,795 128.4 2.4 3,708 6,098 64.4 2.6
Economic Cooperation
Organization 11,898 11,717 -1.5 7.4 10,534 8,728 -17.1 7.3
Organization of Islamic Cooperation
49,371 48,625 -1.5 30.9 43,987 39,227 -10.8 30.5
Black Sea Economic
Cooperation 20,368 19,687 -3.3 12.5 18,133 13,422 -26.0 12.6
FTA Countries**
14,942 18,845 26.1 11.2 17,440 18,560 6.4 12.1
OECD 68,684 76,675 11.6 48.6 70,557 69,308 -1.8 48.9
Turkic Republics 6,908 7,108 2.9 4.5 6,470 4,880 -24.6 4.5
General Total 151,803 157,610 3.8 100 144,341 132,194 -8.4 100.0
55. Trade Representatives Abroad
The Ministry are serving in 110
countries, 154 locations and 4
offices abroad.
January 2016 Ministry of Economy 55
56. Daimi Temsilci Yardımcılığı
Ticaret Müşavirliği
Ticaret Ataşeliği
İrtibat Büroları
AFRİKA
Kahire
Nairobi
Pretoria
Rabat
Trablus
Tunus
Kazablanka
ASYA
Astana
Aşkabat
Bangkok
Bişkek
Cakarta
Duşanbe
Hanoi
İslamabad
Kabil
Kuala Lumpur
Manila
Pekin
Seul
Singapur
AVRUPA/KAFKASYA
AB
DTÖ
OECD
Atina
Bakü
Belgrad
Berlin
Bern
Bratislava
Brüksel
Budapeşte
Bükreş
Dublin
Helsinki
Kiev
Kişinev
Kopenhag
Lahey
Lizbon
Lefkoşa
Londra
Lubliyana
Madrid
Minsk
Moskova
Oslo
Paris
Podgorica
Prag
Priştine
Roma
Saraybosna
Sofya
Stokholm
Tiflis
Tiran
Üsküp
Varşova
Viyana
Zagreb
Barselona
Batum
Düsseldorf
Hamburg
Hannover
Kazan
Marsilya
Milano
Münih
Novorossisk
Odessa
Rotterdam
Selanik
St.
Petersburg
Stutgart
Birmingham
Krasnodar
Novosibirsk
Yekaterinbur
g
Taşkent
Tokyo
Ulan Bator
Yeni Delhi
Almatı
Guangzhou
Hong Kong
Karaçi
Mumbai
Şangay
Georgetown
Abuja
Addis Ababa
Akra
Cezayir
Dakar
Darüsselam
Hartum
İskenderiye
Buenos Aires
Karakas
Mexico City
Ottava
Santiago
Vaşington
Houston
Los Angeles
AMERİKA
ORTA DOĞU
Abu Dhabi
Amman
Bağdat
Beyrut
Doha
Kuveyt
Manama
Muskat
Riyad
Sana
Şam
Tahran
Tel Aviv
Basra
Cidde
Dubai
Erbil
Halep
Kudüs
Musul
Tebriz
Sidney
Melbourne
AVUSTRALYA
New York
Sao Paulo
Şikago
Toronto
Miami
San Francisco
Seattle
GEORGETOWN
Locations of Trade Representatives
56