Download to read offline
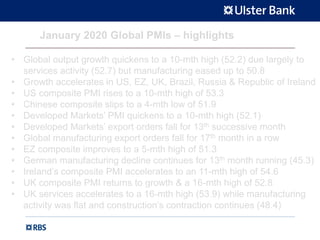
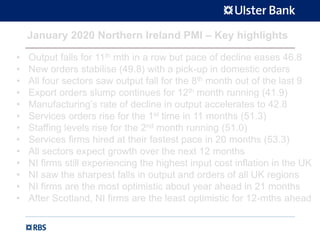
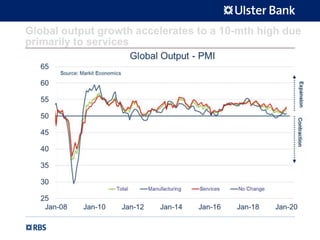
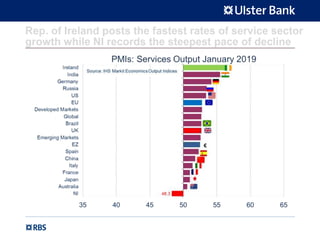
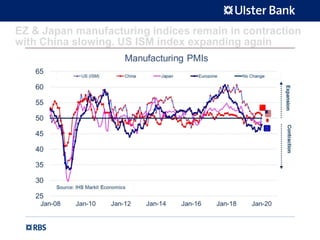
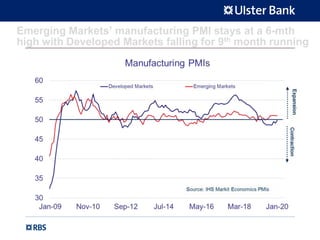
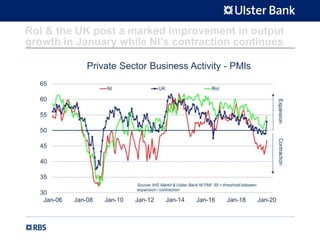
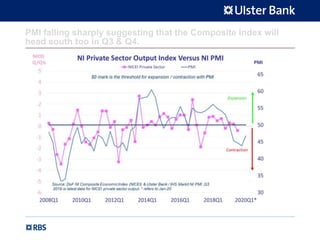
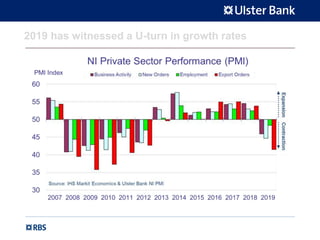
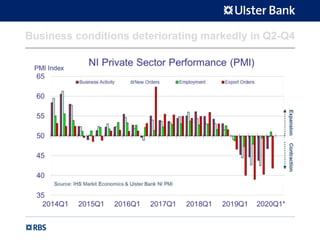
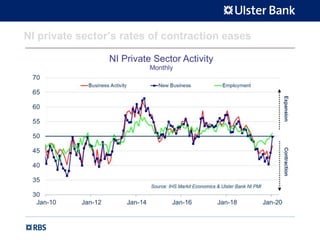
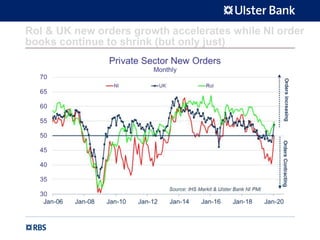
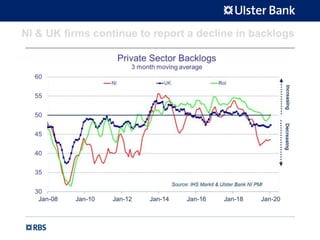
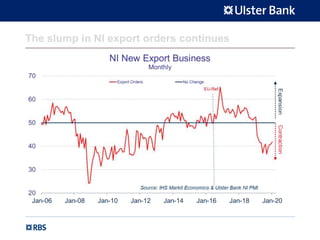
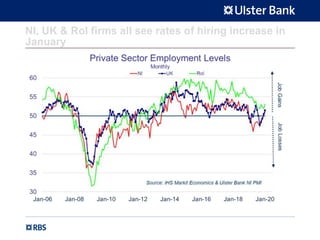
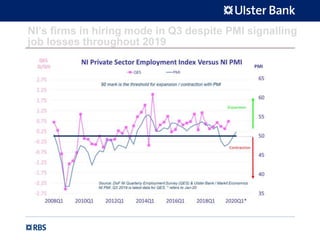
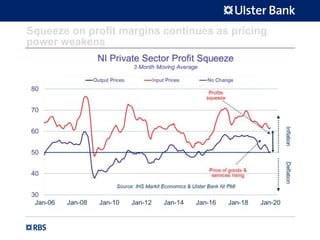
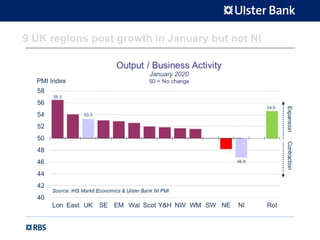
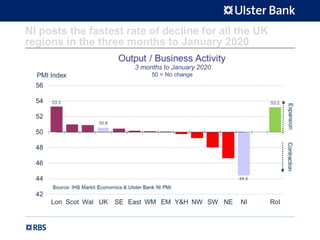
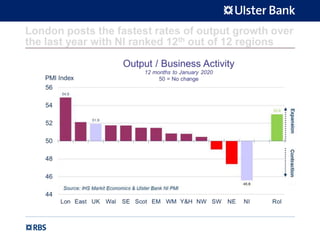
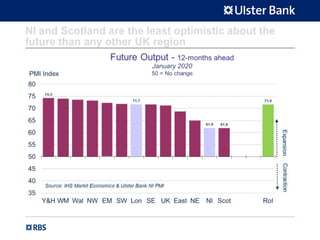
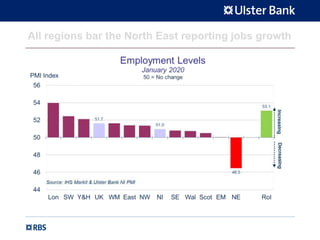
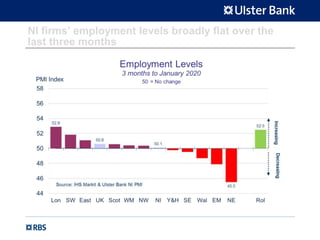
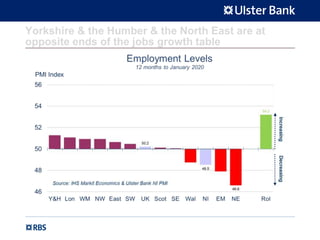
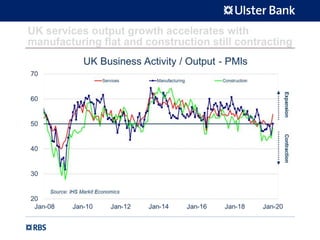
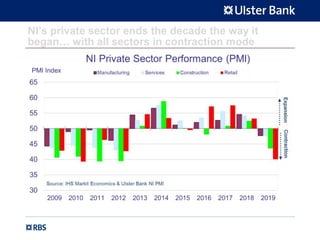
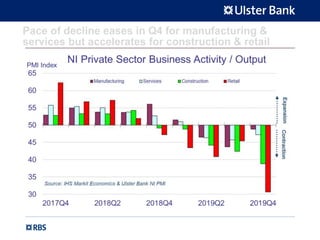
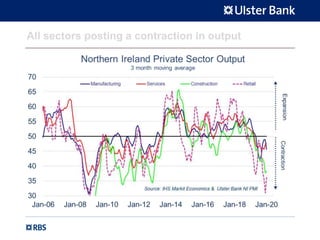
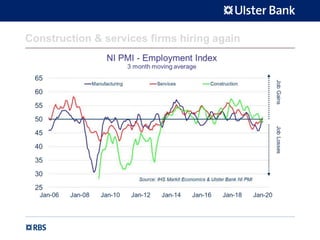
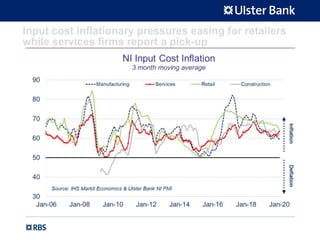
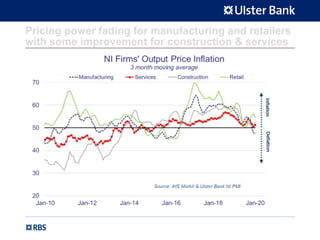
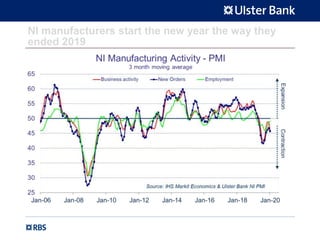
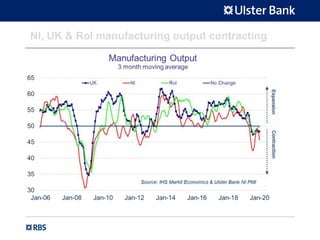
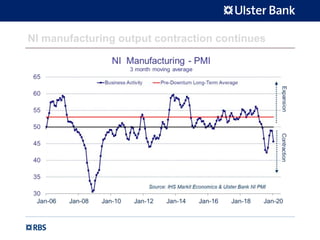
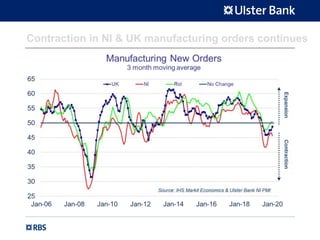
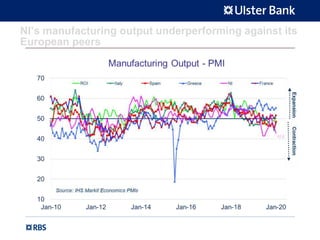
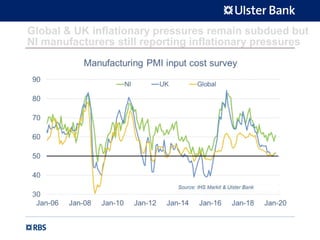
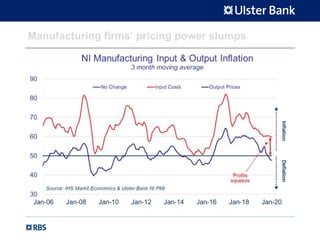
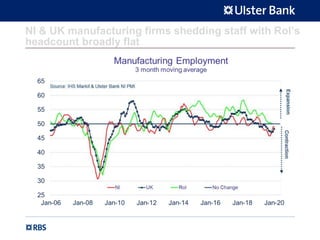
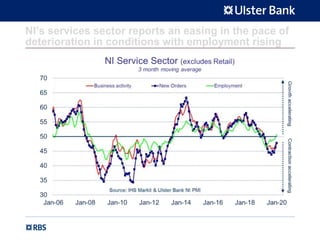
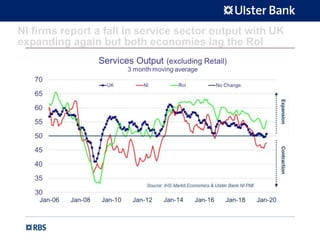
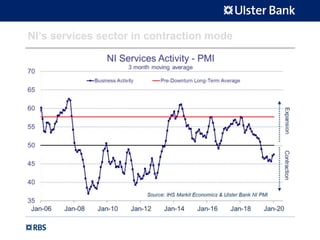
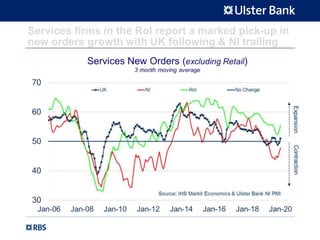
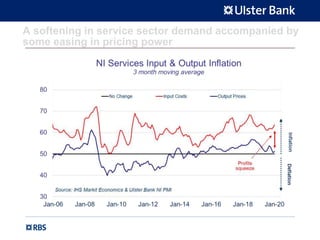
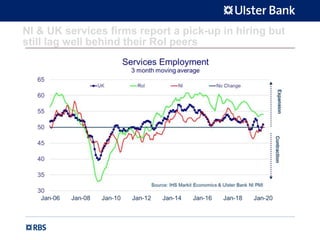
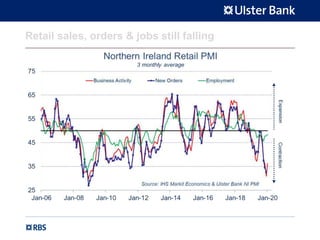
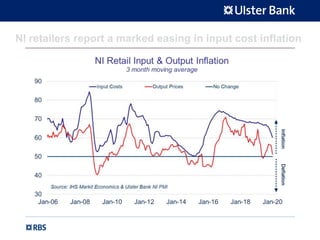
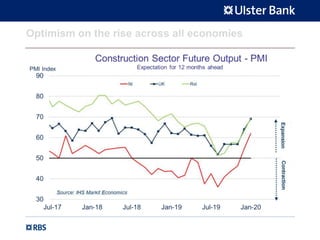
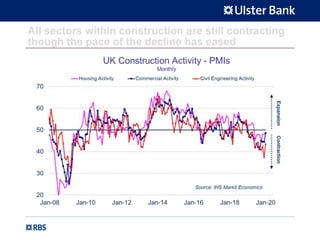
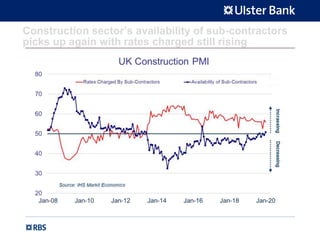
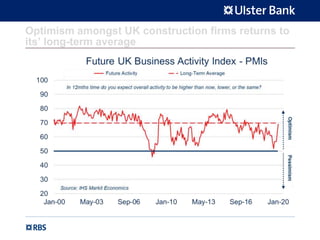

The Ulster Bank Northern Ireland Purchasing Managers Index (PMI) report for January 2020 highlights a mixed performance across various economies, with global output growth increasing to a 10-month high primarily due to the services sector. Northern Ireland continues to experience the steepest declines in output and orders among UK regions, while optimism about the future is gradually rising despite ongoing contractions in multiple sectors. The report emphasizes significant inflationary pressures and fluctuating hiring trends across different regions and sectors.


