Download as PDF, PPTX
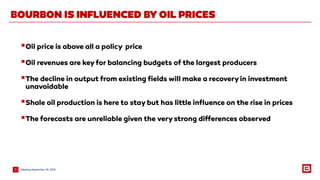
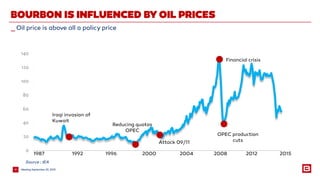
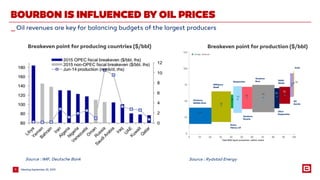
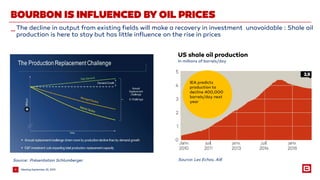

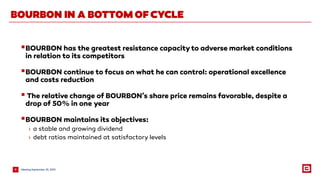
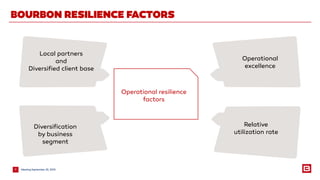
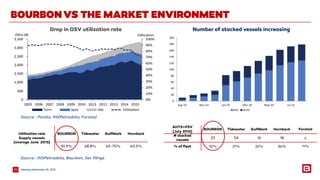
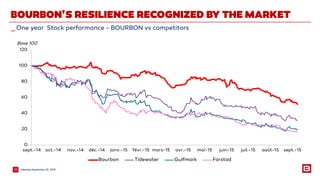
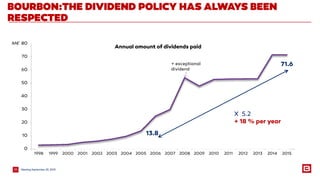

This document summarizes a presentation made to Bourbon shareholders on September 25, 2015. It discusses how Bourbon is influenced by oil prices, its operational and financial resilience factors, and how it compares to competitors in the current market environment. Bourbon aims to maintain a stable dividend, reduce debt levels, and potentially pursue options to further strengthen dividend growth or allow for share liquidity at a valuation reflecting the company's long-term economic value.


