Download as PDF, PPTX

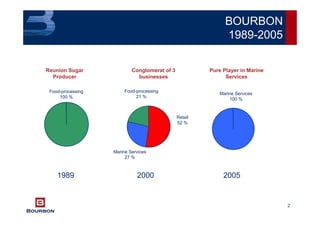
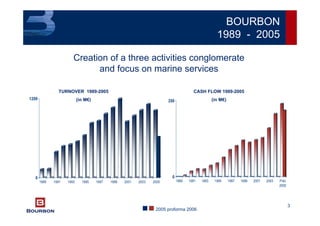
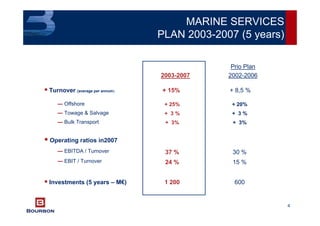
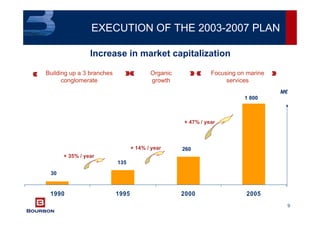
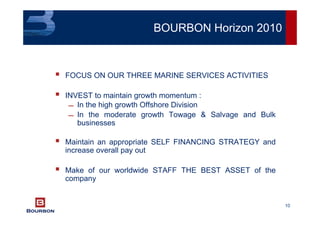
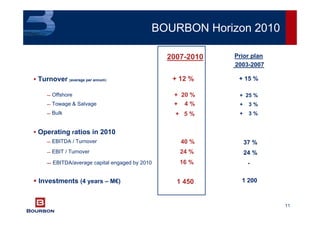
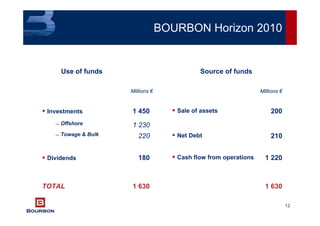
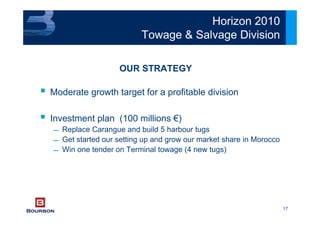
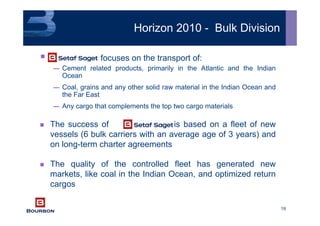
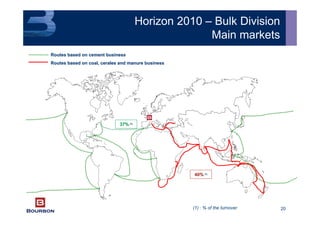
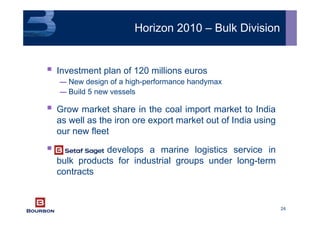
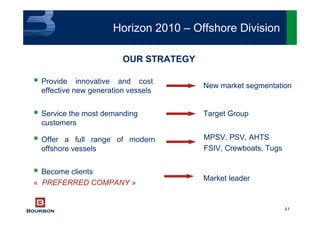

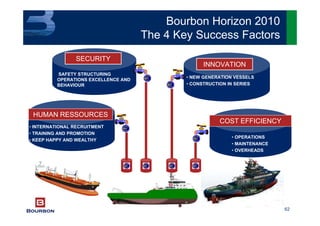
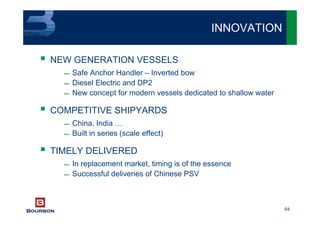
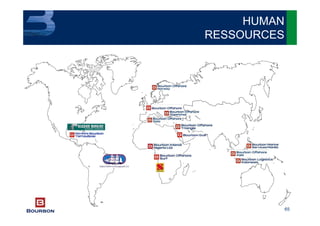
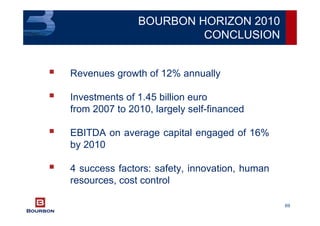

The document outlines Bourbon's strategic vision for 2010 and beyond, focusing on its transformation into a leading marine services conglomerate, specifically in offshore oil and gas, towage, and bulk shipping segments. It details investment plans, expected growth rates, and operational efficiencies targeted during the 2003-2007 period, alongside expected market developments in offshore services. The strategy emphasizes the development of innovative vessels, market leadership, and the importance of a skilled workforce in achieving these goals.


