Download as PDF, PPTX


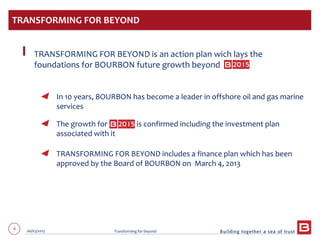
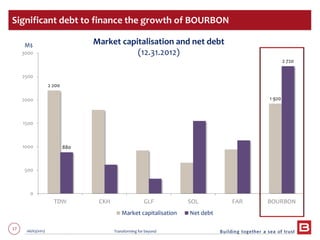
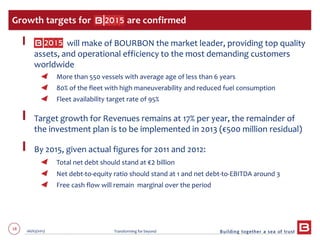

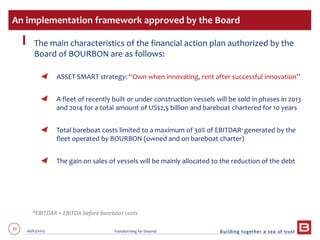


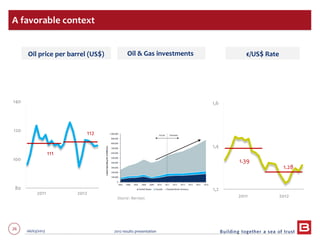
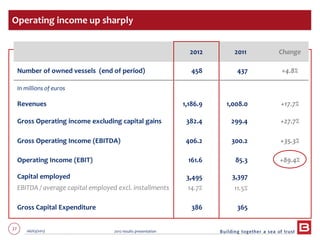
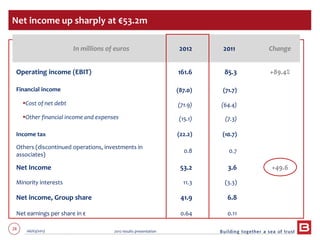
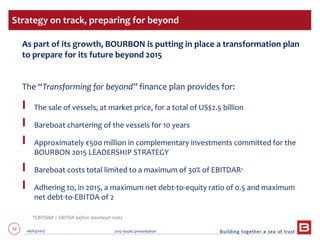

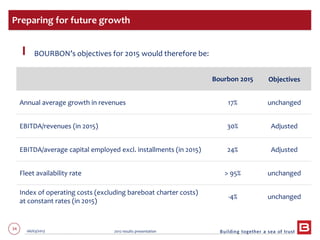
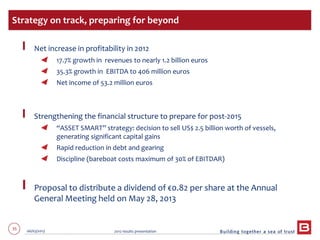
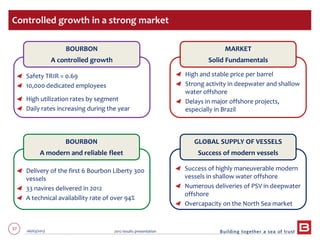

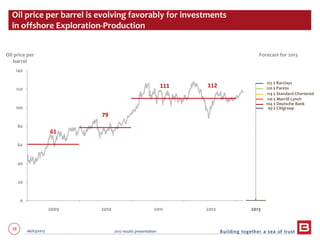
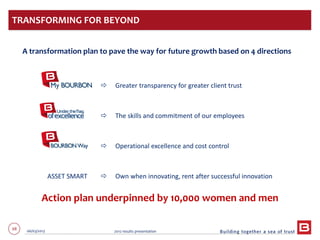
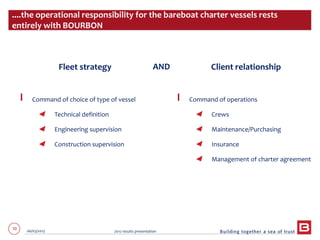
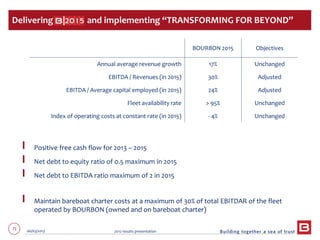


This document discusses Bourbon's annual results for 2012 and its "Transforming for Beyond" strategic plan. Key points include: - Profitable growth in 2012 with revenue up 17.7% and net income up 49.6% due to higher oil prices and daily rates. - The "Transforming for Beyond" plan includes selling $2.5 billion of vessels and bareboat chartering them to reduce debt and prepare for growth beyond 2015 while maintaining operational control of the fleet. - The financial aspects of the plan were approved in March 2013 and are aimed at strengthening the balance sheet and achieving specific debt and growth targets by 2015 to pave the way for future expansion.


