Download as PDF, PPTX

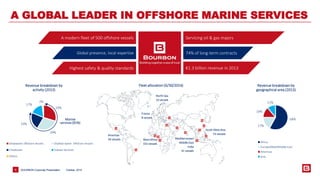
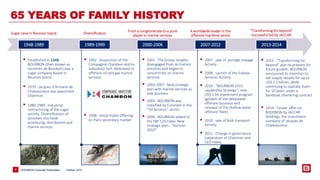
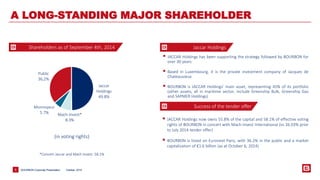


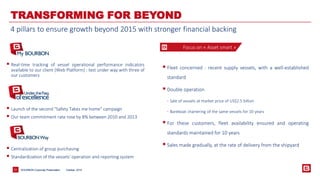
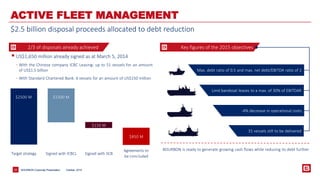


Bourbon Corporation is a world leader in offshore marine services. It provides vessels and offshore marine services to oil and gas companies. The presentation discusses Bourbon's history, fleet, activities, clients, and strategy to transform the business. Bourbon has a modern fleet of 500 offshore vessels and aims to grow beyond 2015 through an "asset smart" strategy that includes selling vessels while continuing to operate them through long-term charters. This will reduce debt while maintaining operations.


