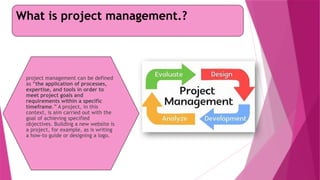
What is projectmanagement.?
project management can be defined
as “the application of processes,
expertise, and tools in order to
meet project goals and
requirements within a specific
timeframe.” A project, in this
context, is aim carried out with the
goal of achieving specified
objectives. Building a new website is
a project, for example, as is writing
a how-to guide or designing a logo.
3.
What is PERTand CPM..?
project Evaluation and Review Technique (PERT) and
Critical Path Method (CPM) are both useful tools when
planning and controlling a project. PERT and CPM are
complementary and both are important analytical
techniques in project management when managing
tasks.
Let us discuss both CPM and PERT one by one:
4.
1.CPM(Critical Path Method):CPMis a step by step
method used to identify the longest path of planned
activities to the end of a project .This helps determine
the shortest possible project duration.
PURPOSE: to find the which tasks are "critical"(must be
done on time)and which have "float"(can be delayed
without affecting the project deadline).
EXAMPLE: imagine you are planning to build a house .The
critical tasks would be laying the foundation building the
walls, and installing the roof if any of these tasks are
delayed ,the whole project will be delayed.
5.
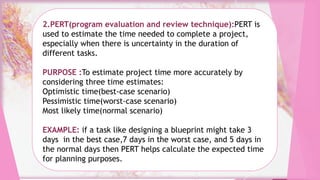
2.PERT(program evaluation andreview technique):PERT is
used to estimate the time needed to complete a project,
especially when there is uncertainty in the duration of
different tasks.
PURPOSE :To estimate project time more accurately by
considering three time estimates:
Optimistic time(best-case scenario)
Pessimistic time(worst-case scenario)
Most likely time(normal scenario)
EXAMPLE: if a task like designing a blueprint might take 3
days in the best case,7 days in the worst case, and 5 days in
the normal days then PERT helps calculate the expected time
for planning purposes.
6.
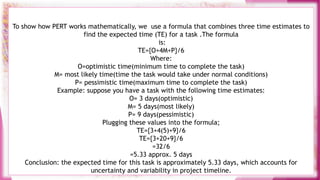
To show howPERT works mathematically, we use a formula that combines three time estimates to
find the expected time (TE) for a task .The formula
is:
TE={O+4M+P}/6
Where:
O=optimistic time(minimum time to complete the task)
M= most likely time(time the task would take under normal conditions)
P= pessimistic time(maximum time to complete the task)
Example: suppose you have a task with the following time estimates:
O= 3 days(optimistic)
M= 5 days(most likely)
P= 9 days(pessimistic)
Plugging these values into the formula;
TE={3+4(5)+9}/6
TE={3+20+9}/6
=32/6
=5.33 approx. 5 days
Conclusion: the expected time for this task is approximately 5.33 days, which accounts for
uncertainty and variability in project timeline.
7.
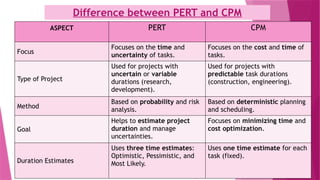
Difference between PERTand CPM
ASPECT PERT CPM
Focus
Focuses on the time and
uncertainty of tasks.
Focuses on the cost and time of
tasks.
Type of Project
Used for projects with
uncertain or variable
durations (research,
development).
Used for projects with
predictable task durations
(construction, engineering).
Method
Based on probability and risk
analysis.
Based on deterministic planning
and scheduling.
Goal
Helps to estimate project
duration and manage
uncertainties.
Focuses on minimizing time and
cost optimization.
Duration Estimates
Uses three time estimates:
Optimistic, Pessimistic, and
Most Likely.
Uses one time estimate for each
task (fixed).
8.
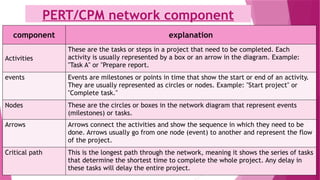
PERT/CPM network component
componentexplanation
Activities
These are the tasks or steps in a project that need to be completed. Each
activity is usually represented by a box or an arrow in the diagram. Example:
"Task A" or "Prepare report.
events Events are milestones or points in time that show the start or end of an activity.
They are usually represented as circles or nodes. Example: "Start project" or
"Complete task."
Nodes These are the circles or boxes in the network diagram that represent events
(milestones) or tasks.
Arrows Arrows connect the activities and show the sequence in which they need to be
done. Arrows usually go from one node (event) to another and represent the flow
of the project.
Critical path This is the longest path through the network, meaning it shows the series of tasks
that determine the shortest time to complete the whole project. Any delay in
these tasks will delay the entire project.
9.
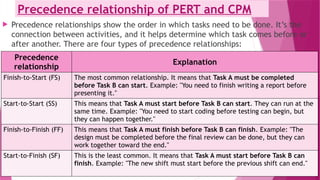
Precedence relationship ofPERT and CPM
Precedence relationships show the order in which tasks need to be done. It’s the
connection between activities, and it helps determine which task comes before or
after another. There are four types of precedence relationships:
Precedence
relationship
Explanation
Finish-to-Start (FS) The most common relationship. It means that Task A must be completed
before Task B can start. Example: "You need to finish writing a report before
presenting it."
Start-to-Start (SS) This means that Task A must start before Task B can start. They can run at the
same time. Example: "You need to start coding before testing can begin, but
they can happen together."
Finish-to-Finish (FF) This means that Task A must finish before Task B can finish. Example: "The
design must be completed before the final review can be done, but they can
work together toward the end."
Start-to-Finish (SF) This is the least common. It means that Task A must start before Task B can
finish. Example: "The new shift must start before the previous shift can end."
10.
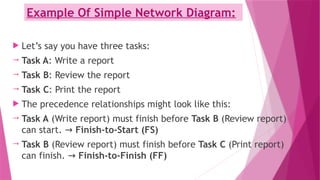
Example Of SimpleNetwork Diagram:
Let’s say you have three tasks:
Task A: Write a report
Task B: Review the report
Task C: Print the report
The precedence relationships might look like this:
Task A (Write report) must finish before Task B (Review report)
can start. → Finish-to-Start (FS)
Task B (Review report) must finish before Task C (Print report)
can finish. → Finish-to-Finish (FF)
11.
Visual representation
[Start]
|
(Task A)---> (Task B) ---> (Task C)
|
[End]
This simple diagram shows that Task A needs to be
done before Task B, and Task B must be finished
before Task C can be completed.
12.
PROJECT SCHEDULING
Projectscheduling: project management is like creating a
roadmap that shows when each part of a project needs to be
done. It helps ensure everything happens in the right order, and
the project finishes on time.
EXAMPLE:
To build a house:
[Foundation (3 days)] --> [Walls (7 days)] --> [Roofing (3 days)]
--> [Plumbing (5 days)] --> [Electrical (4 days)]
13.
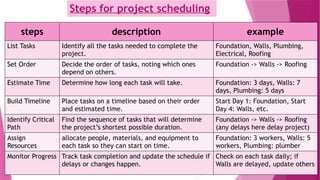
Steps for projectscheduling
steps description example
List Tasks Identify all the tasks needed to complete the
project.
Foundation, Walls, Plumbing,
Electrical, Roofing
Set Order Decide the order of tasks, noting which ones
depend on others.
Foundation -> Walls -> Roofing
Estimate Time Determine how long each task will take. Foundation: 3 days, Walls: 7
days, Plumbing: 5 days
Build Timeline Place tasks on a timeline based on their order
and estimated time.
Start Day 1: Foundation, Start
Day 4: Walls, etc.
Identify Critical
Path
Find the sequence of tasks that will determine
the project’s shortest possible duration.
Foundation -> Walls -> Roofing
(any delays here delay project)
Assign
Resources
allocate people, materials, and equipment to
each task so they can start on time.
Foundation: 3 workers, Walls: 5
workers, Plumbing: plumber
Monitor Progress Track task completion and update the schedule if
delays or changes happen.
Check on each task daily; if
Walls are delayed, update others
14.
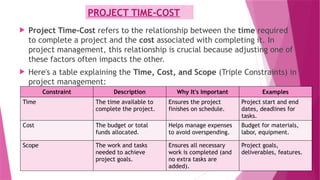
PROJECT TIME-COST
ProjectTime-Cost refers to the relationship between the time required
to complete a project and the cost associated with completing it. In
project management, this relationship is crucial because adjusting one of
these factors often impacts the other.
Here's a table explaining the Time, Cost, and Scope (Triple Constraints) in
project management:
Constraint Description Why It's Important Examples
Time The time available to
complete the project.
Ensures the project
finishes on schedule.
Project start and end
dates, deadlines for
tasks.
Cost The budget or total
funds allocated.
Helps manage expenses
to avoid overspending.
Budget for materials,
labor, equipment.
Scope The work and tasks
needed to achieve
project goals.
Ensures all necessary
work is completed (and
no extra tasks are
added).
Project goals,
deliverables, features.
15.
TRADE-OFF IN PROJECTMANAGEMENT
In project management, a trade-off refers to the decision to give up one project aspect to gain
something else. This is necessary because of the Triple Constraint (also known as the Iron
Triangle), which involves three primary factors:
Time (Schedule)
Cost (Budget)
Scope (Project Goals/Requirements)
These three factors are interdependent. Changing one usually affects the others, requiring
trade-offs to maintain project balance. Here’s how trade-offs generally work:
Time-Cost Trade-Off: If a project needs to be completed more quickly, costs often rise
because more resources (like labor or materials) are required. Conversely, to reduce costs, you
might extend the timeline.
Time-Scope Trade-Off: Increasing the scope (adding features or requirements) often means
more time is needed to complete the project. Reducing the scope can help finish the project
sooner.
Cost-Scope Trade-Off: Increasing the project’s scope typically raises costs due to the extra
work and resources required. To cut costs, you might reduce the scope.
16.
Example:
If acompany is building a new app and wants to launch it faster:
Option A: Hire extra developers to speed up completion (higher cost for less time).
Option B: Delay the launch and stick with the current team to keep costs down (less cost for more
time).
In essence, trade-offs are about prioritizing certain aspects of a project based on goals and
constraints. Successful project management often involves finding the right balance among these
competing needs.
17.
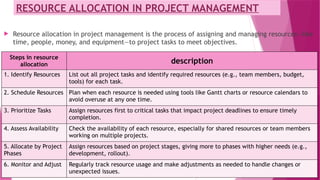
RESOURCE ALLOCATION INPROJECT MANAGEMENT
Resource allocation in project management is the process of assigning and managing resources—like
time, people, money, and equipment—to project tasks to meet objectives.
Steps in resource
allocation description
1. Identify Resources List out all project tasks and identify required resources (e.g., team members, budget,
tools) for each task.
2. Schedule Resources Plan when each resource is needed using tools like Gantt charts or resource calendars to
avoid overuse at any one time.
3. Prioritize Tasks Assign resources first to critical tasks that impact project deadlines to ensure timely
completion.
4. Assess Availability Check the availability of each resource, especially for shared resources or team members
working on multiple projects.
5. Allocate by Project
Phases
Assign resources based on project stages, giving more to phases with higher needs (e.g.,
development, rollout).
6. Monitor and Adjust Regularly track resource usage and make adjustments as needed to handle changes or
unexpected issues.

![Visual representation
[Start]
|
(Task A) ---> (Task B) ---> (Task C)
|
[End]
This simple diagram shows that Task A needs to be
done before Task B, and Task B must be finished
before Task C can be completed.](https://image.slidesharecdn.com/presentation-250618015936-ccf38c2d/85/Presentation-pptx-optimization-techniques-11-320.jpg)
![PROJECT SCHEDULING
Project scheduling: project management is like creating a
roadmap that shows when each part of a project needs to be
done. It helps ensure everything happens in the right order, and
the project finishes on time.
EXAMPLE:
To build a house:
[Foundation (3 days)] --> [Walls (7 days)] --> [Roofing (3 days)]
--> [Plumbing (5 days)] --> [Electrical (4 days)]](https://image.slidesharecdn.com/presentation-250618015936-ccf38c2d/85/Presentation-pptx-optimization-techniques-12-320.jpg)