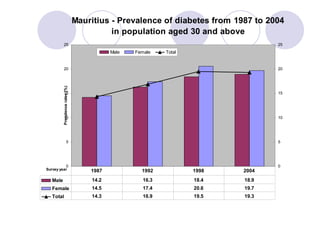
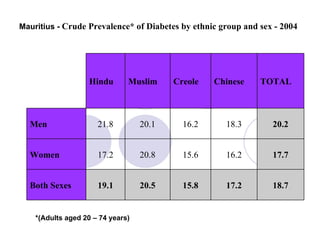
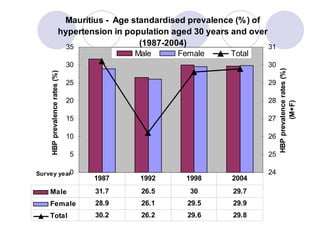
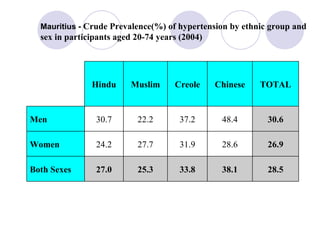
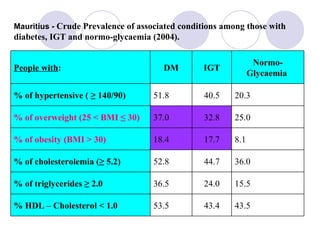
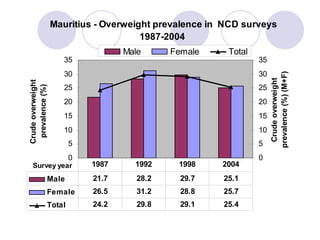
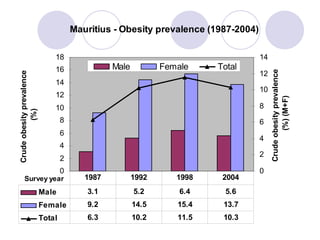
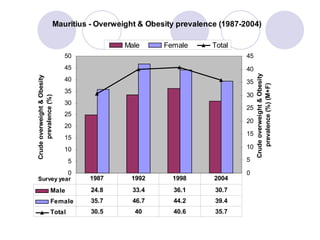
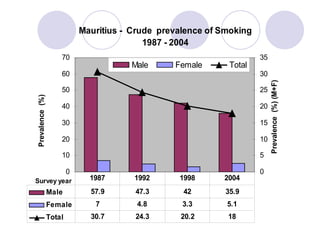
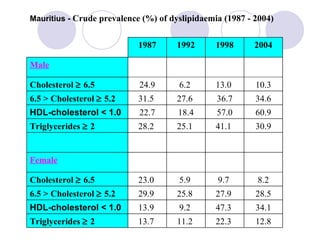
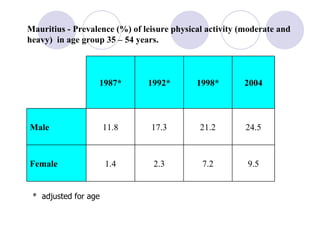
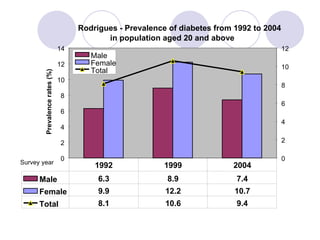
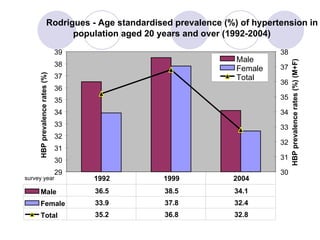
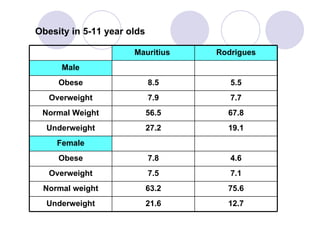
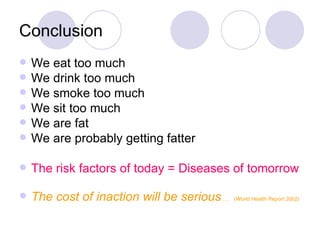
Chronic Diseases Risk Factors in Mauritius ---  Obesity By Dr C. Sookram Regional Public Health Superintendent & Principal Investigator Mauritius NCD Survey 2004 Ministry of Health and Quality of Life
HEALTH STATISTICS  Mauritius 2004 Cause of Death  % Cardiovascular diseases 51 Respiratory conditions   9 Cancers   8 Diabetes   7 (Est. death related to smoking ~10% i.e 800/year) Life Expectancy Male ~69 yrs Female ~ 75 yrs IMR ~13 – 14 per 1000
Epidemiological transition 30-40 years ago – main causes of morbidity and mortality mainly due to communicable diseases, infestations and poor nutrition 70’s – early 80’s – routine statistics showed increasing prevalence's of NCD’s 1982-1986 – short term consultant from WHO, Prof. Paul Zimmet formulated plan of action for prevention and control Recommendations Need for epidemiological survey Follow up surveys as prelude to development of prevention and control strategies
NCD Surveys First NCD Survey 1987 Main Findings High rates of NCD’s (DM, HBP, IHD) High rates of risk factors (IGT, Obesity, Smoking, Alcohol abuse, Hyperlipidaemias and physical inactivity) Case ascertainment rates for DM & HBP <50% High rates of poor control in those with DM & HBP Indications of high rates of complications
Follow up Surveys 1992,1998 and 2004 Similar findings with some improvement in some risk factor prevalence and deterioration in prevalence of certain risk factors Burden of disease from NCD’s continue to stay high and probably increasing Rates of complications on the increase (e.g Renal, eye, IHD, amputations)
Overview of findings of NCD Surveys 1987-2004 Trends in the prevalence of DM & HBP Trends in prevalence of risk factors IGT Overweight and obesity Smoking Alcohol abuse Hyperlipidaemia Physical inactivity
 
Mauritius -   Crude Prevalence* of Diabetes by ethnic group and sex - 2004 *(Adults aged 20 – 74 years) 18.7 17.2 15.8 20.5 19.1 Both Sexes 17.7 16.2 15.6 20.8 17.2 Women 20.2 18.3 16.2 20.1 21.8 Men TOTAL Chinese Creole Muslim Hindu
 
Mauritius -   Crude Prevalence(%) of hypertension by ethnic group and sex in participants aged 20-74 years (2004) 28.5 38.1 33.8 25.3 27.0 Both Sexes 26.9 28.6 31.9 27.7 24.2 Women 30.6 48.4 37.2 22.2 30.7 Men TOTAL Chinese Creole Muslim Hindu
Mauritius -   Crude Prevalence of associated conditions among those with diabetes, IGT and normo-glycaemia (2004). 43.5 43.4 53.5 % HDL – Cholesterol < 1.0 15.5 24.0 36.5 % of triglycerides ≥ 2.0 36.0 44.7 52.8 % of cholesterolemia (≥ 5.2) 8.1 17.7 18.4 % of obesity (BMI > 30) 25.0 32.8 37.0 % of overweight (25 < BMI ≤ 30) 20.3 40.5 51.8 % of hypertensive ( ≥ 140/90) Normo- Glycaemia  IGT DM People with :


Mauritius -   Crude prevalence (%) of dyslipidaemia (1987 - 2004) 12.8 22.3  11.2  13.7  Triglycerides    2 34.1 47.3  9.2  13.9  HDL-cholesterol < 1.0  28.5 27.9  25.8  29.9  6.5 > Cholesterol    5.2  8.2 9.7  5.9  23.0  Cholesterol    6.5  Female 30.9 41.1  25.1  28.2  Triglycerides    2 60.9 57.0 18.4 22.7 HDL-cholesterol < 1.0 34.6 36.7 27.6  31.5  6.5 > Cholesterol    5.2  10.3 13.0  6.2  24.9 Cholesterol    6.5  Male 2004 1998 1992 1987
Mauritius - Prevalence (%) of leisure physical activity (moderate and heavy)  in age group 35 – 54 years. *  adjusted for age 9.5 7.2 2.3 1.4 Female  24.5 21.2 17.3 11.8 Male  2004 1998* 1992* 1987*
Overview of findings of NCD Surveys in Rodrigues 1992-2004 Trends in the prevalence of DM & HBP Trends in prevalence of risk factors IGT Overweight and obesity Smoking Alcohol abuse Hyperlipidaemia Physical inactivity
Rodrigues - Prevalence of diabetes from 1992 to 2004  in population aged 20 and above 0 2 4 6 8 10 12 14 Survey year Prevalence rates (%) 0 2 4 6 8 10 12 Male Female Total Male 6.3 8.9 7.4 Female 9.9 12.2 10.7 Total 8.1 10.6 9.4 1992 1999 2004
Rodrigues - Age standardised prevalence (%) of hypertension in  population aged 20 years and over (1992-2004) 29 30 31 32 33 34 35 36 37 38 39 survey year HBP prevalence rates (%) 30 31 32 33 34 35 36 37 38 HBP prevalence rates (%) (M+F) Male Female Total Male 36.5 38.5 34.1 Female 33.9 37.8 32.4 Total 35.2 36.8 32.8 1992 1999 2004
Rodrigues -  Prevalence of Overweight (1992 - 2004) 29.5 30 30.5 31 31.5 32 32.5 33 33.5 34 34.5 Survey year Crude overweight prevalence (%) 30 30.5 31 31.5 32 32.5 33 33.5 34 Crude overweight prevalence (%)  (M+F) Male Female Total Male 34.1 31.2 32.5 Female 33.5 31.7 32.4 Total 33.8 31.4 32.5 1992 1999 2004
Rodrigues - Prevalence of Obesity (1992 - 2004) 0 5 10 15 20 25 30 35 Survey year Crude obesity prevalence (%) 17 18 19 20 21 22 23 24 Crude obesity prevalence (%) (M+F) Male Female Total Male 9.5 11.2 13.5 Female 29.3 28.2 28.6 Total 19.3 19.6 22.9 1992 1999 2004
 
Rodrigues - Prevalence of abusive alcohol consumption  1992 - 2004 0 5 10 15 20 25 30 35 40 45 Survey year  Prevalence (%) Male Female Male 19.1 9.8 40.9 Female 0.3 0 5.4 1992 1999 2004
Rodrigues - Crude prevalence (%) of dyslipidaemia from 1992 to 2004. 2.8 7.2 4.5 Triglycerides    2 16.8 26.3 2.4 HDL-cholesterol < 1.0  25.8 31.1 21.4 Cholesterol    5.2  Female 7.7 14.0 10.5 Triglycerides    2 26.3 32.8 4.2 HDL-cholesterol < 1.0 27.9 30.6 16.8 Cholesterol    5.2  Male 2004 1999 1992
Rodrigues - Prevalence (%) of moderate or heavy leisure physical activity  in age group 35 – 54 years. *  adjusted for age 5.3 2.3 1.9 Female  22.0 19.7 20.2 Male  2004 1999* 1992*
Obesity in 5-11 year olds 12.7 21.6 Underweight 75.6 63.2 Normal weight 7.1 7.5 Overweight 4.6 7.8 Obese Female 19.1 27.2 Underweight 67.8 56.5 Normal Weight 7.7 7.9 Overweight 5.5 8.5 Obese Male Rodrigues Mauritius
Obesity in 12-19 year olds 7.1 15.7 Underweight 77.3 69.4 Normal weight 8.1 8.4 Overweight 7.6 6.5 Obese Female 17.3 20.1 Underweight 73.2 63.3 Normal Weight 5.0 8.4 Overweight 4.5 8.2 Obese Male Rodrigues Mauritius
The WHO recently stated &quot;the growth in the number of severely overweight adults is expected to be double that of underweight during 1995-2025&quot; (WHO 1998). Crude projections, from extrapolating existing data, suggest that by the year 2025 levels of obesity could be as high as 45-50% in the USA, between 30-40% in Australia, England and  Mauritius  and over 20% in Brazil
EPIDEMIOLOGY: PREVALENCE OF OBESITY IN MAURITIUS
Conclusion We eat too much We drink too much We smoke too much We sit too much We are fat We are probably getting fatter The risk factors of today = Diseases of tomorrow The cost of inaction will be serious  ….  (World Health Report 2002)
Thank You

presentation de Chandralall Sookram

  • 1.
    Chronic Diseases RiskFactors in Mauritius --- Obesity By Dr C. Sookram Regional Public Health Superintendent & Principal Investigator Mauritius NCD Survey 2004 Ministry of Health and Quality of Life
  • 2.
    HEALTH STATISTICS Mauritius 2004 Cause of Death % Cardiovascular diseases 51 Respiratory conditions 9 Cancers 8 Diabetes 7 (Est. death related to smoking ~10% i.e 800/year) Life Expectancy Male ~69 yrs Female ~ 75 yrs IMR ~13 – 14 per 1000
  • 3.
    Epidemiological transition 30-40years ago – main causes of morbidity and mortality mainly due to communicable diseases, infestations and poor nutrition 70’s – early 80’s – routine statistics showed increasing prevalence's of NCD’s 1982-1986 – short term consultant from WHO, Prof. Paul Zimmet formulated plan of action for prevention and control Recommendations Need for epidemiological survey Follow up surveys as prelude to development of prevention and control strategies
  • 4.
    NCD Surveys FirstNCD Survey 1987 Main Findings High rates of NCD’s (DM, HBP, IHD) High rates of risk factors (IGT, Obesity, Smoking, Alcohol abuse, Hyperlipidaemias and physical inactivity) Case ascertainment rates for DM & HBP <50% High rates of poor control in those with DM & HBP Indications of high rates of complications
  • 5.
    Follow up Surveys1992,1998 and 2004 Similar findings with some improvement in some risk factor prevalence and deterioration in prevalence of certain risk factors Burden of disease from NCD’s continue to stay high and probably increasing Rates of complications on the increase (e.g Renal, eye, IHD, amputations)
  • 6.
    Overview of findingsof NCD Surveys 1987-2004 Trends in the prevalence of DM & HBP Trends in prevalence of risk factors IGT Overweight and obesity Smoking Alcohol abuse Hyperlipidaemia Physical inactivity
  • 7.
  • 8.
    Mauritius - Crude Prevalence* of Diabetes by ethnic group and sex - 2004 *(Adults aged 20 – 74 years) 18.7 17.2 15.8 20.5 19.1 Both Sexes 17.7 16.2 15.6 20.8 17.2 Women 20.2 18.3 16.2 20.1 21.8 Men TOTAL Chinese Creole Muslim Hindu
  • 9.
  • 10.
    Mauritius - Crude Prevalence(%) of hypertension by ethnic group and sex in participants aged 20-74 years (2004) 28.5 38.1 33.8 25.3 27.0 Both Sexes 26.9 28.6 31.9 27.7 24.2 Women 30.6 48.4 37.2 22.2 30.7 Men TOTAL Chinese Creole Muslim Hindu
  • 11.
    Mauritius - Crude Prevalence of associated conditions among those with diabetes, IGT and normo-glycaemia (2004). 43.5 43.4 53.5 % HDL – Cholesterol < 1.0 15.5 24.0 36.5 % of triglycerides ≥ 2.0 36.0 44.7 52.8 % of cholesterolemia (≥ 5.2) 8.1 17.7 18.4 % of obesity (BMI > 30) 25.0 32.8 37.0 % of overweight (25 < BMI ≤ 30) 20.3 40.5 51.8 % of hypertensive ( ≥ 140/90) Normo- Glycaemia IGT DM People with :
  • 12.
  • 13.
  • 14.
  • 15.
  • 16.
    Mauritius - Crude prevalence (%) of dyslipidaemia (1987 - 2004) 12.8 22.3 11.2 13.7 Triglycerides  2 34.1 47.3 9.2 13.9 HDL-cholesterol < 1.0 28.5 27.9 25.8 29.9 6.5 > Cholesterol  5.2 8.2 9.7 5.9 23.0 Cholesterol  6.5 Female 30.9 41.1 25.1 28.2 Triglycerides  2 60.9 57.0 18.4 22.7 HDL-cholesterol < 1.0 34.6 36.7 27.6 31.5 6.5 > Cholesterol  5.2 10.3 13.0 6.2 24.9 Cholesterol  6.5 Male 2004 1998 1992 1987
  • 17.
    Mauritius - Prevalence(%) of leisure physical activity (moderate and heavy) in age group 35 – 54 years. * adjusted for age 9.5 7.2 2.3 1.4 Female 24.5 21.2 17.3 11.8 Male 2004 1998* 1992* 1987*
  • 18.
    Overview of findingsof NCD Surveys in Rodrigues 1992-2004 Trends in the prevalence of DM & HBP Trends in prevalence of risk factors IGT Overweight and obesity Smoking Alcohol abuse Hyperlipidaemia Physical inactivity
  • 19.
    Rodrigues - Prevalenceof diabetes from 1992 to 2004 in population aged 20 and above 0 2 4 6 8 10 12 14 Survey year Prevalence rates (%) 0 2 4 6 8 10 12 Male Female Total Male 6.3 8.9 7.4 Female 9.9 12.2 10.7 Total 8.1 10.6 9.4 1992 1999 2004
  • 20.
    Rodrigues - Agestandardised prevalence (%) of hypertension in population aged 20 years and over (1992-2004) 29 30 31 32 33 34 35 36 37 38 39 survey year HBP prevalence rates (%) 30 31 32 33 34 35 36 37 38 HBP prevalence rates (%) (M+F) Male Female Total Male 36.5 38.5 34.1 Female 33.9 37.8 32.4 Total 35.2 36.8 32.8 1992 1999 2004
  • 21.
    Rodrigues - Prevalence of Overweight (1992 - 2004) 29.5 30 30.5 31 31.5 32 32.5 33 33.5 34 34.5 Survey year Crude overweight prevalence (%) 30 30.5 31 31.5 32 32.5 33 33.5 34 Crude overweight prevalence (%) (M+F) Male Female Total Male 34.1 31.2 32.5 Female 33.5 31.7 32.4 Total 33.8 31.4 32.5 1992 1999 2004
  • 22.
    Rodrigues - Prevalenceof Obesity (1992 - 2004) 0 5 10 15 20 25 30 35 Survey year Crude obesity prevalence (%) 17 18 19 20 21 22 23 24 Crude obesity prevalence (%) (M+F) Male Female Total Male 9.5 11.2 13.5 Female 29.3 28.2 28.6 Total 19.3 19.6 22.9 1992 1999 2004
  • 23.
  • 24.
    Rodrigues - Prevalenceof abusive alcohol consumption 1992 - 2004 0 5 10 15 20 25 30 35 40 45 Survey year Prevalence (%) Male Female Male 19.1 9.8 40.9 Female 0.3 0 5.4 1992 1999 2004
  • 25.
    Rodrigues - Crudeprevalence (%) of dyslipidaemia from 1992 to 2004. 2.8 7.2 4.5 Triglycerides  2 16.8 26.3 2.4 HDL-cholesterol < 1.0 25.8 31.1 21.4 Cholesterol  5.2 Female 7.7 14.0 10.5 Triglycerides  2 26.3 32.8 4.2 HDL-cholesterol < 1.0 27.9 30.6 16.8 Cholesterol  5.2 Male 2004 1999 1992
  • 26.
    Rodrigues - Prevalence(%) of moderate or heavy leisure physical activity in age group 35 – 54 years. * adjusted for age 5.3 2.3 1.9 Female 22.0 19.7 20.2 Male 2004 1999* 1992*
  • 27.
    Obesity in 5-11year olds 12.7 21.6 Underweight 75.6 63.2 Normal weight 7.1 7.5 Overweight 4.6 7.8 Obese Female 19.1 27.2 Underweight 67.8 56.5 Normal Weight 7.7 7.9 Overweight 5.5 8.5 Obese Male Rodrigues Mauritius
  • 28.
    Obesity in 12-19year olds 7.1 15.7 Underweight 77.3 69.4 Normal weight 8.1 8.4 Overweight 7.6 6.5 Obese Female 17.3 20.1 Underweight 73.2 63.3 Normal Weight 5.0 8.4 Overweight 4.5 8.2 Obese Male Rodrigues Mauritius
  • 29.
    The WHO recentlystated &quot;the growth in the number of severely overweight adults is expected to be double that of underweight during 1995-2025&quot; (WHO 1998). Crude projections, from extrapolating existing data, suggest that by the year 2025 levels of obesity could be as high as 45-50% in the USA, between 30-40% in Australia, England and Mauritius and over 20% in Brazil
  • 30.
    EPIDEMIOLOGY: PREVALENCE OFOBESITY IN MAURITIUS
  • 31.
    Conclusion We eattoo much We drink too much We smoke too much We sit too much We are fat We are probably getting fatter The risk factors of today = Diseases of tomorrow The cost of inaction will be serious …. (World Health Report 2002)
  • 32.