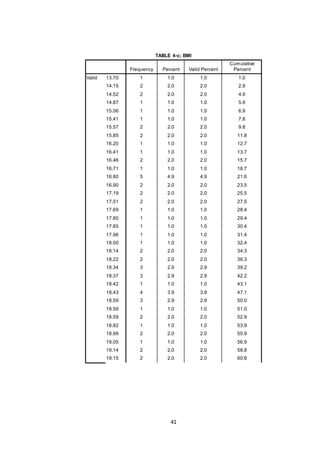
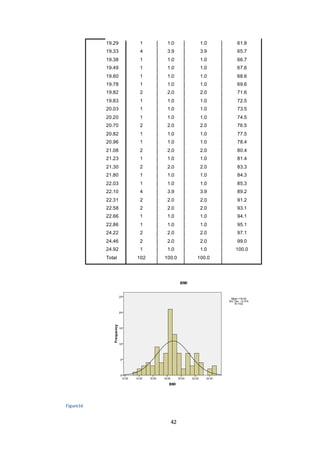
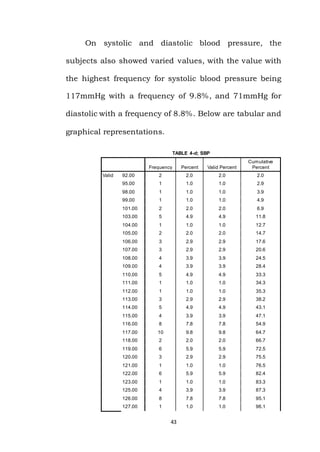
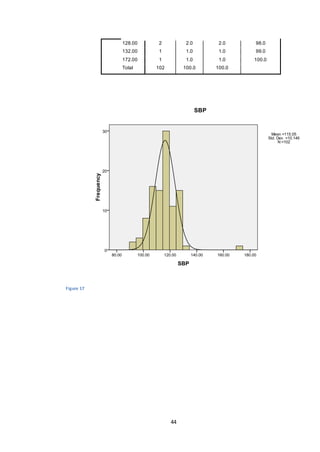
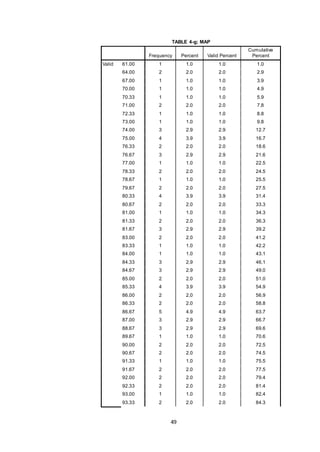
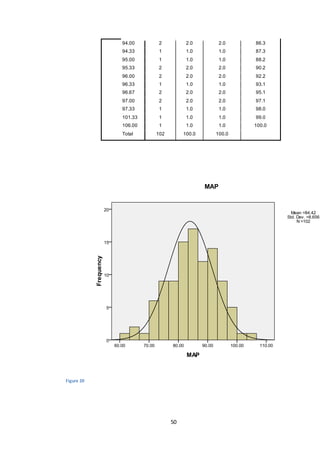
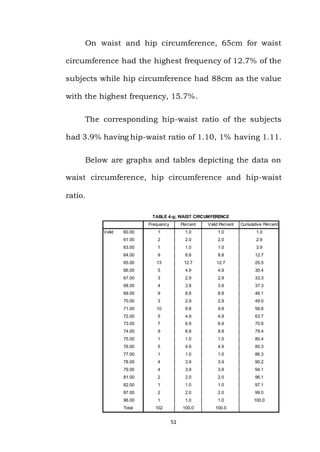
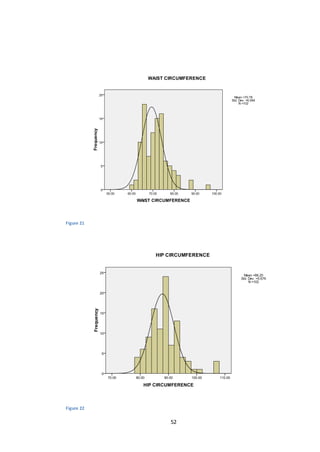
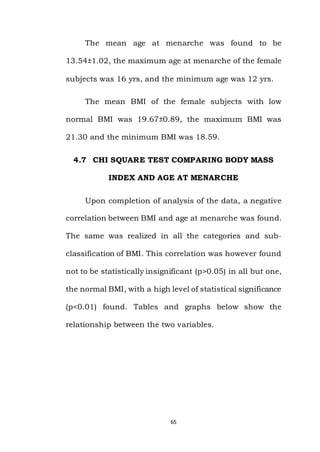
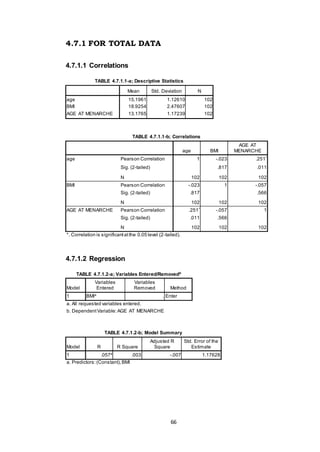
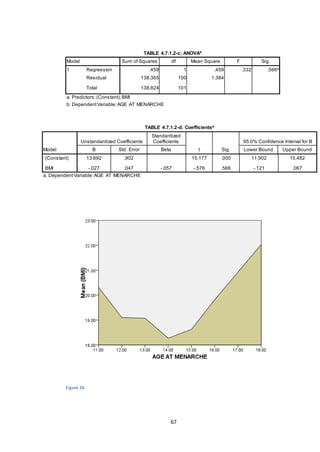
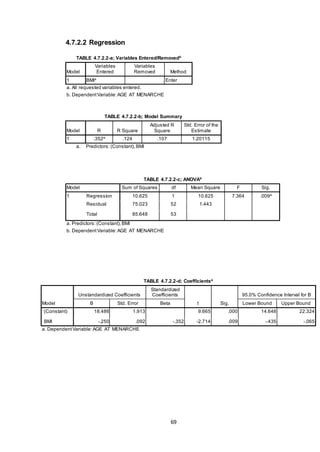
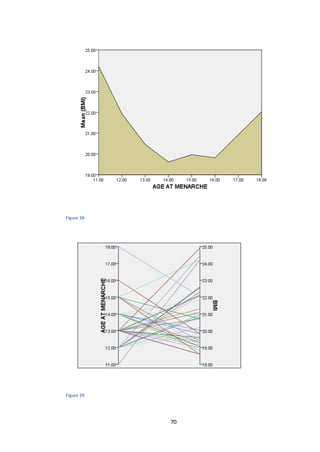
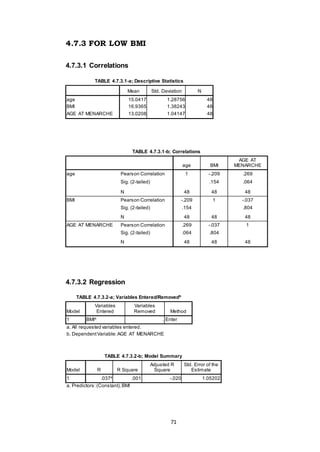
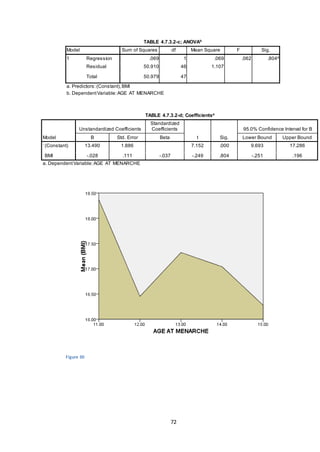
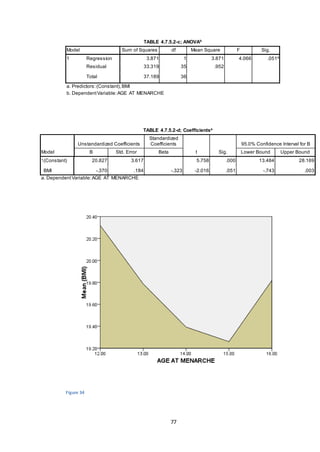
This document discusses a study exploring the relationship between body mass index (BMI) and age at menarche. It begins with an introduction to BMI and its use as a standard measurement of overweight and obesity. It then reviews literature showing relationships between higher BMI, earlier menarche, and higher levels of body fat associated with earlier menarche. The study aims to determine if age at menarche is dependent on BMI. It involves measuring height, weight, waist circumference, hip circumference, and blood pressure of 102 female adolescents to calculate their BMI and examine its relationship to their reported age at menarche.
This document summarizes a thesis that studied the effects of an after-school program called Get Out, Get Active! on body mass index (BMI), body composition, and physical activity levels in kindergarten through fifth grade students. The study measured BMI, skin fold thickness, and pedometer steps in 73 students before and after participating in the program, which involved 1 hour per week of outdoor games for 12 weeks. The results showed no significant changes in BMI or body composition between pre-and post-testing. However, there were significant increases in daily pedometer steps for kindergarten through first grade students and fourth through fifth grade students. The study suggests that while physical activity was provided, a more rigorous protocol may be needed to
This study aimed to identify risk factors for excessive adiposity and overweight in children from a region in Mexico with high obesity prevalence. The study examined 551 children aged 6-12 years. Independent risk factors for overweight/obesity were found to be having a first-degree relative with obesity, a sedentary lifestyle, and being the third child or younger. Having a first-degree relative with obesity underscores the impact of genes and family lifestyle on excessive adiposity. Being later in birth order may indicate different nurturing practices for younger offspring.
This document discusses a study on the relationship between obesity and calories consumed from fast food. The study found a positive correlation between the two, with those eating fast food more often consuming more calories. It reviewed literature showing obesity is rising in the US, affecting some demographic groups more than others. Socioeconomic status and access to healthy foods also impact obesity levels.
Prevalence of overweight,obesity and abdominal obesity among adolescentTareq Hassan
This document outlines a study that aimed to determine the prevalence of overweight and obesity in adolescents aged 13-19 in Maijdee city, Noakhali. The study used a cross-sectional design with a sample of 320 adolescents, collecting data on gender, age, weight, height and BMI. Results found the prevalence of overweight was higher in boys (9.44%) than girls (3.57%), while the prevalence of obesity was higher in girls (1.43%) than boys (0.56%). Overall, the study concluded there was a moderate prevalence of overweight and obesity among adolescents in the given location, with prevalence higher in boys than girls.
This document discusses obesity, including its definition, prevalence, causes, health risks, and physiological basis. Key points include:
- Obesity is defined as excess body fat and affects over 1 billion people worldwide. The US has high obesity rates, especially among minority groups.
- Factors contributing to obesity include genetics, metabolism, behavior, environment and lifestyle. Conditions like polycystic ovarian syndrome can also cause weight gain.
- Obesity increases the risk of heart disease, diabetes, sleep apnea, cancer and other health problems. It is a leading cause of preventable death.
- Physiologically, obesity occurs when energy intake exceeds expenditure. Genetics and lifestyle factors like physical activity influence metabolism and risk
This article discusses the increasing prevalence of type 2 diabetes in adolescents and the role of sleep. It notes that while genetics play a role, lifestyle changes like decreased sleep have contributed to rising obesity and diabetes rates. Sleep is influenced by biological and social factors in adolescents. Short sleep duration is linked to increased insulin resistance and BMI. The article reviews studies showing that sleep education and advice programs can improve sleep habits and duration in teens, with some evidence they may also positively impact metabolic health and weight. Larger and longer trials are still needed.
Obesity And Female CANCER, Dr. Sharda Jain & Lifecare team Lifecare Centre
This document discusses the link between obesity and cancer in women. It notes that obesity rates have doubled globally since 1970 and are a leading cause of preventable cancer. Several studies are cited showing higher cancer incidence and mortality rates among obese populations. Obesity can increase cancer risk through higher estrogen levels, insulin resistance, chronic inflammation and oxidative stress. The document recommends maintaining a healthy lifestyle through diet, exercise, sleep and stress management to reduce obesity and cancer risk. It emphasizes the need for awareness among women in India about this health issue.
Childhood Obesity Presentation - Jack Olwellrnielsen01
This document presents data from the Behavioral Risk Factor Surveillance System (BRFSS) from 1985 to 2010 that shows increasing trends in obesity among U.S. adults over time. The maps show increasing percentages of state populations with a BMI of 30 or higher in each year. Later years begin to show more states in darker colors indicating higher obesity rates of over 25% and 30%. This demonstrates a clear trend towards increasing obesity in the U.S. adult population from the 1980s to 2010s.
The document summarizes obesity trends and statistics in the United States. It finds that approximately 66% of American adults are overweight or obese, with obesity rates doubling over the past 30 years. Obesity is associated with increased risk of diseases like hypertension, diabetes, and certain cancers. Minority groups and those of lower socioeconomic status tend to have higher obesity rates. Maintaining a healthy diet and active lifestyle can help address the national challenge of obesity.
Obesity Grand Rounds by Dr. Susan BelandNick Gowen
This document summarizes the history and current state of obesity. It begins with a case study and outlines treatment. It then reviews how obesity was once seen positively in art but now stigmatized. Obesity increased with agriculture and reduced hunger. The document defines obesity using BMI and lists its complications. It examines obesity demographics, costs, and failed diet strategies. Some diets showed modest short term weight loss but long term success is challenging due to biological and behavioral factors. Sugar intake is linked to increased obesity and chronic diseases.
Relationship of body mass index, fat and visceral fat among adolescentsSports Journal
In the present study the researcher studied out the correlation of Body mass index, Fat and visceral fat
among adolescents. Data was statically analyzed using descriptive statistics and Pearson Product Multi
Correlation Coefficient was used (PPMCC). It was find out that body mass index was significantly
correlated with fat and visceral fat and on the other hand fat was also significantly correlated with
visceral fat among adolescents.
Overweight and Medical Condition in US : 3 Factors that affect Childhood obe...Sumit Roy
This document summarizes statistics on overweight and obesity rates among children and adults in the United States. Some key points:
- About 1 in 3 children ages 2-19 are overweight or obese, with rates highest among low-income households and some minority groups.
- Over 150 million adults are overweight or obese, with obesity rates highest among non-Hispanic black women and Mexican American men and women.
- Healthcare costs related to obesity could reach $861-957 billion annually by 2030, accounting for 16-18% of total US health expenditures.
A Study Of Age At Menarche And Body Composition In School Girls Of Metro citiesijcite
Two thousand and seventeen subjects of various schools from two important metro cities in Maharashtra namely Mumbai and Pune in the age group of 10-14 year were studied to examine association between age at menarche and body composition. Data was collected through General Questionnaire & their body composition was assessed using analyzer (Tanita model no. BC 420 PM A). Out of the total sample, 370 students with mean age 12.35 year ±1.009 had attained menarche (AM) in the recent period of their recruitment whereas 1,646 girls had not attained menarche meaning they were perimenarcheal (PM) at the recruitment with mean age 11.42 year ±1.065. A concerning fact established by our study was that 10% of girls
from our population had attained menarche when they were just 11 yrs and 52.18% girls had attained menarche before they were 12 years of age. Results showed that All the body composition parameter except total body water percentage (TBW %) were higher in AM group compared to PM group. It was observed that fat percentage and fat mass was negatively
correlated with age at menarche which was statistically significant at 0.01 levels. Fat free mass, muscle mass, TBW (kg) were weakly negatively correlated whereas TBW (%) was positively correlated with age at menarche which was statistically significant at 0.01 levels.
This document discusses predicting obesity rates in the US using discrete choice models. It first provides background on discrete choice models and why standard regression is not appropriate for binary dependent variables. It then analyzes Behavioral Risk Factor Surveillance System (BRFSS) survey data from 2006-2010 to predict obesity. Logistic regression and marginal effects are used to model the probability of being obese based on demographic and socioeconomic variables. The results show age has a non-linear effect, initially decreasing obesity probability but then increasing it at older ages.
This document summarizes the development and validation of a new field-based tool for measuring body proportionality among children. It was created by Jabeen Shah for a postgraduate research conference. The tool aims to provide a lightweight, portable, and inexpensive alternative to current laboratory measures of sitting height and leg length ratios, which are markers of obesity, diabetes, and cardiovascular disease risk. Initial results found the adapted measure to have high validity and reliability compared to standard measures, with a low coefficient of variation, suggesting it is suitable for use in field studies.
Obesity is a complex disease involving an excess of body fat that can impair health. It is associated with increased risks of several cancers, including esophageal adenocarcinoma. Central obesity and excess abdominal fat are thought to promote esophageal adenocarcinoma through several mechanisms, including increased gastroesophageal reflux, inflammation, and altered levels of hormones and cytokines secreted by adipose tissue. Lifestyle and dietary interventions, as well as certain phytochemicals, show promise for controlling obesity and potentially reducing cancer risk. However, low bioavailability of phytochemicals poses a challenge to their clinical efficacy.
Weight Management Pharmaceutical Services
Obesity and Overweight: Definition, causes, prevention
Obese and Overweight patient counseling guidelines
Exercise, Physical activities for obese and overweight people
Obesity in women by Dr. Sharda Jain presented on 17th August 14 at DMA Cente...Lifecare Centre
This document summarizes a presentation on obesity in women given by Dr. Sharda Jain and others. It discusses the increasing prevalence of obesity in women globally and in India. Unique aspects of medical history taking and physical examination in obese women are covered. The document reviews the medical issues associated with obesity like infertility, pregnancy complications, and increased risk of diseases. Lifestyle changes including diet and exercise as well as pharmacological and surgical options for obesity management are presented. Specific considerations for obesity and infertility treatment and pregnancy are also summarized.
Unhealthy weight development has dramatically increased in the United States over the past 20 years. Currently, over 64% of American adults are overweight or obese. Obesity is linked to increased risk of diseases like diabetes, hypertension, certain cancers, and arthritis. The rising rates of obesity and related health issues pose a tremendous burden on health costs and resource use. Immediate action is needed from health services to reduce the increase in risk of new cases of diseases like diabetes and heart disease associated with obesity.
This document discusses obesity, including its definition, types, causes, and prevention strategies. Obesity is defined as a BMI of 30 or higher and is caused by factors like unhealthy diet, physical inactivity, and genetics. The worldwide prevalence of obesity nearly tripled between 1975 and 2016. Prevention strategies include promoting nutritious foods, physical activity, limiting screen time, and getting sufficient sleep. Annual BMI screening and lifestyle counseling can help with primary and secondary prevention of obesity.
Genetics of Obesity: The thrifty gene hypothesisStephen Magness
Early humans faced regular cycles of feast and famine that promoted the evolution and selection of "thrifty genes" that increased the body's ability to efficiently store and utilize fuels like fat and glucose. While these genes provided an evolutionary advantage in the past by helping humans survive periods of starvation, they predispose modern humans to obesity and related diseases due to our current environment of abundant food and low physical activity levels. The "thrifty genotype" hypothesis has been expanded to include the concept of a "thrifty epigenome," where environmental factors like famine experienced by pregnant mothers can epigenetically influence gene expression and metabolic function in offspring in ways that increase disease risk in a modern context of plentiful food.
The "Metabo Law" in Japan requires annual waist measurements for those aged 40-74 to curb obesity and metabolic syndrome. If waistlines exceed limits, individuals must attend counseling. Employers and insurers must ensure at least 65% participation and a 25% reduction in obesity by 2015 or face penalties to fund elderly healthcare. While raising health awareness, critics note low compliance with exams and advice, rising childhood obesity, and risks of discrimination.
This document provides a literature review on the following topics: adolescent health status and obesity rates, with a focus on African American youth; physical activity levels and exercise intensity in adolescents; and the relationship between subjective and objective exertion in youth. Regarding health status and obesity, the review found that African American adolescents have higher obesity rates than other ethnic groups. Studies also showed that physical activity levels decline significantly during adolescence. The relationship between perceived exertion and heart rate was explored in several studies, with youth found to vary widely in their ability to accurately rate exertion levels.
The document discusses lay theories of obesity and how beliefs about the causes of obesity can influence people's actual body weight. It presents results from two studies. The first study with South Koreans found that those who believed poor diet causes obesity had a lower BMI than those who believed insufficient exercise causes obesity. The second study, with French participants and various controls, replicated this finding. Both studies support the hypothesis that beliefs about the causes of obesity correlate with individuals' body weight in ways aligned with those beliefs.
Este documento presenta información sobre varios temas de geometría como ángulos, planos, rectas, circunferencias, polígonos y figuras geométricas. Explica conceptos como ángulos adyacentes, circunscritos, triángulos isósceles, trapecios, arcos mayores y áreas. También incluye enlaces a imágenes para ilustrar los diferentes temas.
DC Best Places to Work Roadshow | Health Catalyst Glassdoor
Three key points are made in the document:
1. Business success today requires a strong and enduring organizational culture in addition to other factors like products, market position, and timing.
2. The changing workforce, including the rise of Millennials, requires new approaches to effectively engage prospective employees who value things like meaningful work and a coaching management style.
3. Health Catalyst's culture and engagement of its team members have been as important to the company's success as any other factor, as evidenced by high participation in wellness programs, self-motivated employees, and strong growth in contracts and customers since its founding.
Philip II ruled Spain from 1556 to 1598 and focused on centralizing royal power. He established Madrid as the capital and strengthened the bureaucracy. Politically, he was an authoritarian monarch who weakened the power of the Cortes. Religiously, he fought Protestantism and persecuted converts. He annexed Portugal in 1580, expanding Spain's overseas empire. His foreign policy was dominated by rivalry with France and England, as well as revolts in the Netherlands and attacks from the Ottoman Empire. Culturally, Philip patronized great works like the Escorial and supported renowned artists, while mystic literature flourished.
Este documento resume conceptos clave sobre migraciones a partir de un video y un libro de texto. Explica que las migraciones son el movimiento de personas entre regiones, ya sea de forma voluntaria o forzada, temporal o permanente. Describe las migraciones captadas en el video desde países africanos a Melilla, España, debido a la pobreza y conflictos. Finalmente, analiza los efectos de la llegada de migrantes y sus modos de incorporación en la nueva sociedad.
Apresentação de Laszlo Bock para o livro Work Rules! (Um novo jeito de trabalhar!), que conta alguns "segredos" do Google para se tornar uma das melhores empresas para se trabalhar.
Presentación sobre la creación de contenidos educativos, principalmente podcasts (archivos de audio) y vodcasts (videos). Se describen beneficios, limitaciones, herramientas útiles y más.
Cultural appropriation involves adopting elements of a minority culture by members of the dominant culture. It can negatively impact minority groups when sacred cultural items are exploited, disrespected, or misrepresented by those in positions of greater social power. Whether cultural appropriation is acceptable depends on what is being borrowed, whether it has religious or spiritual significance, the level of understanding and respect the borrower has for the culture, and if the element is accurately represented. Mainstream cultural appropriation of minority cultures is problematic because the mainstream holds more power to influence global perceptions, and minority groups are often victimized by the appropriation of their cultural identities and practices.
Este documento presenta una agenda para un taller sobre el diseño de cursos en línea. La agenda incluye introducir conceptos clave como la conceptualización, herramientas, objetivos de aprendizaje, actividades, contenidos y un plan de implementación. El documento también discute temas como teorías de aprendizaje, enfoques de diseño y el uso de recursos educativos abiertos.
Valves control fluid flow by varying the pressure applied to the valve stem. A valve's characteristic describes the relationship between stem position and flow rate. For a given fluid and temperatures, flow is a function of stem lift, upstream pressure, and downstream pressure. Valves can have linear, decreasing sensitivity, or increasing sensitivity characteristics. A linear valve has constant sensitivity where flow is directly proportional to lift. An equal percentage valve's sensitivity increases with lift, maintaining an equal percentage change in flow for equal percentage changes in lift. This compensates for line losses and produces a nearly linear effective characteristic.
This document discusses definitions and measurements of obesity and body fat distribution. It addresses the lack of consistency in defining and measuring obesity, which has hindered comparisons between populations. While body mass index (BMI) is commonly used to classify fatness, other measures like waist circumference and waist-to-hip ratio are also discussed. Measuring intra-abdominal fat content specifically may better correlate with metabolic health risks than just general measures of fatness. An international standard for defining and measuring obesity is still needed.
Obesity is defined as excessive unhealthy accumulation of body fat. India has the third largest obese population in the world after United States of America and China. Prevalence of obesity has reached epidemic proportions in parts of India. In some urban areas, up to a third of the population is either overweight or obese. Childhood and adolescent obesity is also rising rapidly. If this trend continues, certain sections of Indian society may start seeing declining life expectancy in India after many decades of steady progress. Early diagnosis of overweight and obesity may prevent progression to more severe forms associated with complications. In this review, we examine the usefulness of Body Mass Index in diagnosis of obesity in Asian Indian population and the debate surrounding the call for a downward revision of “normal” range in this population.
The document discusses a proposed study that aims to investigate the relationship between Body Mass Index (BMI) and mental health status among undergraduate students at the International Islamic University Malaysia. It plans to recruit 100 students between ages 20-26, half with normal weight and half overweight/obese, to measure their BMI and assess depression, anxiety, and stress levels. The study seeks to examine how BMI may be related to mental health and determine the mental health status of IIUM students. It will calculate BMI from self-reported weight and height data and classify BMI using WHO cut-off points for Malaysians.
Assessment of nutritional status of children in al hilla cityAlexander Decker
This study assessed the nutritional status of 211 children ages 6-12 in Al Hilla City, Iraq. 73 children were underweight, 100 were overweight or obese, and 38 were a normal weight. There was a higher prevalence of underweight in girls (66%) than boys (34%), and of overweight and obesity in boys (66% and 57%) than girls (34% and 43%). Factors associated with underweight included rural residence, low family income, and mothers who worked. Factors linked to overweight and obesity included sedentary lifestyles, spending excessive time watching TV and using computers, and not being breastfed as infants. The study concluded that inactivity and screen time are risk factors for childhood obesity,
A Systematic Review Of The Literature Concerning The Relationship Between Obe...Valerie Felton
This document summarizes a systematic literature review that analyzed studies on the relationship between obesity and mortality in the elderly. The review identified 16 relevant studies involving over 200,000 elderly subjects. Most studies found a U-shaped relationship between BMI and mortality, with increased risk of death for very low or very high BMIs. Several studies found the lowest mortality risk at a BMI between 25-27 kg/m2 for men and 27-29 kg/m2 for women. However, factors like smoking history, disease prevalence, and body fat distribution also influenced mortality risk. While obesity generally increased mortality, some evidence suggested overweight BMIs may be protective for the elderly.
Management of Excess Weight and Obesity: A Global PerspectiveCrimsonPublishersIOD
Non-communicable diseases (NCDs), especially, hypertension, excess weight, obesity, metabolic syndrome, type-2 diabetes, and vascular diseases,
have increased rapidly in the last two decades and have reached an epidemic status worldwide. Some experts have compared this increase in the
incidence of these diseases as “tsunamis”. Tsunamis’ are seasonal and unpredictable whereas, these diseases are predictable and not seasonal. So, what
are we going to do about this situation? Are we going to sit and wait for some miracle to happen? What are the member nations of the United Nations,
World Health Organization, NCD Task Force going to do about this, besides writing and publishing scary reports of future economic and healthcare
disasters? In this overview, we would like to discuss briefly the salient findings on this topic, initiate a healthy dialogue, request suggestions, positive
comments, and offer few suggestions.
O número de cirurgias bariátricas aumentou dramaticamente nos últimos anos devido ao aumento taxas de obesidade nos Estados Unidos. Muitos desses procedimentos são em mulheres de em idade fértil, a perda de peso não só proporciona melhores resultados de saúde na gravidez, mas também apresenta desafios. Diretrizes são necessárias para mulheres em idade fértil considerando especialmente a gravidez e que desejam amamentar seus bebês.
Resultados de este estudo retrospectivo sugere que as mulheres pós-bariátricas grávidas se beneficiariam de consultas clínicas pré-natais para atender às necessidades suplementares. Consultas pré-natais com consultores de lactação e nutricionistas certificados podem contribuir com o estado nutricional e o aconselhamento da amamentação podem melhorar os resultados da amamentação para a díade. Encaminhamentos para nutricionistas e consultores de lactação
para dar continuidade à assistência durante todo o período fértil, incluindo a parte inicial do vida do bebê.
(Tradução livre de Marcus Renato de Carvalho)
An investigation-of-fetal-growth-in-relation-to-pregnancy-characteristicsDr Max Mongelli
DM thesis by Dr Max Mongelli. "An Investigation of Fetal Growth in Relation to Maternal Characteristics", based on research carried out at the Perinatal Research and Monitoring Unit at the Queens' Medical Centre in Nottingham, UK. Some of this material formed the basis for the development of the customised fetal growth charts.
Miracle of Herbals and Natural Products in Treatment and Regulation of Obesityijtsrd
The perfect anti obesity sedate would deliver supported weight misfortune with negligible side effects. The instruments that direct vitality adjust have significant built in repetition, overlap considerably with other physiological capacities, and are affected by social, hedonic and psychological components that restrain the viability of pharmacological intercessions. It is therefore unsurprising that anti obesity medicate revelation programs have been littered with untrue starts, failures in clinical improvement, and withdrawals due to unfavorable impacts that were not fully appreciated at the time of dispatch. Drugs that target pathways in metabolic tissues, such as adipocytes, liver and skeletal muscle, have appeared potential in preclinical considers but none has however come to clinical development. Later enhancements within the understanding of peptidergic flagging of starvation and satiety from the gastrointestinal tract intervened by ghrelin, cholecystokinin CCK , peptide YY PYY and glucagon like peptide 1 GLP 1 Himangshu Jyoti Hazarika | Aziz Ahmed | Kaushal K. Chandrul ""Miracle of Herbals and Natural Products in Treatment and Regulation of Obesity"" Published in International Journal of Trend in Scientific Research and Development (ijtsrd), ISSN: 2456-6470, Volume-3 | Issue-4 , June 2019, URL: https://www.ijtsrd.com/papers/ijtsrd23549.pdf
Paper URL: https://www.ijtsrd.com/pharmacy/other/23549/miracle-of-herbals-and-natural-products-in-treatment-and-regulation-of-obesity/himangshu-jyoti-hazarika
This document provides a literature review on economic factors that influence obesity rates. Several factors are examined, including food prices, technological changes reducing physical activity, television viewing, portion sizes, and reliance on automobiles. Empirical studies have found relationships between obesity and lower food prices, more sedentary lifestyles, television viewing over 3 hours per day, larger portion sizes outside the home, and greater car reliance. The author aims to analyze the significance of several economic factors on obesity rates in males and females across 55 countries using econometric models.
An investigation-of-fetal-growth-in-relation-to-pregnancy-characteristicsDr Max Mongelli
A PDF copy of the DM thesis "An Investigation of Fetal Growth in Relation to Maternal Characteristics", based on research carried out at the Perinatal Research and Monitoring Unit at the Queens' Medical Centre in Nottingham, UK. Some of this material formed the basis for the development of the customised fetal growth charts.
A Systematic Review Of Maternal Obesity And Breastfeeding Intention, Initiati...Biblioteca Virtual
This document summarizes a systematic review examining the relationship between maternal overweight/obesity and breastfeeding intention, initiation and duration. The review identified 27 studies on this topic. The studies generally found that obese women had shorter intended and actual breastfeeding duration compared to normal weight women. Specifically, obese women were less likely to intend to or initiate breastfeeding, and breastfed for shorter durations even after adjusting for confounding factors. The relationship between maternal obesity and delayed onset of lactation was also observed. However, the reasons for these relationships are not fully understood and require further qualitative research.
Normal Weight Obesity Is Associated with MetabolicSyndrome a.docxhenrymartin15260
Normal Weight Obesity Is Associated with Metabolic
Syndrome and Insulin Resistance in Young Adults from a
Middle-Income Country
Francilene B. Madeira1, Antônio A. Silva2*, Helma F. Veloso2, Marcelo Z. Goldani3, Gilberto Kac4,
Viviane C. Cardoso5, Heloisa Bettiol5, Marco A. Barbieri5
1 Physical Education Undergraduate Course, State University of Piauı́, Teresina, Brazil, 2 Department of Public Health, Federal University of Maranhão, São Luı́s, Brazil,
3 Department of Pediatrics and Puericulture, Faculty of Medicine, Federal University of Rio Grande do Sul, Porto Alegre, Brazil, 4 Department of Social and Applied
Nutrition, Josué de Castro Nutrition Institute, Federal University of Rio de Janeiro, Rio de Janeiro, Brazil, 5 Department of Puericulture and Pediatrics, Faculty of Medicine of
Ribeirão Preto, University of São Paulo, Ribeirão Preto, Brazil
Abstract
Objective: This population-based birth cohort study examined whether normal weight obesity is associated with metabolic
disorders in young adults in a middle-income country undergoing rapid nutrition transition.
Design and Methods: The sample involved 1,222 males and females from the 1978/79 Ribeirão Preto birth cohort, Brazil,
aged 23–25 years. NWO was defined as body mass index (BMI) within the normal range (18.5–24.9 kg/m2) and the sum of
subscapular and triceps skinfolds above the sex-specific 90th percentiles of the study sample. It was also defined as normal
BMI and % BF (body fat) .23% in men and .30% in women. Insulin resistance (IR), insulin sensitivity and secretion were
based on the Homeostasis Model Assessment (HOMA) model.
Results: In logistic models, after adjusting for age, sex and skin colour, NWO was significantly associated with Metabolic
Syndrome (MS) according to the Joint Interim Statement (JIS) definition (Odds Ratio OR = 6.83; 95% Confidence Interval CI
2.84–16.47). NWO was also associated with HOMA2-IR (OR = 3.81; 95%CI 1.57–9.28), low insulin sensitivity (OR = 3.89; 95%CI
2.39–6.33), and high insulin secretion (OR = 2.17; 95%CI 1.24–3.80). Significant associations between NWO and some
components of the MS were also detected: high waist circumference (OR = 8.46; 95%CI 5.09–14.04), low High Density
Lipoprotein cholesterol (OR = 1.65; 95%CI 1.11–2.47) and high triglyceride levels (OR = 1.93; 95%CI 1.02–3.64). Most
estimates changed little after further adjustment for early and adult life variables.
Conclusions: NWO was associated with MS and IR, suggesting that clinical assessment of excess body fat in normal-BMI
individuals should begin early in life even in middle-income countries.
Citation: Madeira FB, Silva AA, Veloso HF, Goldani MZ, Kac G, et al. (2013) Normal Weight Obesity Is Associated with Metabolic Syndrome and Insulin Resistance
in Young Adults from a Middle-Income Country. PLoS ONE 8(3): e60673. doi:10.1371/journal.pone.0060673
Editor: Reury F.P Bacurau, University of São Paulo, Brazil
Received November 23, 2012; Accepted March 1, 201.
This research proposal aims to evaluate the effect of obesity, as measured by BMI, on pregnancy rates among women undergoing in-vitro fertilization (IVF). The study will retrospectively analyze data from 200 women ages 18-35 undergoing their first IVF cycle between 2009-2011. Obesity is defined as BMI ≥ 30 kg/m2. The hypothesis is that obesity in reproductive aged women decreases pregnancy rates with IVF. Statistical analysis will include t-tests, ANOVA, and SAS software. The goal is to increase awareness of how obesity can negatively impact fertility and pregnancy outcomes.
This document summarizes evidence that breastfeeding can help combat childhood obesity. It finds that exclusive breastfeeding for at least one year is associated with lower rates of childhood obesity compared to formula feeding. This is because breastmilk regulates appetite and promotes healthy weight through hormones. While breastfeeding rates have increased in the US, rates of exclusive breastfeeding at 6 and 12 months have remained low. Increasing exclusive breastfeeding could help address the epidemic of childhood obesity and subsequent risks of adult obesity and related diseases.
This document discusses obesity as a growing health epidemic in Ireland and outlines a clinical question about the health implications of obesity and practical nursing approaches to assist with weight loss in older adults. It provides background information on obesity rates and costs in Ireland. Three key themes are discussed: 1) Health implications of obesity like increased risk of diseases, decreased quality of life, and life expectancy. 2) Barriers to weight loss like stigma, cost, lack of knowledge and embarrassment. 3) Practical nursing approaches can include education on benefits of weight loss, approaches to lose weight, and addressing barriers.
1) Obesity is a global pandemic affecting over 1 billion people worldwide. It is caused by a complex interplay of environmental, biological, and behavioral factors.
2) Obesity increases the risk of numerous health conditions like heart disease, diabetes, depression, and some cancers. It is associated with metabolic syndrome - a cluster of conditions that occur together like increased blood pressure, blood sugar, and unhealthy cholesterol levels.
3) Preventing obesity requires a multifaceted approach targeting individual risk factors like diet, exercise, stress management, sleep quality, and environmental exposures through primary, secondary, and tertiary prevention strategies across communities and healthcare systems.
Physical Activity during Pregnancy and the Effect on Mothers and Fet.docxmattjtoni51554
Physical Activity during Pregnancy and the Effect on Mothers and Fetal Health
Abstract
1.2 Introduction:
Physical activity is an essential role that all people should engaged, aerobic and muscle strength exercises are an easy to do where the benefits of it are great, prevention, treatment of disease and keeping fit in all stage of life even in pregnancy period and this exercises can be modify to suit physical condition of the pregnant womens
Pregnancy is a blessing from Allah that every woman wishes. Pregnancy it’s condition that many changes it happened on women bodies from the day of fertilization to the day after delivery of the baby and the popular effect in women bodies it’s the increment of body weight, as it's known that many women they didn’t control them weight and they become overweight or obese, in this condition the pregnant woman she will be in danger, many diseases start with increase of the body weight and it may lead to a serious health problems. Without controlling the body weight increment, woman with a normal weight it may become an overweight or even obese.
In general overweight and obesity one of prevalence public issue that affect many countries in the world where it’s observe in all ages, adults, adolescents, and children it maybe became a global epidemic , the impact of this issue has a strong relationship with mortality and morbidity also this relationship have been known for more than 2000 between health professionals[1-2]. body mass index (BMI) is the way that give a right measurement for the total body fat compare with body weight, the method for calculation by determining the body weight in kilogram and divide it by height in meter squared, this way determine the degree of overweight easy with a reliable number.
There are interventions that can control the body weight before pregnancy period, during pregnancy period and after it, but the most important intervention that we will cover it’s the physical activity or exercise and the advantages for this intervention on the mother health and the outcome also the disadvantages that it can happen if available.
Physical activity and exercise has a great impact on health status, where there are many study done to prove this relation. where health outcome in people with physical inactivity is a major problem in the world and specially in developed countries. In worldwide physical inactivity appear in a huge number where one out of every five adults is physically inactive and the long period of sitting independent show that is a risk factor for mortality[3]
The healthy body weight in pregnancy it depends on the body mass index (BMI) so the WHO classify the BMI into four categories underweight: <18.5 kg/m2, normal weight: 18.5-24.99 kg/m2, overweight: 25-29.9 kg/m2, and obese ≥30 kg/m2 [4-5]. With this category, recognizing every case will be easy and right grouping will be more accurate.
all pregnant women are included in all age and different country.
E D I T O R I A LInvited Commentary Childhood and Adolesc.docxbrownliecarmella
E D I T O R I A L
Invited Commentary: Childhood and Adolescent Obesity:
Psychological and Behavioral Issues in Weight Loss Treatment
David B. Sarwer • Rebecca J. Dilks
Received: 5 May 2011 / Accepted: 11 May 2011 / Published online: 31 May 2011
� Springer Science+Business Media, LLC 2011
Abstract The prevalence of childhood and adolescent
obesity has tripled in the past three decades. This increase
has been accompanied by a dramatic rise in obesity-related
health complications among American youth. Thus, many
obese youth are now experiencing illnesses that will
threaten their life expectancy in the absence of significant
weight loss. Despite these concerns, a relatively modest
body of research has focused on the treatment of adolescent
obesity. Results from trials investigating the efficacy of
behavioral and pharmacological treatments, like studies of
these interventions with adults, suggest that individuals
typically lose 5–10% of their initial weight. Unfortunately,
weight regain is common. Given the increase in the number
of obese adolescents, coupled with the modest results from
more conservative treatment approaches, it is not surprising
that bariatric surgery for adolescents who suffer from
extreme obesity has grown in popularity. The weight losses
after surgery are impressive and many adolescents, like
adults, experience significant improvements in their phys-
ical and mental health postoperatively. However, only a
small fraction of adolescents and adults who are heavy
enough for bariatric surgery present for surgical treatment.
Among those who undergo surgery, a significant minority
appear to struggle with a number of behavioral and psy-
chosocial issues that threaten their lifelong success. With
all of this in mind, the current obesity problem in the
United States and other Westernized countries likely will
present a significant challenge to both current and future
medical and mental health professionals who work with
adolescents and young adults.
The Childhood and Adolescent Obesity Problem
Obesity is a growing problem among America’s youth. The
rate of obesity or overweight ([95th percentile for age and
gender) has doubled among children and tripled among
adolescents over the last 20 years (Ogden et al. 2002). The
most recent data suggests that 31% of children in the United
States are currently overweight or obese (Ogden et al. 2010),
which translates into approximately 5 million children.
Furthermore, recent estimates suggest that 4% of American
children and adolescents are above the 99th percentile and,
thus, are extremely obese (Freedman et al. 2007). This
percentage is larger than the number of American youth
affected by cancer, cystic fibrosis, HIV and type I diabetes
mellitus combined (Freedman et al. 2007).
Instead of using the term ‘‘obesity’’ with children and
adolescents, several authorities recommend using the
Centers for Disease Control’s (CDC) BMI tables
(Kuczmarski et.
This paper investigates the causal effect of education on various health outcomes and behaviors in Italy, exploiting a 1963 reform that raised compulsory schooling by three years. The reform provides exogenous variation in education levels needed for causal identification. Using survey data on Italians, the paper analyzes effects on chronic diseases, BMI, smoking, physical activity, preventive health behaviors, and more. Considering multiple outcomes simultaneously allows for a more comprehensive assessment than prior studies examining only one or a few measures. The results provide new causal evidence on how education impacts health in Italy.
2. 2
CHAPTER ONE
INTRODUCTION
Body mass index (BMI) has come to be regarded and
accepted as one of the standard tests for identifying the
level of overweight/obesity of an individual by physical
measurements of height and weight, and rightly so
because of a number of reasons chief amongst which is its
ease of measurement and calculation and its simplicity.
The BMI of an individual is calculated by dividing the
individual’s body weight by the square of his or her
height. It is measured in kg/m2.
BMI= Weight (kg) ÷ Height (m) 2
Considering the fact that BMI calculations involves the
use of numeric values of weight and height, it cannot be
said to be an actual measure of body fat, but Ancel (1972)
found BMI to be the best proxy for body fat percentage
among ratios of weight and height and also appropriate
for population studies. Garrows and Webster (1985) also
believed that BMI had a correlation with amount of body
3. 3
fats and considered it a “simple and stable way with
which to judge obesity”.
BMI seems to be related to other phenomena, for
example cataracts which it was reported to be more likely
to develop in people with a high BMI as observed by
Glyma et al. (1995) and Hiller et al. (1998), another
example is the decrease in BMI following hospitalization of
senile dementia patients as reported by Watanuki et al.
(1991). But of particular interest is the relationship
between BMI and menarche, and in this case BMI
(referring to adiposity) is said to be a criterion for the
occurrence of menarche as suggested by Johnston et al.
(1975), Trussel (1980) reported that a certain amount of
body fat is necessary for menarche, Garrows and Webster
also reported that body fat (which had a correlation with
BMI) was a correlative indicator of menarche, Frisch
(1987) then indicated that the attainment of sufficient
body mass (typically 17% body fat) is a criterion for the
occurrence of menarche and finally Deborah et al. (2007)
showed that girls with BMI above the median at age 8
demonstrated earlier menarche than those girls with BMI
4. 4
below the median at this age. Putting this into
perspective, it would be possible to predict an
approximate time for the occurrence of menarche by using
BMI as a tool since considering that BMI can be used as a
means of measuring adiposity which plays a major role in
the occurrence of menarche.
The age of occurrence of menarche has been on a
constant decline over the past century, in the United
States, UK, France, and Greece, there is a decline in age
at a rate of 0.06-0.07 years every 5 years. Olu Oduntan
(1976) gave the median age for menarche in Nigeria as
13.70±0.03 in urban girls, 14.50±0.09 in rural girls and
13.26±0.06 in girls with university educated parents. In
1976, the menarcheal age of girls with university
educated parents, 13.26±0.06 was comparable with the
median age in the United States back then in 1976. The
latest statistics on the median age at menarche in the
United States is 12.5 years (Anderson et al., 2003), in
Nigeria it is given as 12.22±1.19 years in girls from middle
class homes (Ofuya and Zulest, 2008). This decline in age
at menarche has also brought along with it interests in
5. 5
the effect of early puberty in later years of the girl’s life,
Parents et al. (2005) linked early puberty (menarche) with
increased risk of obesity, diabetes and cancer. Studies
have also shown that girls who are heavier in childhood
experience menarche earlier than their peers, (Cooper,
Kuh, Egger et al. 1996, Petridou, Syrigou, Toupadaki et
al. 1996, Sharma et al., 1988), and at a given age, girls
who are menstruating are heavier and fatter than their
counterparts who are not (Roberts, Wood and Chinn
1986).
Age at menarche can be influenced by a lot of factors,
but for this study we would be analyzing the relationship
BMI and age at menarche. It is easy to understand that
girls with a higher BMI experience menarche earlier than
their peers, but the knowledge of an approximate BMI
necessary for menarche to occur is important to all
parties with an interest in these studies.
6. 6
1.1 BACKGROUND OF STUDY
Menarche is an important landmark in a woman’s
reproductive career, and the effect of BMI on it is well
documented; a Chinese research carried out showed that
Chinese girls with a low body weight gotten from the BMI
results had a lower bone age, delayed breast and pubic
hair development, a lower rate of menarche, lower distal
one-third radius and ulna bone mineral content (BMC),
bone mineral density and bone width (X Du et al., 2003).
They concluded that a BMI<18 is the cut-off for delayed
general growth including menarche. Trussel (1980)
reported that a certain amount of body fat is necessary for
menarche, Garrows and Webster also reported that body
fat (which had a correlation with BMI) was a correlative
indicator of menarche, Frisch (1987) then indicated that
the attainment of sufficient body mass (typically 17%
body fat) is a criterion for the occurrence of menarche and
finally Deborah et al. (2007) showed that girls with BMI
above the median at age 8 demonstrated earlier menarche
than those girls with BMI below the median at this age.
The proximate cause of menarche is an increase in the
7. 7
frequency of the gonadotropin releasing hormone (GnRH)
pulse generator in the hypoyhalamus, but the age at
menarche varies widely and is delayed in populations with
poor nutrition (Thomas et al., 2001; Gluckman and
Hanson, 2006). Until recently, it was generally accepted
that the timing of menarche was related to skeletal
growth, which comes about a year after the peak in height
velocity (simmons and Greulich, 1943; Elizondo,
1992).How these apply to the Nigerian society is of great
interest.
1.2 STATEMENT OF PROBLEM
Early physical maturity among females is on a
continuous trend with most countries experiencing a
steady decline in age at menarche. This decline has
continued over the past century and in countries like the
United States, UK, France, Greece and Nigeria, the decline
in age is at a rate of 0.06-0.07 years every 5 years. Olu
Oduntan (1976) gave the median age for menarche in
Nigeria as 13.70±0.03 in urban girls, 14.50±0.09 in rural
girls and 13.26±0.06 in girls with university educated
parents. In 1976, the menarcheal age of girls with
8. 8
university educated parents, 13.26±0.06 was comparable
with the median age in the United States back then in
1976. The latest statistics on the median age at menarche
in the United States is 12.5 years (Anderson et al., 2003),
in Nigeria it is given as 12.22±1.19 years in girls from
middle class homes (Ofuya and Zulest, 2008). This decline
in age at menarche has also brought along with it
interests in the effect of early puberty in later years of the
girl’s life, Parents et al. (2005) linked early puberty
(menarche) with increased risk of obesity, diabetes and
cancer.
1.3 PURPOSE OF THE STUDY
The purpose of this study is to explore whether the
timing of menarche is more closely related to the BMI.
Considering the effects of adiposity on age at menarche, I
predict that the likely-hood of menarche will be positively
related to an increased level of BMI, and an early age at
menarche would indicate this.
9. 9
1.4 HYPOTHESIS.
Hypotheses were made to be tested with the chosen
means of experiment inorder to guide the effort and focus
along the line of study. The hypothesis made are as
follows:
Ho: The age at menarche is not dependent on the BMI.
HA: The age at menarche is dependent on the BMI.
1.5 SIGNIFICANCE OF THE STUDY.
The significance of the study would be to explain
early age at menarche, and its accompanying sequelae.
The impact of menarche on adult female life cannot be
undervalued, it’s been associated with increased risk of
obesity, diabetes and cancer. It is difficult to measure the
stages of puberty accurately, and so to indicate the timing
of puberty, epidemiological studies often use age at
menarche. The accurate determination of BMI before and
during menarche could be an indicator for age at
menarche and future effect of early menarche on the
female.
10. 10
1.6 SCOPE OF THE STUDY.
The study involves the measurement of the height
and weight of adolescent females to determine the BMI by
the simple weight/height2 ratio. It also involves
measurement of the hip and waist, to determine the
hip/waist ratio, and measurement of blood pressure.
11. 11
CHAPTER TWO.
LITERATURE REVIEW.
Menarche is an important landmark in a woman’s
reproductive career; and, to the degree that the selection
then molds the life-history of a species, one would expect
sexual maturation to be linked to the acquisition of
resources necessary for successful reproduction. The
proximate cause of menarche is an increase in the
frequency of the gonadotropin releasing hormone (GnRH)
pulse generator in the hypothalamus, fat distribution and
BMI but the age at menarche varies widely and is delayed
in populations with poor nutrition (Thomas et al., 2001;
Gluckman and Hanson, 2006). Until recently it was
generally accepted that the timing of menarche is related
to skeletal growth, until studies showed it was more
related to the BMI (Simmons and Greulich, 1943;
Elizondo, 1992).
Another study that menarche depends on a critical
amount of stored fat, since the 16kg of fat typically stored
during childhood and puberty can provide additional
12. 12
energy during pregnancy and lactation was done (Frisch
and Revelle, 1970; Frisch and McArthur, 1974; Frisch et
al., 1973; Frisch, 1976,1994). The hormone leptin,
produced by fat cells, provides a pathway to communicate
the size of fat stores to the GnRH secreting neurons in the
hypothalamus via leptin receptors in KiSS-1 neurons
(Smith et al., 2006). Certain levels of adiposity is required
for puberty (menarche) (Chehab et al., 1996,1997;
Clement et al., 1998; Ozato et al., 1999; Farooqi et al.,
2002), and age at menarche in young women is inversely
related to adipose levels (Matkovic et al., 1997).
Despite the appeal of this hypothesis, studies of
menarche have generally failed to support the critical-fat
theory. Menarche can occur despite low fat levels with
little evidence of a threshold (Johnston et al., 1971;
Billewicz et al.,1976; Trussell, 1978; Garn and LaVelle,
1983); and multivariate analyses have shown that height
and bi-iliac breadth are much more important than
measures of total fat or body weight in predicting the age
of menarche (van’t Hof and Roede, 1977; Ellison, 1982;
Stark et al., 1989; Elizondo, 1992).
13. 13
However, another possibility is that menarche may
be related to fat distribution rather than total fat, and in
particular to the relative amount of lower-body (gluteo-
femoral) versus upper-body fat. Female waist-hip ratio
(WHR) declines during childhood from 1.03 at 4 months of
age to 0.78 at the time of menarche (Fredriks et al., 2005),
and there is a steep increase in hip circumference just
before menarche (Forbes, 1992). Young German women in
higher quartiles for self-reported hip, thigh, and leg
circumferences had higher odds of menarche in cross-
sectional bivariate analyses (Merzenich et al., 1993).
There is also evidence that gluteofemoral fat
produces more leptin than upper-body fat. Subcutaneous
gluteal fat contains more leptin mRNA than abdominal fat
(Papaspyrou-Rao et al., 1997), and multivariate analyses
indicate that hip circumference is a significant positive
predictor of blood leptin levels while waist circumference
is not (Bennett et al., 1997; Ho et al., 1999; Sudi et al.,
2000). For example, in the study by Bennett et al. (1997),
hip circumference explained 36% of the variance in blood
leptin levels, total fat explained an additional 2%, and
14. 14
waist circumference was not related. There is also a
negative relationship between the amount of free leptin
and both waist circumference and WHR (Magni et al.,
2005). Thus, gluteofemoral fat deposits could influence
the timing of menarche through their effects on blood
leptin level.
X Du et al., 2003 in their work, low body weight and
its association with bone health and pubertal maturation
in Chinese girls, showed that BMI<18 in females is
responsible for delayed general growth, development,
delay in puberty and consequently menarche.
15. 15
CHAPTER THREE.
MATERIALS AND METHODOLOGY.
3.1 RESEARCH DESIGN
This research work is a basic research; therefore the
research design involves primarily the measurement of
height, weight, hip circumference, waist circumference,
and the filling of a questionnaire.
3.2 STUDY AREA.
This study was conducted in Ekpoma which lies
within Esan West local government area of Edo State. It
lies between latitude 60º 40º N 60º 45º N and 60º 05º E
60º 10º E (Obabori et al, 2006). Ekpoma is the designated
headquater of Esan West local government, it has a
population at last the count (2006) of 125,843 people,
63,785 of which are male and the remaining 62,057 are
females (NPC, 2006).
16. 16
3.3 POPULATION OF STUDY AND SAMPLE SIZE.
The study was conducted with subjects residing in
Ekpoma, Esan West local government area of Edo State.
The study involved 102 females between the ages of
13-20 years, spread over the senior classes (SS1-SS3) in
the various secondary schools listed in the population of
the study. The sample population was limited to only two
secondary schools out of the five known secondary
schools in the area. The selected schools are:
Ambrose Alli University Staff Secondary School,
Ihumundumu.
Zana Memorial College, Ikekogbe.
3.4 SAMPLING AND SAMPLING TECHNIQUE.
The entire population of females used in this
research, were gotten from the secondary schools listed
above. 80 females were gotten from Zana Memorial
College and the remaining 22 were gotten from Ambrose
Alli University Staff Secondary School presenting a total of
102 subjects.
17. 17
The values represented were taken from only
females, because menarche is particular to the female
gender.
3.5 RESEARCH INSTRUMENT.
The instruments used in this research work were:
Tape rule for measuring height.
Weight scale for measuring weight.
Tape rule for measuring hip & waist circumference
An electronic sphygmomanometer for measuring blood
pressure.
Age at menarche, nutritional status, socio-economic
status was established through questionnaires and
interviews. Details of the questionnaire are shown in
appendix 1.
3.6 ETHICAL PRE-REQUISITES
The researcher sought the permission of the various
head of schools before carrying out the procedures
necessary for the research among the females.
18. 18
3.7 ANALYSIS OF DATA
Data was tabulated, histograms and graphs were
drawn. Further analysed using the statistical package for
the social sciences version 17 (SPSS 17).The chi squared
test was used to compare variable characteristics.
To test the hypothesis in a bivariate context, we
examined some other data collected during the course of
the research. Measures used for the bivariate analysis
include, BMI, systolic blood pressure, diastolic blood
pressure, mean arterial pressure, waist circumference,
hip circumference, hip-waist ratio, and age at menarche.
The total number of respondents involved in the
study is 102. We divided the BMI values into Low BMI
(<18.5), and Normal BMI (>18.5). We the further divided
the normal BMI into Low-normal BMI (>18.5<21.5) and
High-normal BMI (>21.5<24.9). We pitched each of these
classifications against age at menarche and sought out
any relationship therein.
Pearson’s correlations coefficients was used in
correlations, trends were tested using a linear regression
19. 19
model, in which BMI was entered as the independent
variable (predictors) and age at menarche was the
dependent variable (responsive variable). Confidence
interval (CI) of 95% was chosen in the analysis.
20. 20
CHAPTER FOUR
RESULTS
This chapter presents the analysis of data and
discussion of results which were based on the data
collected from the sample population on the effect of BMI
on age at menarche in the study population of Esan West
local government area of Edo State.
4.1 SECTION A (BIODATA)
From the data collected using the questionnaire,
4.9% of the subjects were aged 13yrs, with the highest
frequency being age 15 which made up 42% of the entire
population.
Below is a table summarizing the distribution of
subject’s age.
22. 22
The subjects used were in senior secondary (SS)
class of their various schools. 39.2% of the subjects were
in SS1 class, with the majority of subjects were in SS2 as
shown in the high frequency of 47.1. The table below
summarizes the educational distribution.
TABLE 1-b; EDUCATIONAL STATUS
Frequency Percent Valid Percent
Cumulative
Percent
Valid 1.00 40 39.2 39.2 39.2
2.00 48 47.1 47.1 86.3
3.00 14 13.7 13.7 100.0
Total 102 100.0 100.0
Figure 2
23. 23
As expected, majority of the subjects were either of
the Ishan or Bini ethnic extraction, with equal frequencies
of 36.3% of the sample population.
TABLE 1-c; ETHNICITY
Frequency Percent Valid Percent
Cumulative
Percent
Valid ISHAN 37 36.3 36.3 36.3
BINI 37 36.3 36.3 72.5
HAUSA 3 2.9 2.9 75.5
YORUBA 3 2.9 2.9 78.4
IBO 1 1.0 1.0 79.4
OTHERS 21 20.6 20.6 100.0
Total 102 100.0 100.0
Figure 3
24. 24
Below is a tabular representation of the occupation
of parents.The majority of subjects had fathers who were
businessmen 25.5%, the nearest to that had fathers who
were teachers 12.7%. Majority had mothers who were
traders 47.1%.
TABLE 1-d; Mothers Occupation
Frequency Percent Valid Percent
Cumulative
Percent
Valid AAU ST 2 2.0 2.0 2.0
BANKER 2 2.0 2.0 3.9
BUSINE 28 27.5 27.5 31.4
CIVIL 3 2.9 2.9 34.3
DOCTOR 2 2.0 2.0 36.3
FASHIO 1 1.0 1.0 37.3
HAIR S 1 1.0 1.0 38.2
HOUSE 3 2.9 2.9 41.2
LECTUR 2 2.0 2.0 43.1
NURSE 4 3.9 3.9 47.1
TEACHE 5 4.9 4.9 52.0
TRADER 48 47.1 47.1 99.0
WORKER 1 1.0 1.0 100.0
Total 102 100.0 100.0
26. 26
Interestingly, 66.7% of subjects reside in flats as
opposed to 3.9% that reside in a duplex, and 8.8% lived in
single rooms.
TABLE 1-f; TYPE OF HOUSING
Frequency Percent Valid Percent
Cumulative
Percent
Valid Single Room 9 8.8 8.8 8.8
Self Contained 15 14.7 14.7 23.5
Flat 68 66.7 66.7 90.2
Duplex 4 3.9 3.9 94.1
Mansion 6 5.9 5.9 100.0
Total 102 100.0 100.0
Figure 4
27. 27
4.2 SECTION B (LEVEL OF ACTIVITY)
Below is the table representing the distribution of
subjects’ means of commuting to and from school, and it
shows that 33.3% and 33.7% of the subjects commute to
school every day on foot and public transport respectively,
while 13.7% go to school with their parent’s car. Below is
the table representing the distribution.
TABLE 2-a; MEANS OF COMMUTING
Frequency Percent Valid Percent
Cumulative
Percent
Valid On footmosttimes 34 33.3 33.3 33.3
Publictransport 38 37.3 37.3 70.6
Personal car 14 13.7 13.7 84.3
Droppedoff 16 15.7 15.7 100.0
Total 102 100.0 100.0
Figure 5
28. 28
On exercise status, 68.6% of the subjects are
involved in exercise and sporting activities, which leave us
with 31.4% who do not engage themselves in any form of
exercises.
Figure 6
TABLE 2-b; EXERCISE STATUS
Frequency Percent Valid Percent
Cumulative
Percent
Valid YES 70 68.6 68.6 68.6
NO 32 31.4 31.4 99.0
Total 102 100.0 100.0
29. 29
Of the 68.6% that exercise, just 23.5% exercise on a
daily basis.
TABLE 2-c; EXERCISE FREQUENCY
Frequency Percent Valid Percent
Cumulative
Percent
Valid DAILY 24 23.5 23.5 23.5
Bi WEEKLY 22 21.6 21.6 45.1
WEEKLY 28 27.5 27.5 72.5
MONTHLY 28 27.5 27.5 100.0
Total 102 100.0 100.0
Figure 7
30. 30
4.3 SECTION C (NUTRITIONAL DATA)
79.4% of the subjects eat three times or more each
day, the table below summarizes the distribution.
TABLE 3-a; DAILY NUTRITIONAL FREQUENCY
Frequency Percent Valid Percent
Cumulative
Percent
Valid ONCE 2 2.0 2.0 2.0
TWICE 16 15.7 15.7 17.6
THRICE 41 40.2 40.2 57.8
MORE THAN THREE TIMES 40 39.2 39.2 97.1
NOT REGULARLY 3 2.9 2.9 100.0
Total 102 100.0 100.0
Figure 8
31. 31
71.7% of the subjects had carbohydrates and starch
in their staple diet, and a meager 14.7% had protein in
their staple diet. Below is the table representing the
distribution.
TABLE 3-b; STAPLE DIET
Frequency Percent Valid Percent Cumulative Percent
Valid BEANS 9 8.8 8.8 8.8
BEANS/R 1 1.0 1.0 10.8
EBA 2 2.0 2.0 12.7
EBA & M 7 6.9 6.9 20.6
EBA & O 1 1.0 1.0 21.6
EGG & Y 3 2.9 2.9 24.5
FRIED P 1 1.0 1.0 25.5
FRIED R 4 3.9 3.9 29.4
INDOME 3 2.9 2.9 32.4
RICE 44 43.1 43.1 75.5
RICE & 2 2.0 2.0 94.1
SANTANA 1 1.0 1.0 95.1
SEMOVIT 1 1.0 1.0 96.1
SNACKS 2 2.0 2.0 98.0
YAM/EGG 2 2.0 2.0 100.0
Total 102 100.0 100.0
32. 32
72.5% of the subjects claim not to be on any diet or
weight modulator as opposed to 27.5% of subject who
claim to be on a diet and/or weight modulator.
TABLE 3-c; DIETING STATUS
Frequency Percent Valid Percent
Cumulative
Percent
Valid YES 28 27.5 27.5 27.5
NO 74 72.5 72.5 100.0
Total 102 100.0 100.0
Figure 9
33. 33
A greater number of subjects visit a fast food outlet
once in a month, this make up about 42.2% of the sample
population.
Figure 10
TABLE 3-d; Fast Food Outlet Frequency
Frequency Percent Valid Percent
Cumulative
Percent
Valid DAILY 16 15.7 15.7 15.7
ONCE A WEEK 11 10.8 10.8 26.5
TWICE A WEEK 17 16.7 16.7 43.1
WEEKLY 15 14.7 14.7 57.8
MONTHLY 43 42.2 42.2 100.0
Total 102 100.0 100.0
34. 34
On alcohol consumption, majority of the subjects,
88.2%, claimed not to consume alcohol.
TABLE 3-e; Alcohol Status
Frequency Percent Valid Percent
Cumulative
Percent
Valid YES 12 11.8 11.8 11.8
NO 90 88.2 88.2 100.0
Total 102 100.0 100.0
Figure 11
35. 35
On family histories of hypertension and
obesity.59.8% of the subjects had no family history of
hypertension, and similar scenario presents itself in the
case of obesity, as 62.7% of the subjects claimed not to
have any family history of obesity. Below are tables and
histograms summarizing the various distributions for
family histories of hypertension and obesity.
TABLE 3-f; Family History hx HPT
Frequency Percent Valid Percent
Cumulative
Percent
Valid YES 15 14.7 14.7 14.7
NO 61 59.8 59.8 74.5
DON’T KNOW 26 25.5 25.5 100.0
Total 102 100.0 100.0
Figure 12
36. 36
Figure 13
TABLE 3-g; Family History of Obesity
Frequency Percent Valid Percent
Cumulative
Percent
Valid YES 20 19.6 19.6 19.6
NO 64 62.7 62.7 82.4
DON’T KNOW 18 17.6 17.6 100.0
Total 102 100.0 100.0
37. 37
4.4 SECTION D (Anthropometry/Blood pressure)
When measured, the minimum weight of 40kg was
recorded in 3.9% of the subject population. The highest
frequency was 50kg which was recorded in 18.6% of the
subject population.
TABLE 4-a; Weight
Frequency Percent Valid Percent
Cumulative
Percent
Valid 40.00 4 3.9 3.9 3.9
41.00 1 1.0 1.0 4.9
42.00 3 2.9 2.9 7.8
43.00 5 4.9 4.9 12.7
44.00 4 3.9 3.9 16.7
45.00 3 2.9 2.9 19.6
46.00 6 5.9 5.9 25.5
47.00 4 3.9 3.9 29.4
48.00 4 3.9 3.9 33.3
49.00 6 5.9 5.9 39.2
50.00 19 18.6 18.6 57.8
52.00 4 3.9 3.9 61.8
53.00 4 3.9 3.9 65.7
54.00 2 2.0 2.0 67.6
55.00 9 8.8 8.8 76.5
56.00 3 2.9 2.9 79.4
57.00 1 1.0 1.0 80.4
58.00 7 6.9 6.9 87.3
60.00 6 5.9 5.9 93.1
62.00 2 2.0 2.0 95.1
63.00 3 2.9 2.9 98.0
65.00 2 2.0 2.0 100.0
Total 102 100.0 100.0
38. 38
Figure 14
The tallest height recorded was 1.88m which was
measured in 2% of the subjects; the table below explains
the distributions.
55. 55
Figure 23
4.5 SECTION E (GENERAL)
On sexual activity, 84.3% of the subject claimed not
to be sexually active, leaving 15.7% who are sexually
active.
TABLE 5-a; SEXUAL ACTIVITY
Frequency Percent Valid Percent
Cumulative
Percent
Valid YES 16 15.7 15.7 15.7
NO 86 84.3 84.3 100.0
Total 102 100.0 100.0
56. 56
Figure 24
On age at menarche, 2.9% had 11yrs as their age at
menarche; a further 28.4% had their age at menarche at
12yrs. The table below shows the distribution.
TABLE 5-b; AGE AT MENARCHE
Frequency Percent Valid Percent
Cumulative
Percent
Valid 11.00 3 2.9 2.9 2.9
12.00 29 28.4 28.4 31.4
13.00 34 33.3 33.3 64.7
14.00 23 22.5 22.5 87.3
15.00 11 10.8 10.8 98.0
16.00 1 1.0 1.0 99.0
18.00 1 1.0 1.0 100.0
Total 102 100.0 100.0
58. 58
4.6 PRESENTATION AND ANALYSIS OF DATA
TABLE 4.6-1
Statistics
Age BMI SBP DBP
AGE AT
MENARCHE MAP
WAIST-
C HIP-C
H/W
RATIO
Valid 102 102 102 102 102 102 102 102 102
Missing 0 0 0 0 0 0 0 0 0
Mean 15.1961 18.9254 115.0490 69.0980 13.1765 84.4150 70.7941 88.1961 1.2562
Std. Error of
Mean
.11150 .24517 1.00459 .95436 .11608 .85711 .60242 .56202 .00861
Median 15.0000 18.5906 116.0000 71.0000 13.0000 85.0000 71.0000 88.0000 1.2500
Mode 15.00 16.80 117.00 71.00 13.00 86.67 65.00 88.00 1.23
Std.
Deviation
1.12610 2.47607 10.14584 9.63853 1.17239 8.65643 6.08413 5.67614 .08700
Variance 1.268 6.131 102.938 92.901 1.374 74.934 37.017 32.219 .008
Range 7.00 11.22 80.00 45.00 7.00 45.00 36.00 28.00 .57
Minimum 13.00 13.70 92.00 44.00 11.00 61.00 60.00 79.00 1.10
Maximum 20.00 24.92 172.00 89.00 18.00 106.00 96.00 107.00 1.67
Percentiles 25 15.0000 17.1875 108.7500 62.0000 12.0000 78.5833 65.0000 85.0000 1.2075
50 15.0000 18.5906 116.0000 71.0000 13.0000 85.0000 71.0000 88.0000 1.2500
75 16.0000 20.7008 120.2500 75.2500 14.0000 91.4167 74.0000 91.2500 1.3200
The table above shows the details of data such as
the mean, median, mode, percentiles of the total data
collected.
The range of age of subjects used in this study was
between the ages of 13 and 20. The median age was 15
which made up 42.2% of the total subjects (n=102). The
mean age was 15.20±1.13 which was 86.3% of the total
subjects. 4.9% of the total respondents fell above the
mean age, while 8.9% fell below it.
59. 59
The mean age at menarche is 13.18±1.17, the
maximum age at menarche of the female subjects is 18
yrs, and the minimum age is 11 yrs.
The mean BMI of the female subjects is 18.93±2.48,
the maximum BMI is 24.92 and the minimum BMI is
13.70.
Upon analysis, the values of BMI were divided into
normal BMI and low BMI.
TABLE 4.6-2
Statistics
AGE BMI SBP DBP MAP
WAIST-
C HIP-C
H/W
RATIO
AGE AT
MENARCH
E
N Valid 54 54 54 54 54 54 54 54 54
Missing 0 0 0 0 0 0 0 0 0
Mean 15.3333 20.6947 116.1111 70.4815 85.6914 72.0000 91.0741 1.2702 13.3148
Std. Error of Mean .12950 .24383 1.03727 1.28740 1.05095 .90692 .75922 .01058 .17299
Median 15.0000 20.1154 117.0000 71.0000 84.6667 71.0000 90.0000 1.2600 13.0000
Mode 15.00 19.33a
117.00 71.00 76.67a
71.00 93.00 1.33 13.00
Std. Deviation .95166 1.79176 7.62238 9.46043 7.72289 6.66447 5.57911 .07771 1.27122
Range 5.00 6.33 33.00 38.00 34.33 33.00 24.00 .33 7.00
Minimum 13.00 18.59 99.00 51.00 67.00 63.00 83.00 1.10 11.00
Maximum 18.00 24.92 132.00 89.00 101.33 96.00 107.00 1.43 18.00
Percentiles 25 15.0000 19.1467 110.0000 63.0000 80.5833 66.0000 87.7500 1.2200 12.0000
50 15.0000 20.1154 117.0000 71.0000 84.6667 71.0000 90.0000 1.2600 13.0000
75 16.0000 22.1003 122.0000 78.2500 93.0833 76.0000 93.0000 1.3300 14.0000
The table above shows the details of data such as
the mean, median, mode, percentiles of the data collected
based on a normal BMI range from 18.5-25.0.
60. 60
54 subjects fell within the normal BMI range.
The range of age of subjects that fell within normal
BMI was between the ages of 13-18. The median age was
15 which made up 42.6% of the subjects with normal BMI
(n=54). The mean age was 15.33±1 which was 88.9% of
the subjects with normal BMI. 7.5% of the subjects with
normal BMI were above the mean age, while 3.7% fell
below it.
The mean age at menarche was found to be
13.32±1.27, the maximum age at menarche of the female
subjects was 18 yrs, and the minimum age was 11 yrs.
The mean BMI of the female subjects with normal
BMI was 20.70±1.80, the maximum BMI was 24.92 and
the minimum BMI was 18.59.
61. 61
TABLE 4.6-3
Statistics
AGE BMI SBP DBP MAP
WAIST-
C HIP-C
H/W
RATIO
AGE AT
MENARCH
E
N Valid 48 48 48 48 48 48 48 48 48
Missing 0 0 0 0 0 0 0 0 0
Mean 15.0417 16.9365 113.8542 67.5417 82.9790 69.4375 84.9583 1.2402 13.0208
Std. Error of Mean .18584 .19954 1.78498 1.39971 1.36774 .73472 .53838 .01367 .15032
Median 15.0000 17.0450 114.0000 70.5000 85.3300 69.0000 85.0000 1.2300 13.0000
Mode 15.00 16.80 116.00 56.00a
74.00a
65.00 88.00 1.23a
12.00a
Std. Deviation 1.28756 1.38243 12.36672 9.69746 9.47599 5.09028 3.73003 .09472 1.04147
Range 7.00 4.73 80.00 42.00 45.00 21.00 14.00 .57 4.00
Minimum 13.00 13.70 92.00 44.00 61.00 60.00 79.00 1.10 11.00
Maximum 20.00 18.43 172.00 86.00 106.00 81.00 93.00 1.67 15.00
Percentiles 25 14.0000 15.9375 107.2500 59.2500 75.0000 65.0000 82.2500 1.1825 12.0000
50 15.0000 17.0450 114.0000 70.5000 85.3300 69.0000 85.0000 1.2300 13.0000
75 15.7500 18.2200 119.0000 74.7500 89.6675 73.0000 88.0000 1.3050 14.0000
The table above shows the details of data such as
the mean, median, mode, percentiles of the data collected
based on a low BMI range <18.5.
48 subjects fell within the low BMI range.
The range of age of subjects that fell within low BMI
was between the ages of 13-20. The median age was 15
which made up 41.7% of the subjects with low BMI
(n=48). The mean age was 15.04±1.29 which was 83.4% of
the subjects with low BMI. 10.5% of the subjects with low
BMI were above the mean age, while 6.3% fell below it.
62. 62
The mean age at menarche was found to be
13.02±1.04, the maximum age at menarche of the female
subjects was 15 yrs, and the minimum age was 11 yrs.
The mean BMI of the female subjects with low BMI
was 16.94±1.38, the maximum BMI was 18.43 and the
minimum BMI was 13.70.
For a more thorough analysis, the values of the
normal BMI were further divided into low-normal BMI and
high-normal BMI.
TABLE 4.6-4
Statistics
AGE BMI SBP DBP MAP
WAIST-
C HIP-C
H/W
RATIO
AGE AT
MENARCH
E
N Valid 17 17 17 17 17 17 17 17 17
Missing 0 0 0 0 0 0 0 0 0
Mean 14.8824 22.9305 119.1765 74.6471 89.4902 75.9412 94.7647 1.2535 12.8235
Std. Error of Mean .22496 .25671 1.87325 2.37781 1.92191 2.02279 1.63268 .02020 .39515
Median 15.0000 22.5827 122.0000 79.0000 94.0000 74.0000 93.0000 1.2400 12.0000
Mode 15.00 22.10 120.00a
83.00 75.00a
71.00a
93.00 1.23 12.00
Std. Deviation .92752 1.05844 7.72363 9.80396 7.92422 8.34019 6.73173 .08329 1.62924
Range 3.00 3.12 25.00 29.00 22.33 31.00 19.00 .32 7.00
Minimum 13.00 21.80 103.00 55.00 75.00 65.00 88.00 1.11 11.00
Maximum 16.00 24.92 128.00 84.00 97.33 96.00 107.00 1.43 18.00
Percentiles 25 14.5000 22.1003 115.0000 68.5000 82.8333 70.0000 89.0000 1.2100 12.0000
50 15.0000 22.5827 122.0000 79.0000 94.0000 74.0000 93.0000 1.2400 12.0000
75 15.5000 24.2188 125.0000 83.0000 96.0000 80.0000 99.0000 1.2900 13.0000
63. 63
The table above shows the details of data such as
the mean, median, mode, percentiles of the data collected
based on a high normal BMI range from >21.5<25.0.
17 subjects fell within the high normal BMI range.
The range of age of subjects that fell within normal
BMI was between the ages of 13-16. The median age was
15 which made up 52.9% of the subjects with high
normal BMI (n=17). The mean age was 14.88±0.93 which
was 88.3% of the subjects with high normal BMI.
The mean age at menarche was found to be
12.82±1.63, the maximum age at menarche of the female
subjects was 18 yrs, and the minimum age was 11 yrs.
The mean BMI of the female subjects with high
normal BMI was 22.93±1.06, the maximum BMI was
24.92 and the minimum BMI was 21.80.
64. 64
TABLE 4.6-5
Statistics
age BMI SBP DBP MAP
WAIST-
C HIP-C
H/W
RATIO
AGE AT
MENARCHE
N Valid 37 37 37 37 37 37 37 37 37
Missing 0 0 0 0 0 0 0 0 0
Mean 15.5405 19.6675 114.7027 68.5676 83.9459 70.1892 89.3784 1.2778 13.5405
Std. Error of Mean .14803 .14551 1.19173 1.44340 1.16194 .80150 .66368 .01232 .16709
Median 16.0000 19.3337 116.0000 68.0000 83.3333 71.0000 88.0000 1.3000 13.0000
Mode 16.00 19.33 117.00 71.00 76.67a
64.00 85.00 1.33 13.00
Std. Deviation .90045 .88510 7.24900 8.77984 7.06780 4.87532 4.03699 .07495 1.01638
Range 4.00 2.71 33.00 38.00 34.33 16.00 15.00 .28 4.00
Minimum 14.00 18.59 99.00 51.00 67.00 63.00 83.00 1.10 12.00
Maximum 18.00 21.30 132.00 89.00 101.33 79.00 98.00 1.38 16.00
Percentiles 25 15.0000 19.0158 109.0000 62.5000 80.3333 65.0000 85.5000 1.2200 13.0000
50 16.0000 19.3337 116.0000 68.0000 83.3333 71.0000 88.0000 1.3000 13.0000
75 16.0000 20.4514 117.0000 74.5000 88.3333 73.5000 93.0000 1.3400 14.0000
The table above shows the details of data such as
the mean, median, mode, percentiles of the data collected
based on a low normal BMI range of <21.5.
37 subjects fell within the low normal BMI range.
The range of age of subjects that fell within low
normal BMI was between the ages of 14-18. The median
age was 16 which made up 40.5% of the subjects with low
normal BMI (n=37). The mean age was 15.54±1 which was
89.1% of the subjects with low normal BMI.
65. 65
The mean age at menarche was found to be
13.54±1.02, the maximum age at menarche of the female
subjects was 16 yrs, and the minimum age was 12 yrs.
The mean BMI of the female subjects with low
normal BMI was 19.67±0.89, the maximum BMI was
21.30 and the minimum BMI was 18.59.
4.7 CHI SQUARE TEST COMPARING BODY MASS
INDEX AND AGE AT MENARCHE
Upon completion of analysis of the data, a negative
correlation between BMI and age at menarche was found.
The same was realized in all the categories and sub-
classification of BMI. This correlation was however found
not to be statistically insignificant (p>0.05) in all but one,
the normal BMI, with a high level of statistical significance
(p<0.01) found. Tables and graphs below show the
relationship between the two variables.
66. 66
4.7.1 FOR TOTAL DATA
4.7.1.1 Correlations
TABLE 4.7.1.1-a; Descriptive Statistics
Mean Std. Deviation N
age 15.1961 1.12610 102
BMI 18.9254 2.47607 102
AGE AT MENARCHE 13.1765 1.17239 102
TABLE 4.7.1.1-b; Correlations
age BMI
AGE AT
MENARCHE
age Pearson Correlation 1 -.023 .251*
Sig. (2-tailed) .817 .011
N 102 102 102
BMI Pearson Correlation -.023 1 -.057
Sig. (2-tailed) .817 .566
N 102 102 102
AGE AT MENARCHE Pearson Correlation .251*
-.057 1
Sig. (2-tailed) .011 .566
N 102 102 102
*. Correlation is significantatthe 0.05 level (2-tailed).
4.7.1.2 Regression
TABLE 4.7.1.2-a; Variables Entered/Removedb
Model
Variables
Entered
Variables
Removed Method
1 BMIa
. Enter
a. All requested variables entered.
b. DependentVariable:AGE AT MENARCHE
TABLE 4.7.1.2-b; Model Summary
Model R R Square
Adjusted R
Square
Std. Error of the
Estimate
1 .057a
.003 -.007 1.17628
a. Predictors:(Constant),BMI
67. 67
TABLE 4.7.1.2-c; ANOVAb
Model Sum of Squares df Mean Square F Sig.
1 Regression .459 1 .459 .332 .566a
Residual 138.365 100 1.384
Total 138.824 101
a. Predictors:(Constant),BMI
b. DependentVariable:AGE AT MENARCHE
Figure 26
TABLE 4.7.1.2-d; Coefficientsa
Model
Unstandardized Coefficients
Standardized
Coefficients
t Sig.
95.0% Confidence Interval for B
B Std. Error Beta Lower Bound Upper Bound
1(Constant) 13.692 .902 15.177 .000 11.902 15.482
BMI -.027 .047 -.057 -.576 .566 -.121 .067
a. Dependent Variable:AGE AT MENARCHE
68. 68
Figure 27
4.7.2 FOR NORMAL BMI
4.7.2.1 Correlations
TABLE 4.7.2.1-a; Descriptive Statistics
Mean Std. Deviation N
age 15.3333 .95166 54
BMI 20.6947 1.79176 54
AGE AT MENARCHE 13.3148 1.27122 54
TABLE 4.7.2.1-b; Correlations
age BMI
AGE AT
MENARCHE
age Pearson Correlation 1 -.188 .224
Sig. (2-tailed) .174 .104
N 54 54 54
BMI Pearson Correlation -.188 1 -.352**
Sig. (2-tailed) .174 .009
N 54 54 54
AGE AT MENARCHE Pearson Correlation .224 -.352**
1
Sig. (2-tailed) .104 .009
N 54 54 54
**. Correlation is significantatthe 0.01 level (2-tailed).
69. 69
4.7.2.2 Regression
TABLE 4.7.2.2-a; Variables Entered/Removedb
Model
Variables
Entered
Variables
Removed Method
1 BMIa
. Enter
a. All requested variables entered.
b. DependentVariable:AGE AT MENARCHE
TABLE 4.7.2.2-b; Model Summary
Model R R Square
Adjusted R
Square
Std. Error of the
Estimate
1 .352a
.124 .107 1.20115
a. Predictors:(Constant),BMI
TABLE 4.7.2.2-c; ANOVAb
Model Sum of Squares df Mean Square F Sig.
1 Regression 10.625 1 10.625 7.364 .009a
Residual 75.023 52 1.443
Total 85.648 53
a. Predictors:(Constant),BMI
b. DependentVariable:AGE AT MENARCHE
TABLE 4.7.2.2-d; Coefficientsa
Model
Unstandardized Coefficients
Standardized
Coefficients
t Sig.
95.0% Confidence Interval for B
B Std. Error Beta Lower Bound Upper Bound
1(Constant) 18.486 1.913 9.665 .000 14.648 22.324
BMI -.250 .092 -.352 -2.714 .009 -.435 -.065
a. DependentVariable:AGE AT MENARCHE
71. 71
4.7.3 FOR LOW BMI
4.7.3.1 Correlations
TABLE 4.7.3.1-a; Descriptive Statistics
Mean Std. Deviation N
age 15.0417 1.28756 48
BMI 16.9365 1.38243 48
AGE AT MENARCHE 13.0208 1.04147 48
TABLE 4.7.3.1-b; Correlations
age BMI
AGE AT
MENARCHE
age Pearson Correlation 1 -.209 .269
Sig. (2-tailed) .154 .064
N 48 48 48
BMI Pearson Correlation -.209 1 -.037
Sig. (2-tailed) .154 .804
N 48 48 48
AGE AT MENARCHE Pearson Correlation .269 -.037 1
Sig. (2-tailed) .064 .804
N 48 48 48
4.7.3.2 Regression
TABLE 4.7.3.2-a; Variables Entered/Removedb
Model
Variables
Entered
Variables
Removed Method
1 BMIa
. Enter
a. All requested variables entered.
b. DependentVariable:AGE AT MENARCHE
TABLE 4.7.3.2-b; Model Summary
Model R R Square
Adjusted R
Square
Std. Error of the
Estimate
1 .037a
.001 -.020 1.05202
a. Predictors:(Constant),BMI
72. 72
TABLE 4.7.3.2-c; ANOVAb
Model Sum of Squares df Mean Square F Sig.
1 Regression .069 1 .069 .062 .804a
Residual 50.910 46 1.107
Total 50.979 47
a. Predictors:(Constant),BMI
b. DependentVariable:AGE AT MENARCHE
TABLE 4.7.3.2-d; Coefficientsa
Model
Unstandardized Coefficients
Standardized
Coefficients
t Sig.
95.0% Confidence Interval for B
B Std. Error Beta Lower Bound Upper Bound
1(Constant) 13.490 1.886 7.152 .000 9.693 17.286
BMI -.028 .111 -.037 -.249 .804 -.251 .196
a. DependentVariable:AGE AT MENARCHE
Figure 30
73. 73
Figure 31
4.7.4 FOR HIGH NORMAL
4.7.4.1 Correlations
TABLE 4.7.4.1-a; Descriptive Statistics
Mean Std. Deviation N
age 14.8824 .92752 17
BMI 22.9305 1.05844 17
AGE AT MENARCHE 12.8235 1.62924 17
TABLE 4.7.4.1-b; Correlations
age BMI
AGE AT
MENARCHE
age Pearson Correlation 1 .030 .068
Sig. (2-tailed) .908 .795
N 17 17 17
BMI Pearson Correlation .030 1 -.175
Sig. (2-tailed) .908 .503
N 17 17 17
AGE AT MENARCHE Pearson Correlation .068 -.175 1
Sig. (2-tailed) .795 .503
N 17 17 17
74. 74
4.7.4.2 Regression
TABLE 4.7.4.2-a; Variables Entered/Removedb
Model
Variables
Entered
Variables
Removed Method
1 BMIa
. Enter
a. All requested variables entered.
b. DependentVariable:AGE AT MENARCHE
TABLE 4.7.4.2-b; Model Summary
Model R R Square
Adjusted R
Square
Std. Error of the
Estimate
1 .175a
.030 -.034 1.65681
a. Predictors:(Constant),BMI
TABLE 4.7.4.2-c; ANOVAb
Model Sum of Squares df Mean Square F Sig.
1 Regression 1.295 1 1.295 .472 .503a
Residual 41.175 15 2.745
Total 42.471 16
a. Predictors:(Constant),BMI
b. DependentVariable:AGE AT MENARCHE
TABLE 4.7.4.2-d; Coefficientsa
Model
Unstandardized Coefficients
Standardized
Coefficients
t Sig.B Std. Error Beta
1 (Constant) 18.987 8.983 2.114 .052
BMI -.269 .391 -.175 -.687 .503
a. DependentVariable:AGE AT MENARCHE
76. 76
4.7.5 FOR LOW NORMAL
4.7.5.1 Correlations
TABLE 4.7.5.1-a; Descriptive Statistics
Mean Std. Deviation N
age 15.5405 .90045 37
BMI 19.6675 .88510 37
AGE AT MENARCHE 13.5405 1.01638 37
TABLE 4.7.5.1-b; Correlations
age BMI
AGE AT
MENARCHE
age Pearson Correlation 1 .264 .218
Sig. (2-tailed) .115 .194
N 37 37 37
BMI Pearson Correlation .264 1 -.323
Sig. (2-tailed) .115 .051
N 37 37 37
AGE AT MENARCHE Pearson Correlation .218 -.323 1
Sig. (2-tailed) .194 .051
N 37 37 37
4.7.5.2 Regression
TABLE 4.7.5.2-a; Variables Entered/Removedb
Model
Variables
Entered
Variables
Removed Method
1 BMIa
. Enter
a. All requested variables entered.
b. DependentVariable:AGE AT MENARCHE
TABLE 4.7.5.2-b; Model Summary
Model R R Square
Adjusted R
Square
Std. Error of the
Estimate
1 .323a
.104 .078 .97568
a. Predictors:(Constant),BMI
77. 77
TABLE 4.7.5.2-c; ANOVAb
Model Sum of Squares df Mean Square F Sig.
1 Regression 3.871 1 3.871 4.066 .051a
Residual 33.319 35 .952
Total 37.189 36
a. Predictors:(Constant),BMI
b. DependentVariable:AGE AT MENARCHE
TABLE 4.7.5.2-d; Coefficientsa
Model
Unstandardized Coefficients
Standardized
Coefficients
t Sig.
95.0% Confidence Interval for B
B Std. Error Beta Lower Bound Upper Bound
1(Constant) 20.827 3.617 5.758 .000 13.484 28.169
BMI -.370 .184 -.323 -2.016 .051 -.743 .003
a. DependentVariable:AGE AT MENARCHE
Figure 34
79. 79
CHAPTER FIVE
DISCUSSION, SUMMARY, CONCLUSION AND
RECOMMENDATION.
5.1 DISCUSSION AND SUMMARY
The findings from this research show that total Body
mass index has a negative correlation with age at
menarche, but it is not enough to be used as a standard
in this study population; hence it is not statistically
significant. But interestingly the findings from this
research show that normal Body mass index has a
negative correlation with age at menarche P<0.01, and it
was enough to be used as a standard in this study
population, hence it is statistically significant.
Amongst other things, the study showed statistically
significant correlations between age and hip
circumference, BMI and hip circumference, BMI and waist
circumference, BMI and MAP, MAP and hip
circumference, MAP and waist circumference, SBP and
hip circumference, SBP and waist circumference, DBP
80. 80
and hip circumference, DBP and waist circumference,
DBP and BMI all at a P value less than 0.05.
5.2 CONCLUSION
Though the findings showed no statistical
significance in the relationship between BMI and age at
menarche, one cannot ignore the relevance of fat
distribution, body adiposity, in determining the age at
menarche as there was statistical significance in the
relationship between the normal BMI and age at
menarche.
5.3 RECOMMENDATIONS
Based on the findings of this research, it is
recommended that further studies be done to determine
other factors affecting age at menarche and also to
confirm known factors that affect age at menarche. It is
also recommend that BMI of young girls be monitored so
as not set off an early age at menarche.
81. 81
REFERENCES
Anderson S. E., Dallal G. E., Must A. (2003): Relative
weight and race influence average age at menarche:
results from two nationally representative surveys of US
girls studied under 25 years apart. Pediatrics 111 (4 part
1): 844-850/pediatrics.111.4.PMID. 12671122.
Billewicz W. Z., Fellowes H. M., Hytten C. A., (1976):
Comments on the critical mass and the age of menarche.
Annals Human Biology 3:51-59.
Butler L. M., Potischman N. A., Newman B., Millikan
R. C., Brogan D., Gammon M. D., Swanson C. A.,
Brinton L. A., (2000): Menstrual risks favours and early-
onset breast cancer. Cancer Causes control. 11(5): 451-8.
Cooper G. E., Phross S., Weinberg C., Baird D. W.,
Helan E., and Sandler D., (1998): Menstrual and
reproductive risk factors for ishaemic heart disease.
Epidemiology,10, 225- 259.
Cooper C., Kuh D., Egger P., Wadsworth M., and
Barker D., (1996): Childhood age and age at menarche
British Journal of Obstetrics and Gynaecology, 103,814-1.
82. 82
Douglas J., (1996): The age of rearching puberty: some
associated factors and some educational implications.
Scienti (R) c Basis of Medicine Annual Reviews, 66,91-
105.
Elizondo S. (1992): Age at menarche: Its relation to
linear and ponderal growth. Ann Hum Biol 19: 197-199.
Ellison P. T., (1982): Skeletal growth, fatness, and
menarcheal age: a comparison of two hypothesis. Hum
Biol 54: 269-281
Forbes G. B., (1992): Body size and composition of
premenarcheal girls. American Journal Dis Child 146:63-
66.
Fredriks A. M., Van Buuren S., Fekkes M., Verloove-
Vanhorick S. P., Wit J. M. (2005): Are references for
waist circumference, hip circumference and waist hip
ratio in Dutch children useful in Clinical practice?
European Journal of Pediatrics 164:216-222.
Frisch R. E., (1994): The right weight: body fat,
menarche and fertility. Proc Nutritional Society 53:113-
129.
83. 83
Frisch R. E., (1994): Menstrual cycle. fatness as a
determinant of minimum weight for height necessary for
their maintenance or onset. Science 185:949-951.
Frisch R. E., (1976): Fatness of girl menarche to age 18
years, with a nomogram. Hum Biol 48: 353-359.
Frisch R. E., Gotz Welbergen A. V., Mcarthur J. W.,
Albright T., Witscht J., Bullen B., Birnholz J., Reed
R.B., Hermann H. (1981): Delayed menarche and
amenorrhea of college athletes in relation to age of onset
of training. J Am Med Asso 246: 1559-1563.
Frisch R.E., Revelle R. (1970): Height and weight at
menarche and a hypothesis of critical body weight and
adolescents events. Science 169: 397-399.
Frisch R. E., Reville R., Cook S. (1973): Components of
weight at menarche and the initiation of adolescent
growth spurt in girls: estimated total water, lean body
weight and fat. Hum Biol 45: 469-483.
Frisch R. E., Wyshak G, Vincent L (1980): Delayed
menarche and amenorrhea in ballet dancers. New
England Medical Journal 303: 17-19.
84. 84
Fujii K. (2000): Verification for delayed menarche in
female sports athletes. Report by the Ministry of
Education , Science Sports And Culture and by a Grant-in
Aid for Scientific Research (C) (2) No.11680060 from 1999
to 2000. 1-107.
Fujii K., Yamamoto Y. (1995): The analysis of the growth
velocity curve in height based upon the maturity age. Jpn
J Phys Fitness Sports Med 44: 431-438.
Garn S., LA Velle M., Rosenberg, K., and H. Awthorne
V., (1986): Maturational timing as a factor in female
fatness and obesity. American Journal of Clinical
Nutrition, 43, 879-883.
Garrow J. S., Webster J. (1985): Quetelet’s index(W/H2)
as a measure of fatness. Int J Obes 9: 147-153.
Glynn R. J., Christen W. G., Manson J. E., et al.
(1995): Body mass index; An independent predictor of
cataract. Arch Ophthalmol 113: 1131-1137.
Gluckman P. D., Hanson M. A. (2006): Evolution,
development and timing of puberty. Trends endocrine
Metabolism 17: 7-12.
85. 85
Hernandez M. I., Unanue N., Gaete X., Cassorla F.,
Codner E. (2007): Age of menarche and its relationship
with body mass index and socioeconomic status. Rev Med
Chil 2007, 135: 1429-1436.
Johnston F. E., Malina R. M., Galbraith M. A., (1971):
Height weight and age of menarche and the "critical
weight" hypothesis. Science 174:1148-1149.
Johnston F. E., Malina R. M., Galbraith M. A., (1971):
Height, weight, age at menarche and the “Critical weight”
hypothesis. Science 174: 1148.
Johnston F. E., Roche A. F., Schell L. M., Wettenhall
N. B., (1975): Critical weight at menarche: Critique of a
hypothesis. American Journal of Dis. Child 129: 19-23.
Kaplowitz P. B. (2008): Link between body fat and the
timing of puberty. Pediatrics 2008, 121(Suppl 3): S206-
S217.
Komiya S., Eto C., Otogi K., Teramoto K., Shimizu F.,
Shimamoto H. (2000): Gender differences in body fat of
low-high-body-mass children: Relationship with body
mass index. European Journal of Applied Physiology 82:
16-23.
86. 86
Magnusson, T. E. (1978): “Age at menarche in iceland”.
American journal of physical anthropology 48 (4): 511-
514.DOI:10.1002/ajpa.1330480410.ISSN00029483.PMID
655271.
McArthur J. W., (1974): Menstrual cycle, fatness as a
determinant of minimum weight for height necessary for
their maintenance or onset. Science 185:949-951.
Matkovich V., IIich J. Z., Skugor M., Badenhop N. E.,
Goel P., Clairmont A., Klisovic D., Mahhas R.W.,
Landoll J. D. (1997): Leptin is inversely related to age at
menarche in human females. J Chin Endocrine
Metabolism 82:3239-3245.
Merzenich H., Boeing H., Wahrendorf J. (1993): Dietary
fat and sports activity as determinants for age at
menarche. Am J Epidemiol 138:217-224.
Parent A. S., Rasier G., Gerard A., Heger S., Roth C.,
Mastronardi C., et al (2005): Early onset of puberty:
tracking generic and environmental factors.
Roberts, D., and Dann, T.,(1975): A 12year study of
menarcheal age. British Journal of Preventive and Social
Medicine,29, 31-39.
87. 87
Shangold M., Kelly, Berkerley A., Freedman, K., and
Groshen S., (1989): Relationship between menarcheal
age and adult height. Southern Medical Journal, 82,443-
445.
Sharma, K., Talwar,I., and Sharma , N., (1988): Age at
menarche in relation to body size and physique. Annals of
Human Biology, 15, 431-434.
Simmons K., Greulich W.(1943): Menarcheal age and
the height, weight and skeletal age of girls aged 7 to 17
years. J Pediatr 22: 518-548.
Stark O., Peckham C. S., Moynihan C. (1989): Weight
and age at menarche at menarche. Arch Dis Child 64:
383-387.
Thomas F., Renaud F., Benefiee E., De Meeus T.,
Gluegan J. F. (2001): International variability of ages at
menarche and menopause. patterns and determinants.
Hum Biology 73: 271-290.
Vant's Hof M. A., Roede M. J. (1977): A Monte Carlo
test of weight as a critical factor in menarche, compared
with bone age and measures of height, width, and sexual
development. Annals of Human Biology 4: 581-585.
88. 88
Wyshak, G., and Frisch, R., (1982): Evidence for secular
trend in age at menarche. New England Journal of
Medicine, 306, 1033-1035.
X. Du, H. Greenfield, D. R. Fraser, K. Ge, W. Zheng, L.
Huang, Z. Liu (2003): “Low body weight and its
association with bone health and pubertal maturation in
Chinese girls”. European Journal of Clinical Nutrition 57,
693-700. DOI: 10.1038/sj.ejcn.1601599.
89. 89
APPENDIX ONE
QUESTIONNAIRE
Dear respondents,
Your cooperation is being solicited in the filling of
this questionnaire, with the assurance that all
information provided within are confidential and strictly
for medical research and shall be treated accordingly.
Please tick (√ ) in the box your answers, and skip sectionD
SECTION A
Biodata
(1) Age…………….
(2) Gender:Female ( )
(3) Educational Status:SS1 ( ),SS2 ( ),SS3 ( )
(4) Ethnicity:Ishan( ),Benin( ), Hausa ( ),Yoruba ( ), others(specify)………..
(5) Parent’soccupation:Father……………….
Mother………………..
(6) What type of house do youlive in?Single Room( ),Self Contained( ),Flat( ),
Duplex ( ),Mansion( ).
90. 90
SECTION B
Level of activity
(7) Means of commuting:Onfootmost times( )
Publictransportmosttimes( )
Personal car- Type of car ( )…………………………..
Droppedoff ( )
(8) Do youinvolve inanytype of sportingactivity(Exercise),Yes( ) No( )
If yes,specify………………………………………………….
(9) How oftendoyouexercise?Daily( )
Bi weekly( )
Weekly( )
Monthly( )
SECTION C
Nutritional Data
(10) Howmany timesdoyoueat a day on the average?
Once ( ),Twice ( ), Thrice ( ),More than three times( ), Notregularly( )
(11) What Fooddo youeat mostfrequently(STAPLE)?...........................
Isit your preferreddiet?.................
(12) Are youon a dietor any weightmodulator?Yes( ),No ( ).
If Yes, whattype?......................
(13) Howoftendo yougo to a foodoutlettoeat?
Daily( ), Once a week( ),Twice a week( ), Weekly( ),Monthly( )
91. 91
(14) Can youlistthe typesof foodyouwill like toeatif takento such an outlet
……………………………………………………
……………………………………………………
……………………………………………………
(15) Do youtake alcohol?Yes( ), No( )
(16) Doesanymemberof your familyhave hypertension?Yes( ),No( ), Don’t
Know( )
(17) Isany memberof yourfamilyobese?Yes( ),No ( ),Don’t Know ( )
SECTION D
Anthropometry/Bloodpressure
(18) Weight………….…Kg
(19) Height……………..m
(20) BMI………………..
(21) Bloodpressure (a) Systolic……………(b) Diastolic………………(c) MAP
(22) Waistcircumference……………………cm
(23) Hipcircumference…………………cm
(24) Hip/Waistratio…………………..
92. 92
SECTION E
General
(25) Do youknowyour bloodgroup?Yes( ) No( )
If yes,indicate type……………….
(26) Do youknowyour Genotype?Yes( ) No( )
If yes,indicate type……………….
(27) Atwhat age didyou experience yourfirstmenstrualperiod?...................yrs
(28) Are yousexuallyactive?Yes( ),No( ).
(29) Do youuse protection?Yes( ),No ( ).
(30) Do youuse pills?Yes( ), No( ).
(31) Do youknowaboutHIV/AIDs?Yes( ),No ( ).
(32) What causesHIV/AIDs?.......................................................
(33) Can HIV/AIDSbe cured?.........................................
(34) Howcan HIV/AIDsbe contracted?.......................................
(35) Howcan HIV/AIDsbe prevented?........................................