Download as PDF, PPTX


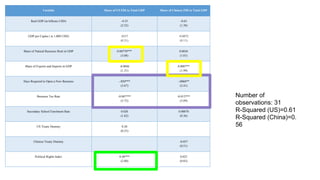
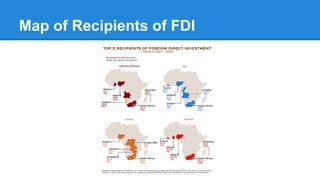
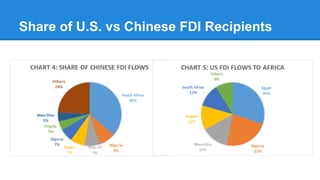
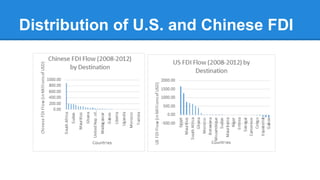
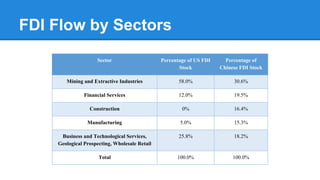
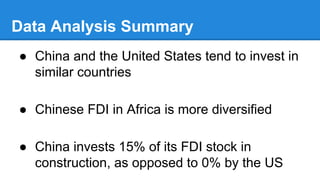


This document analyzes Chinese and American foreign direct investment (FDI) in Africa. It finds that both countries invest most in mining and extractive industries, but Chinese FDI is more diversified, including 15% in construction. Business tax rates and ease of doing business are significant determinants for both countries, though US investment is more sensitive. US FDI correlates with natural resources and better human rights records, while Chinese FDI correlates with trade openness. Overall, the study finds similarities and differences in the motivations and patterns of Chinese and American FDI in Africa.


