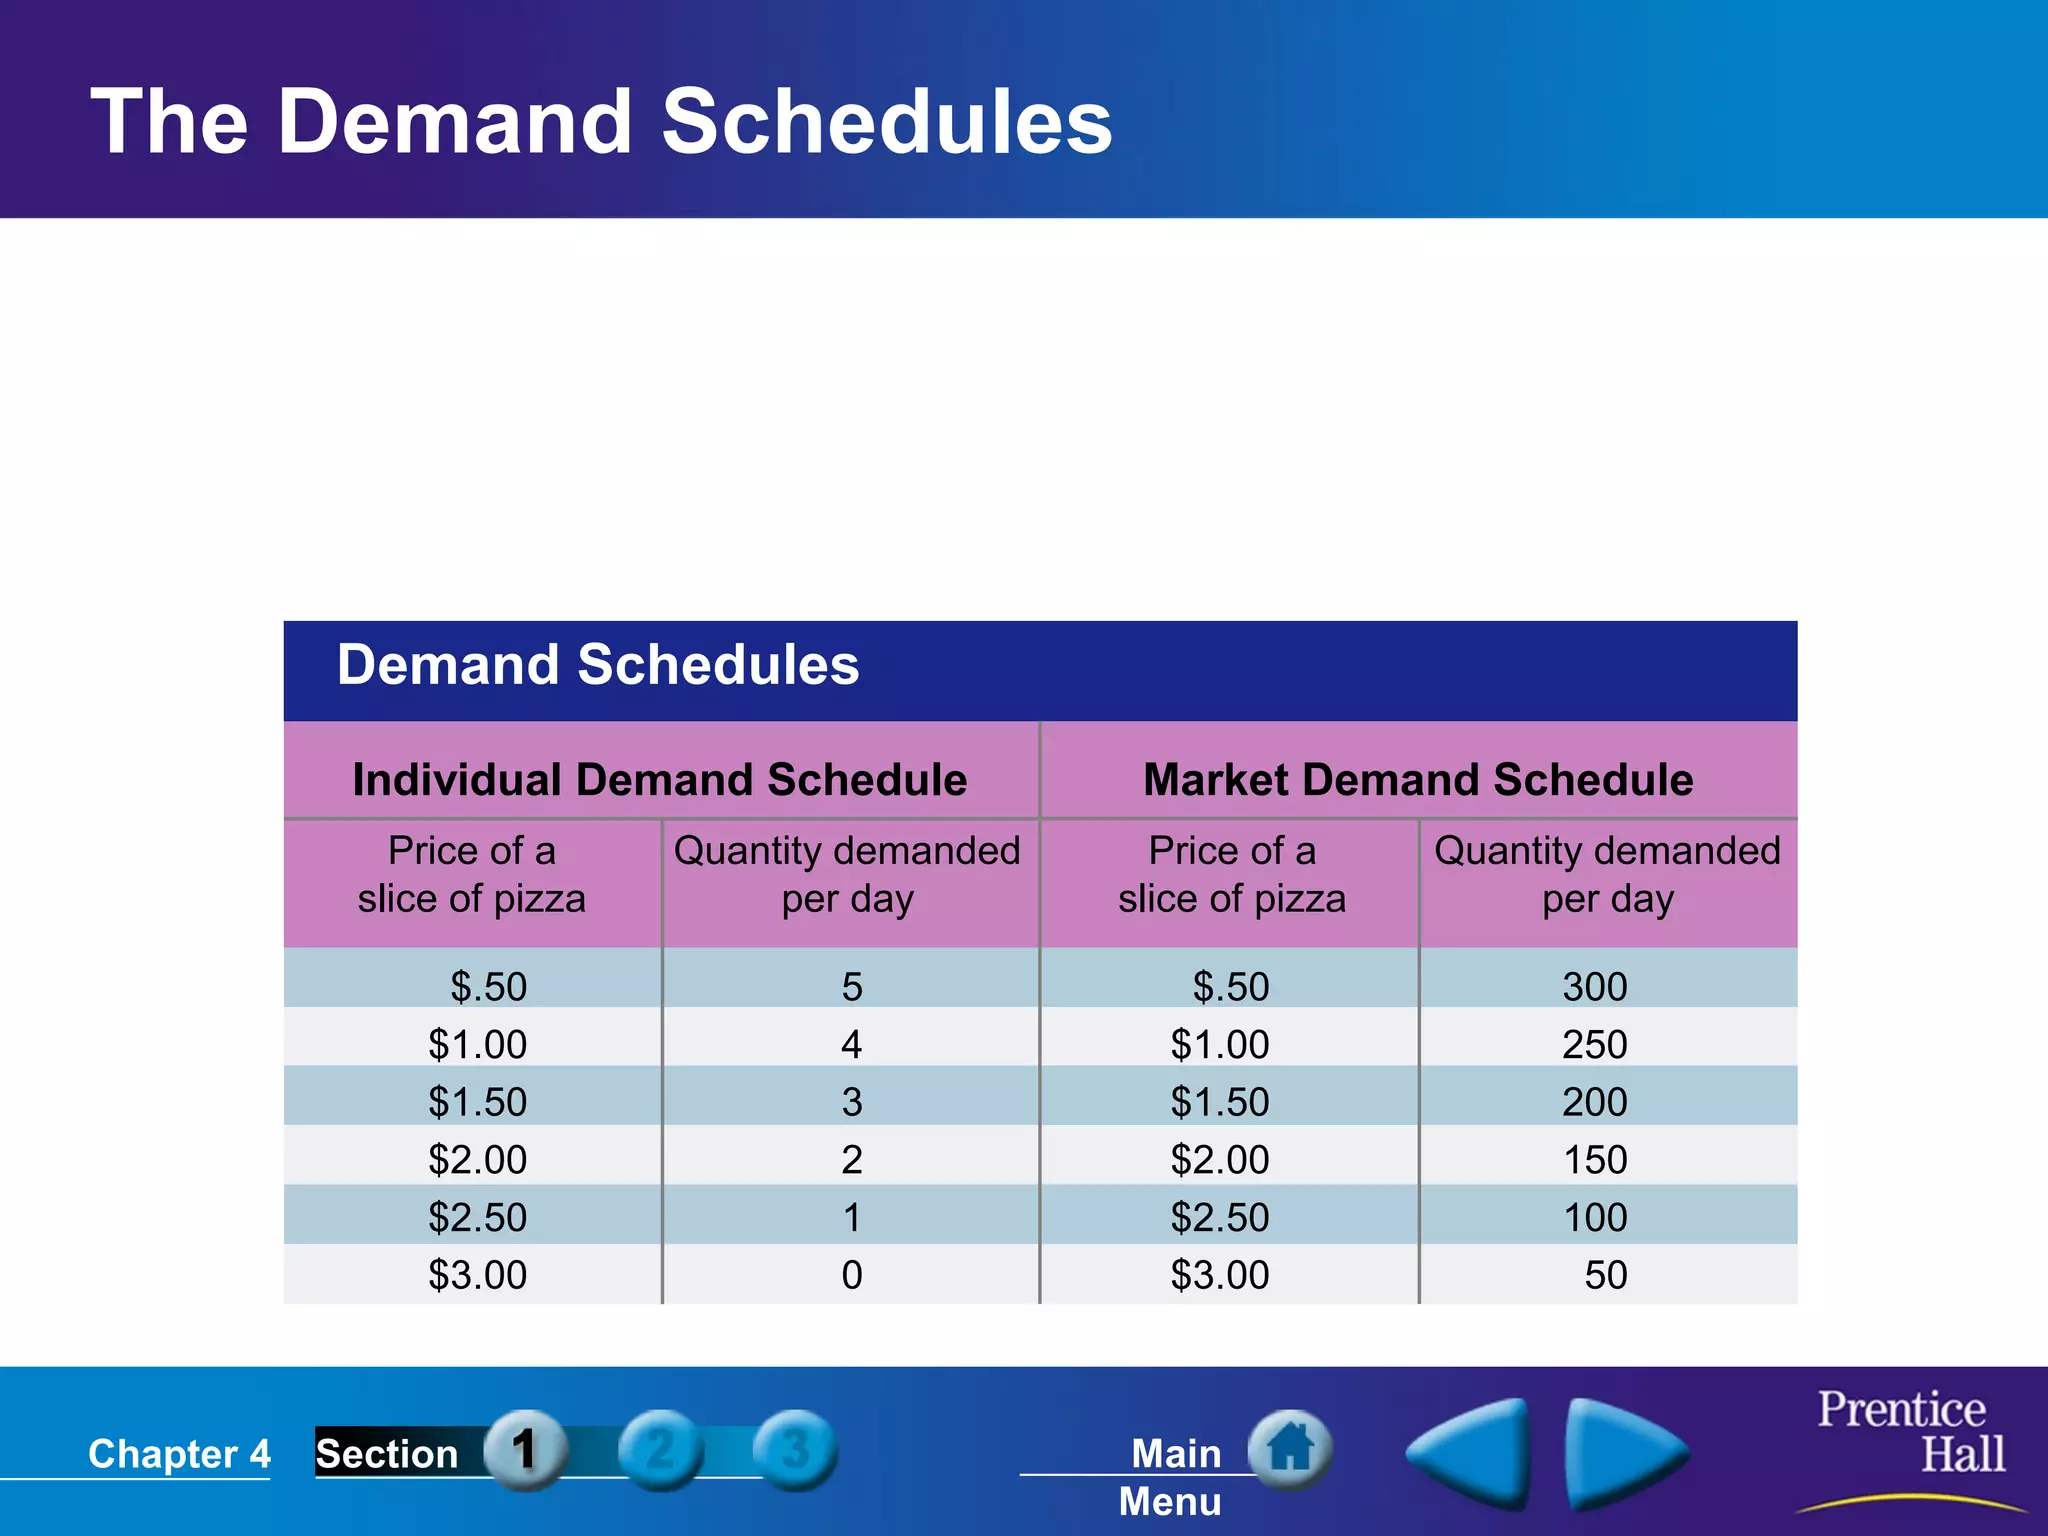
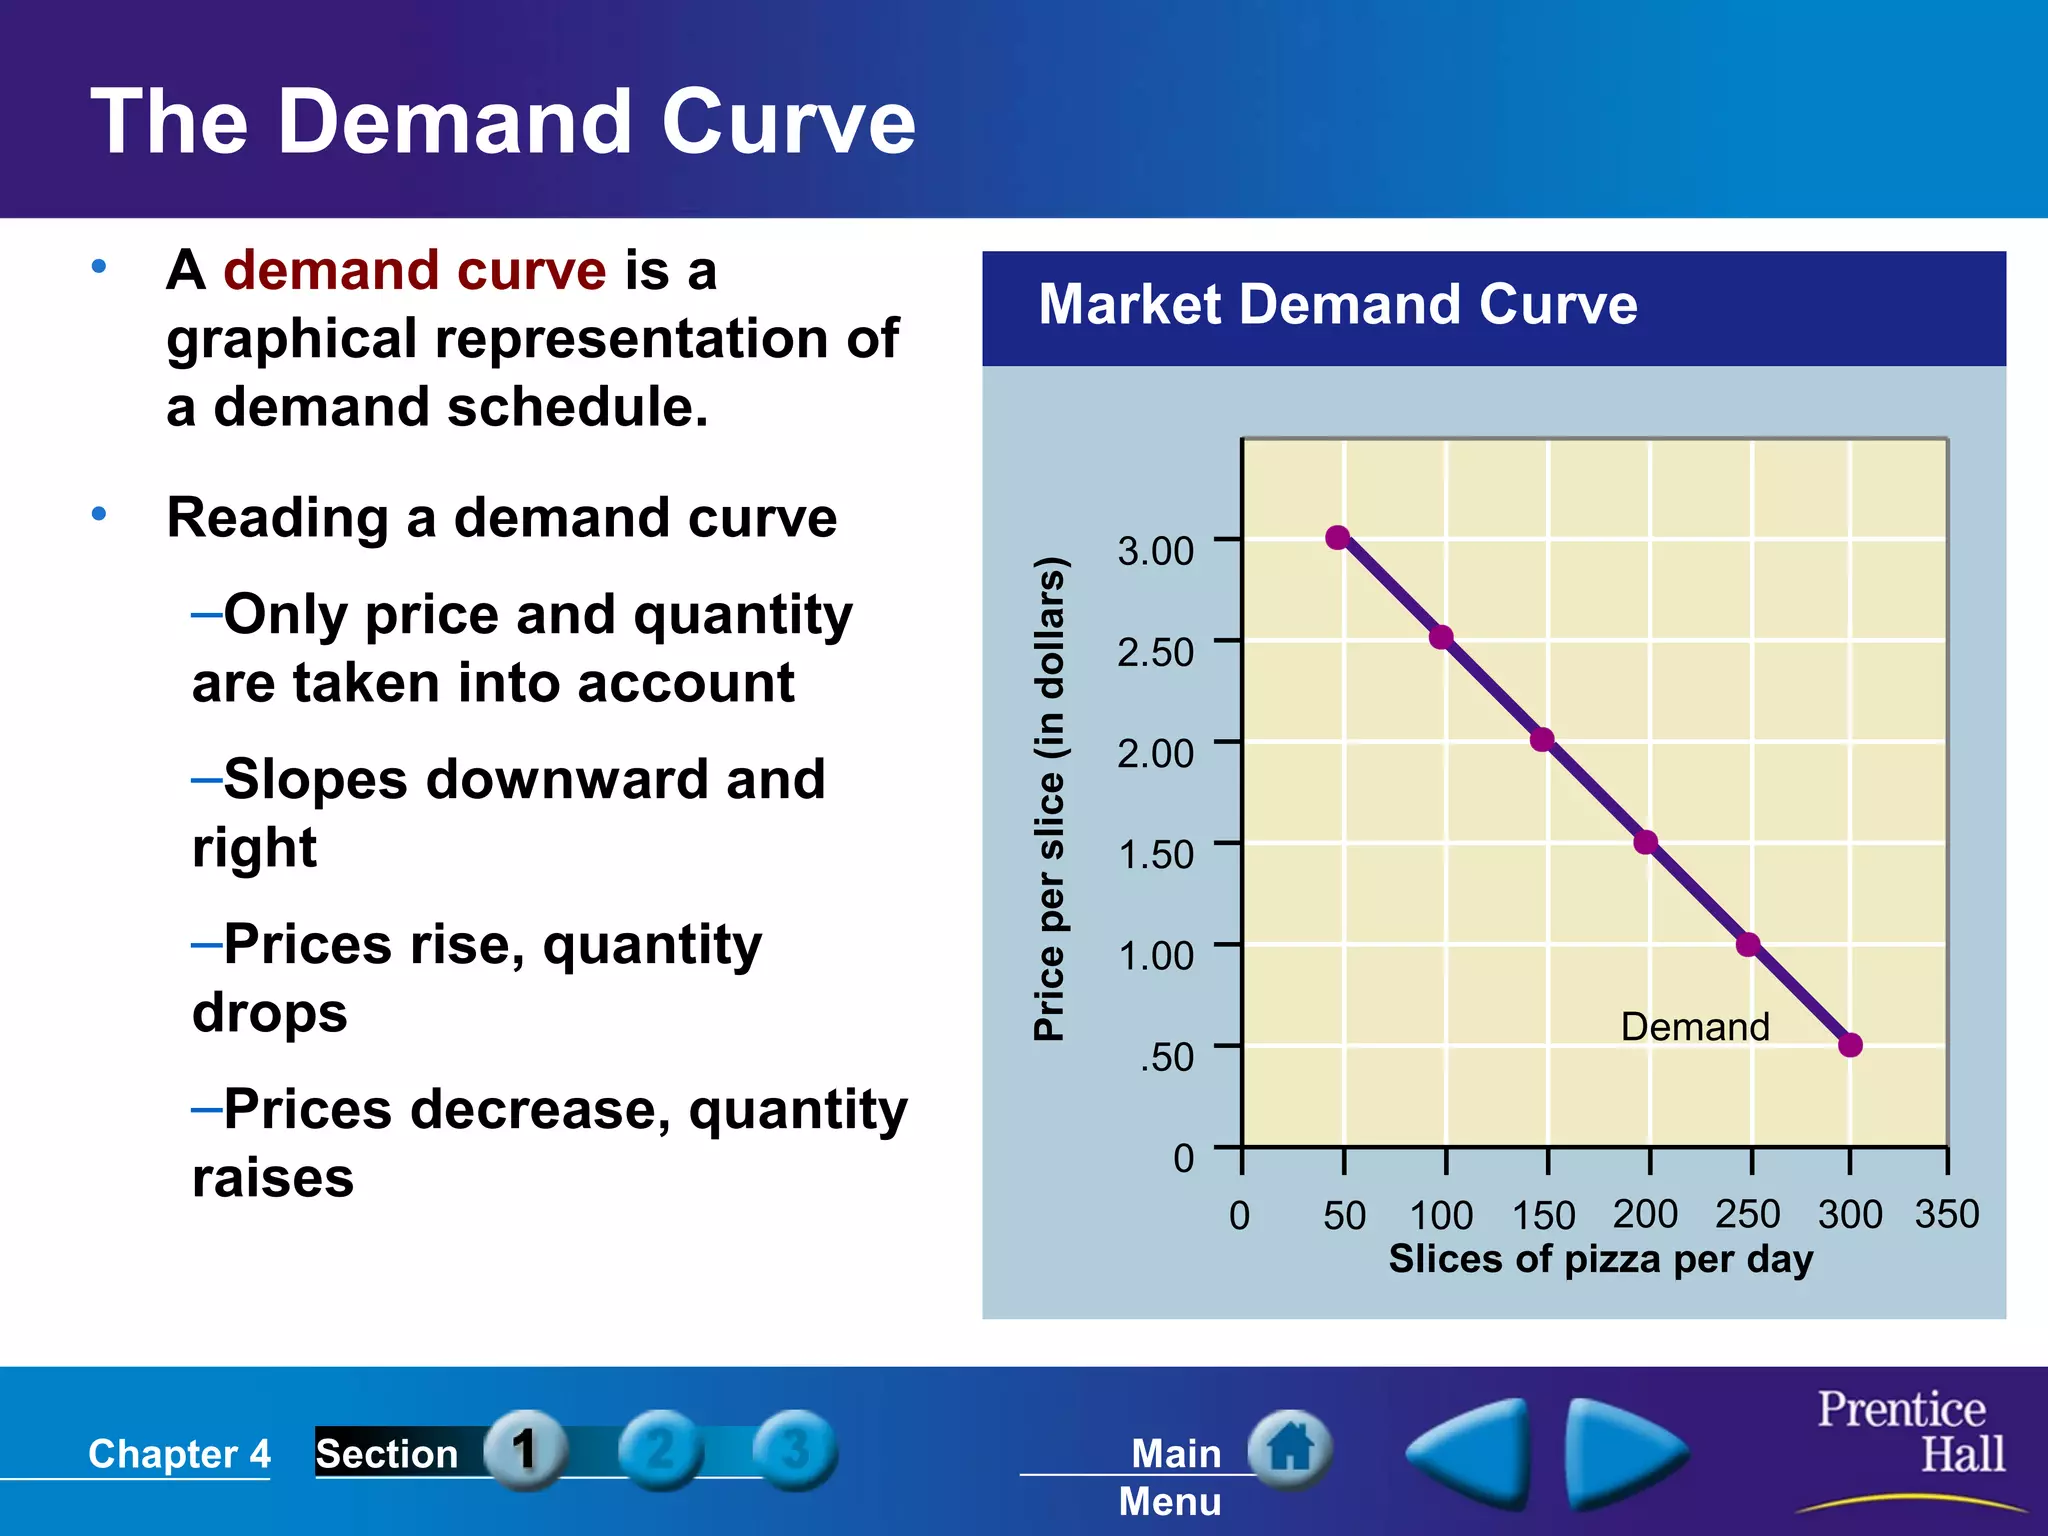
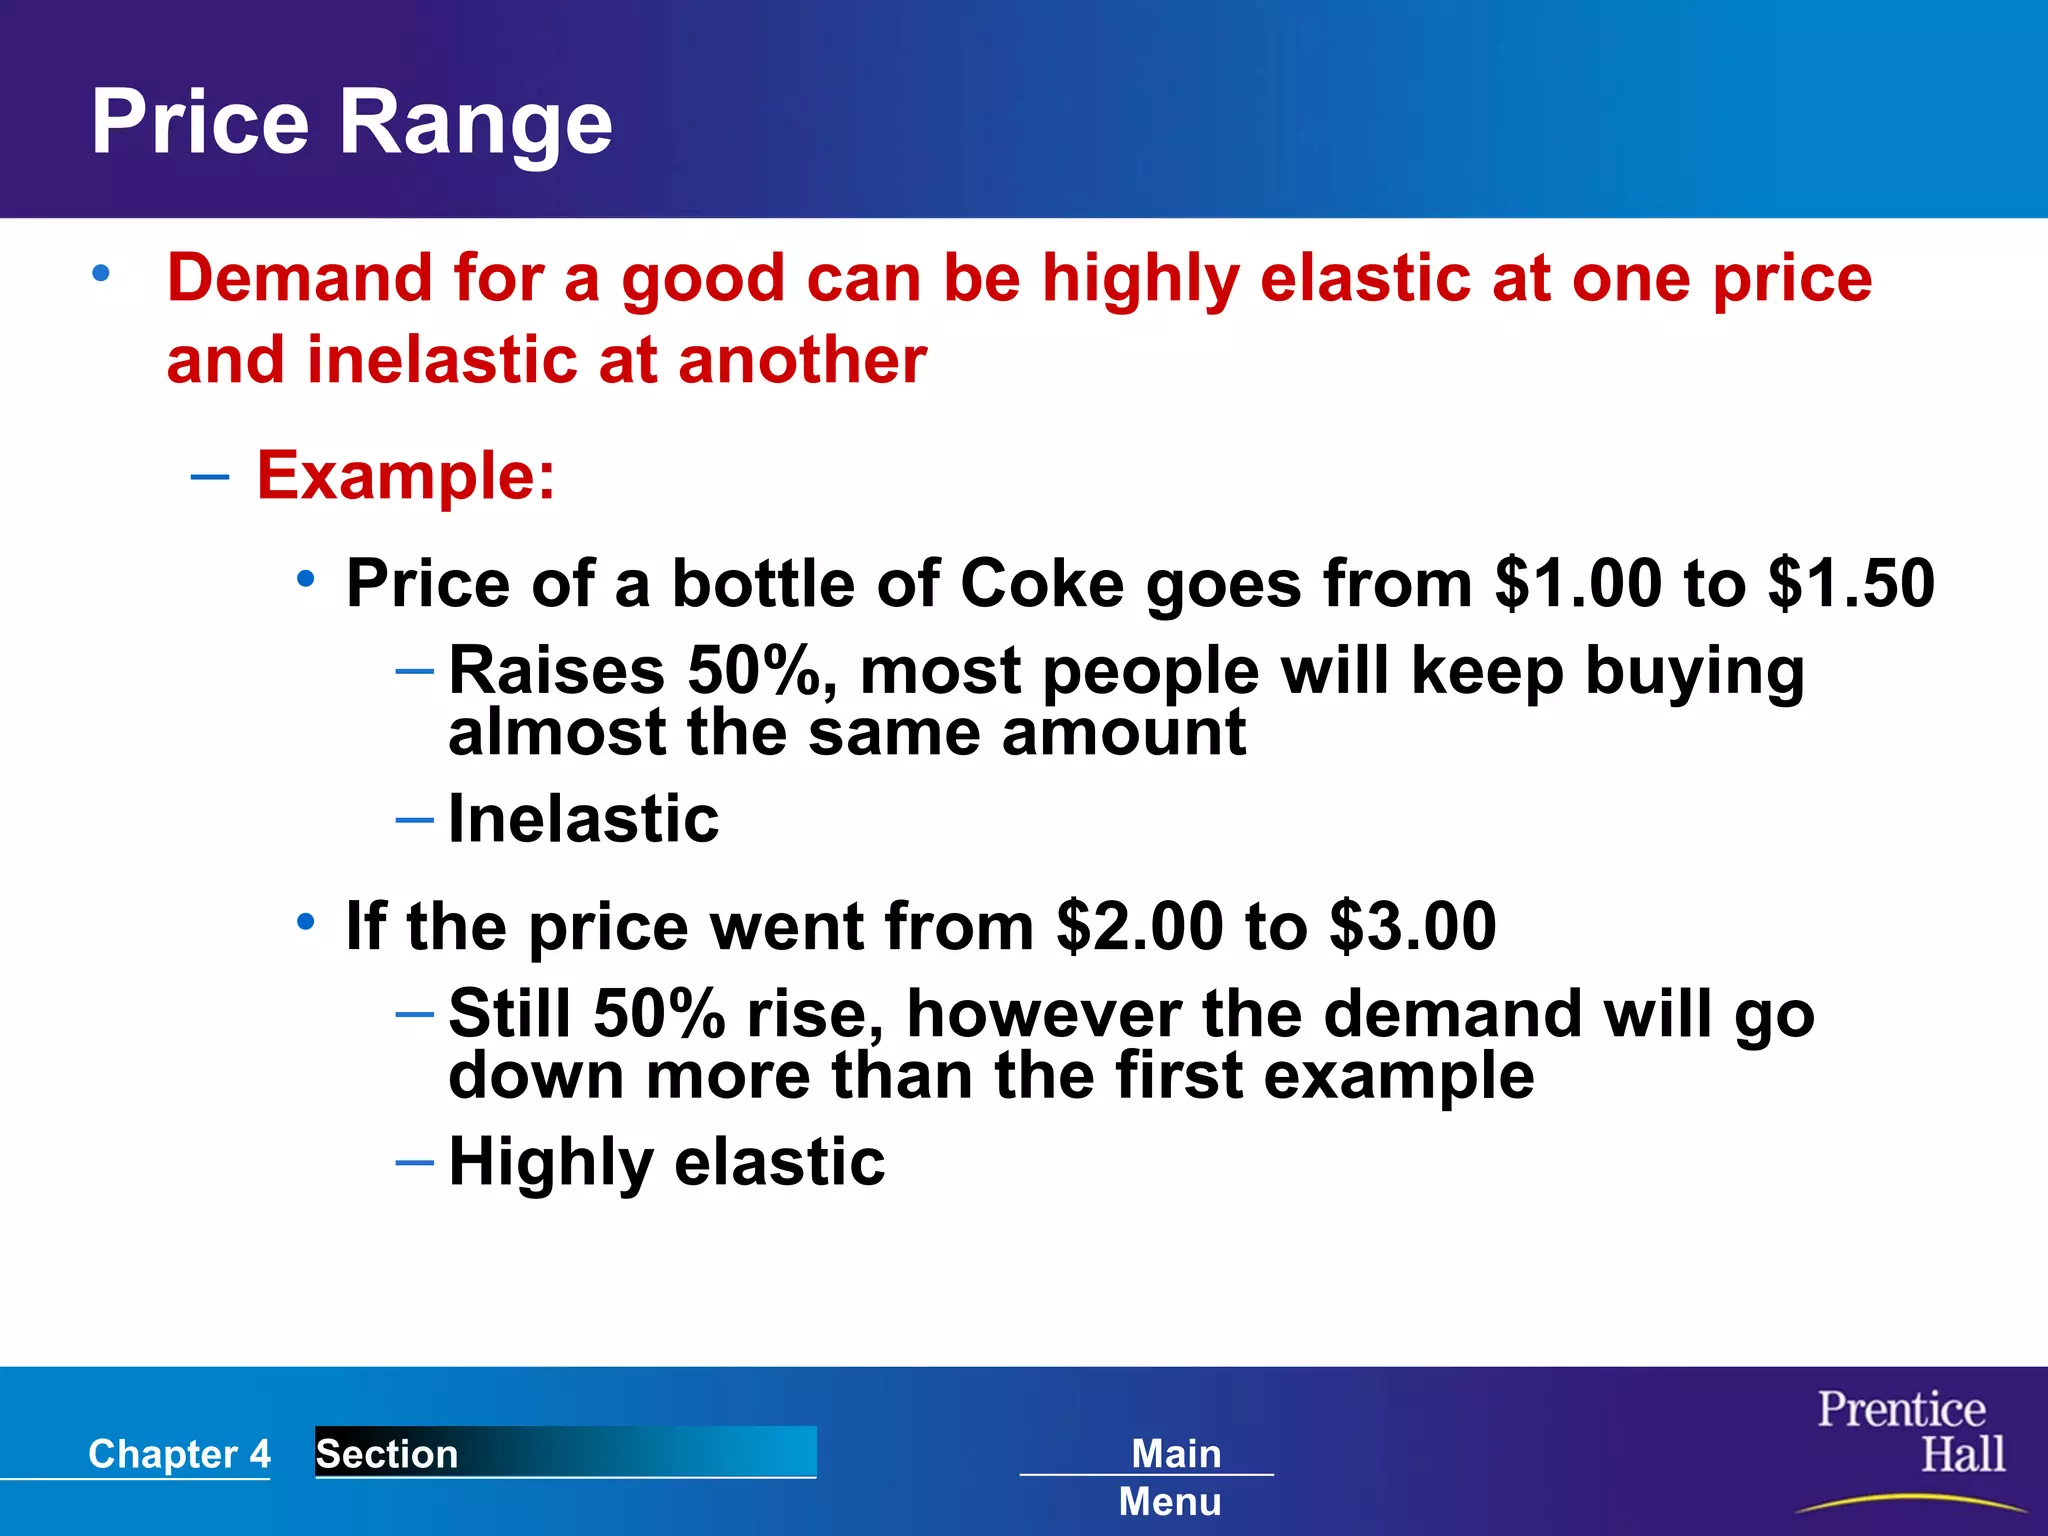
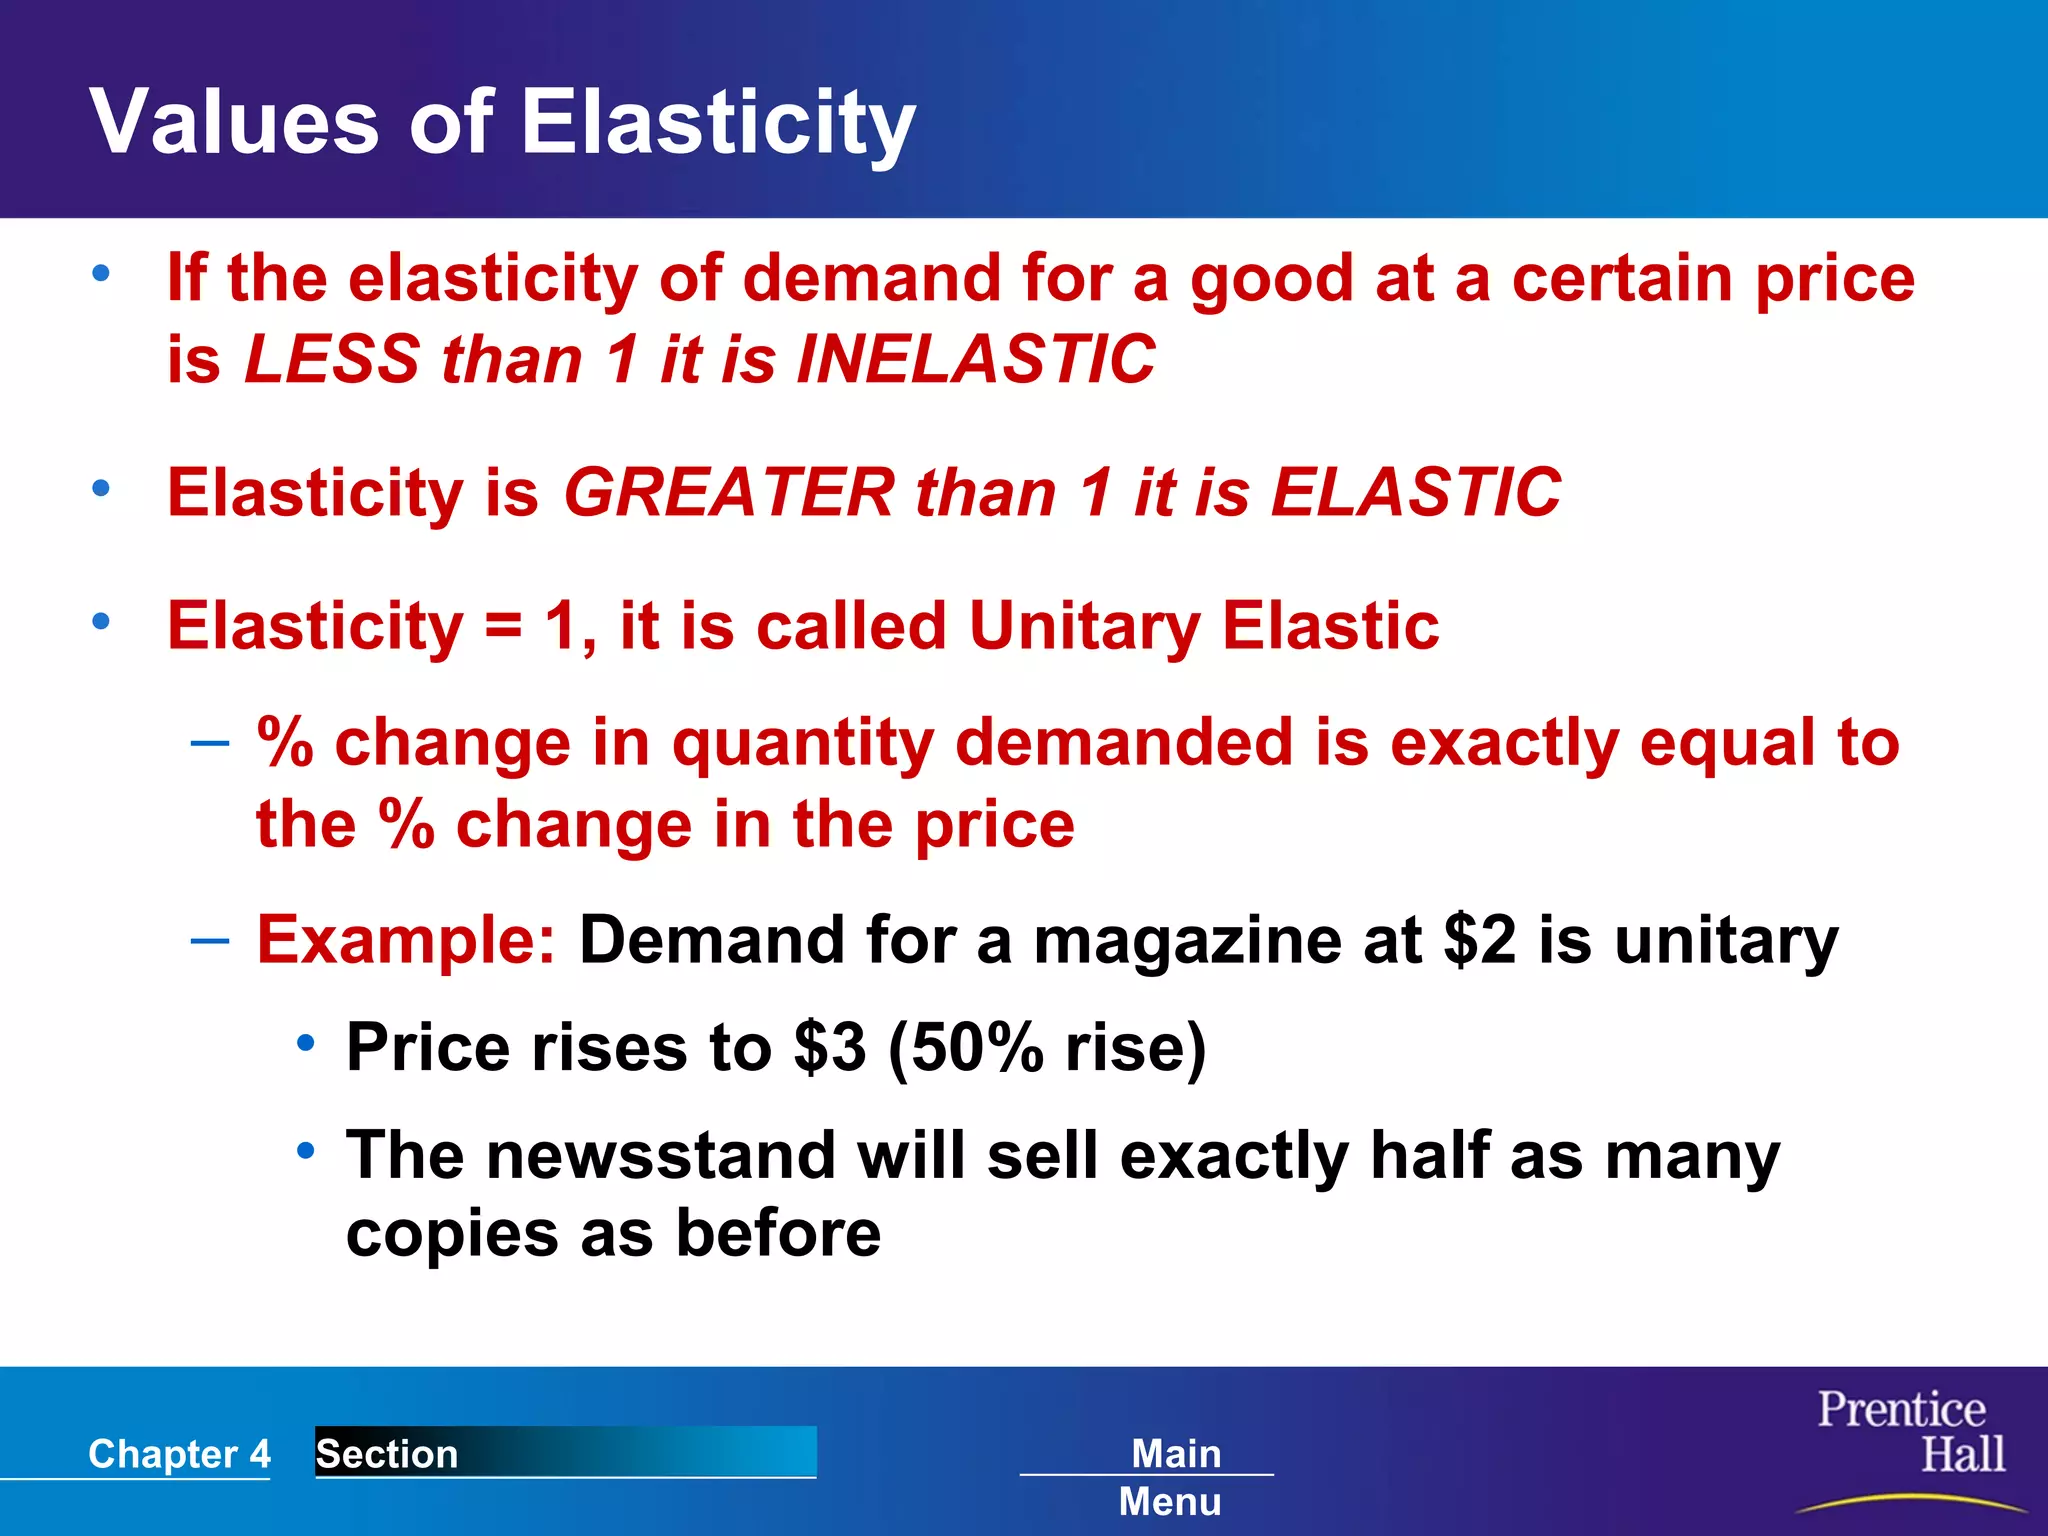
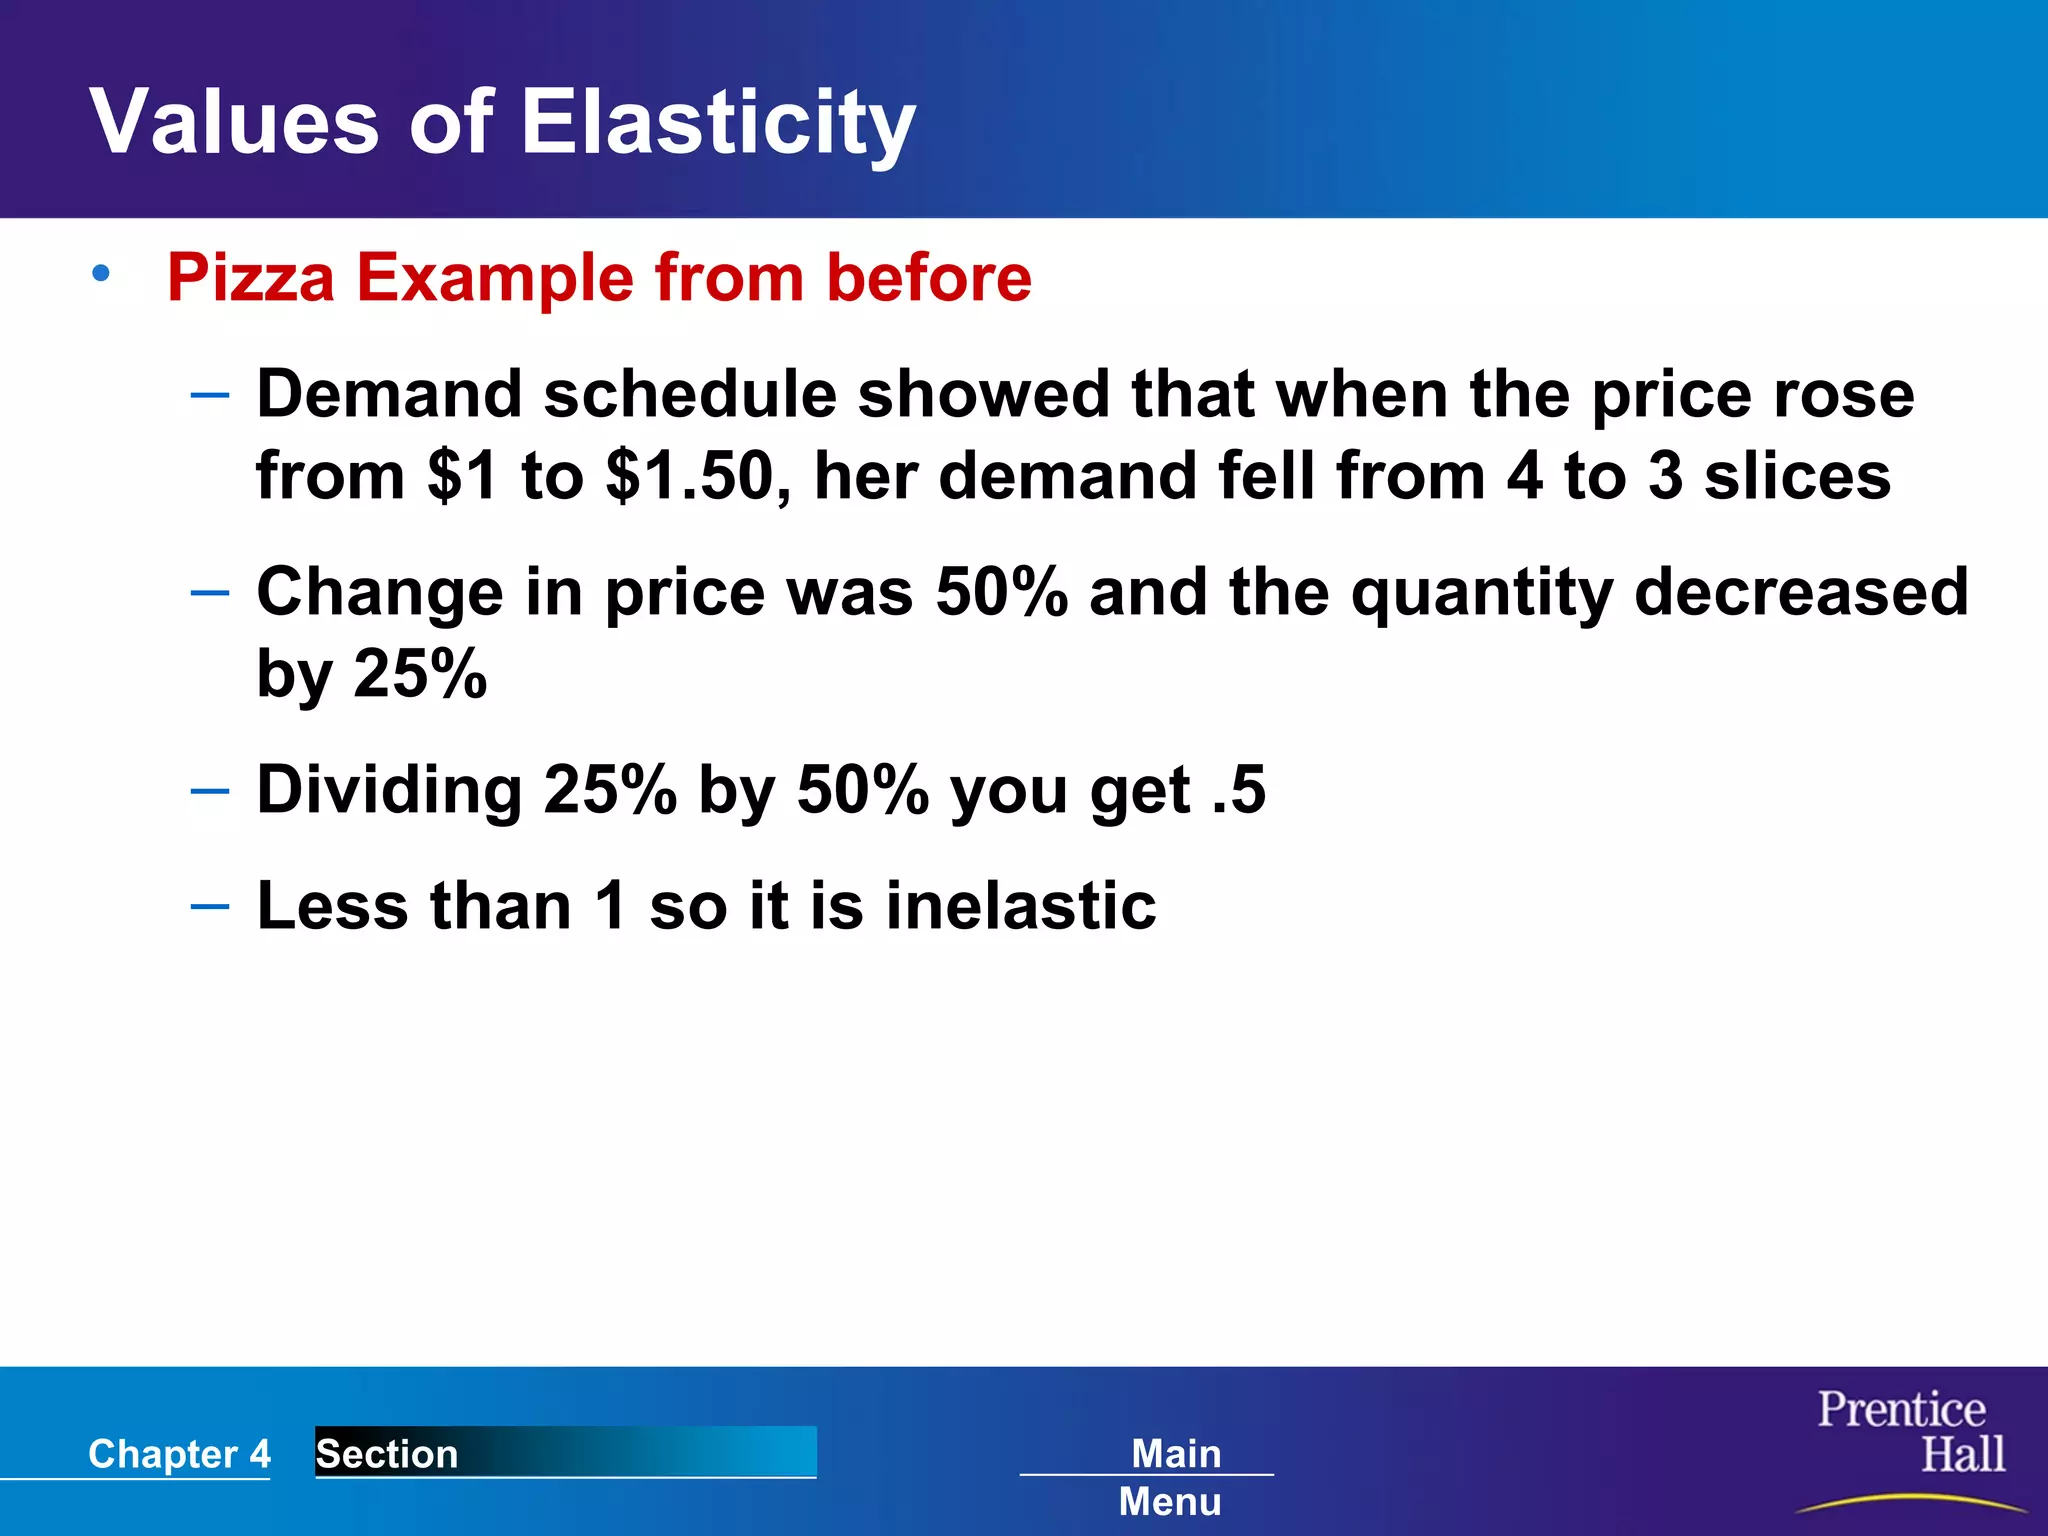
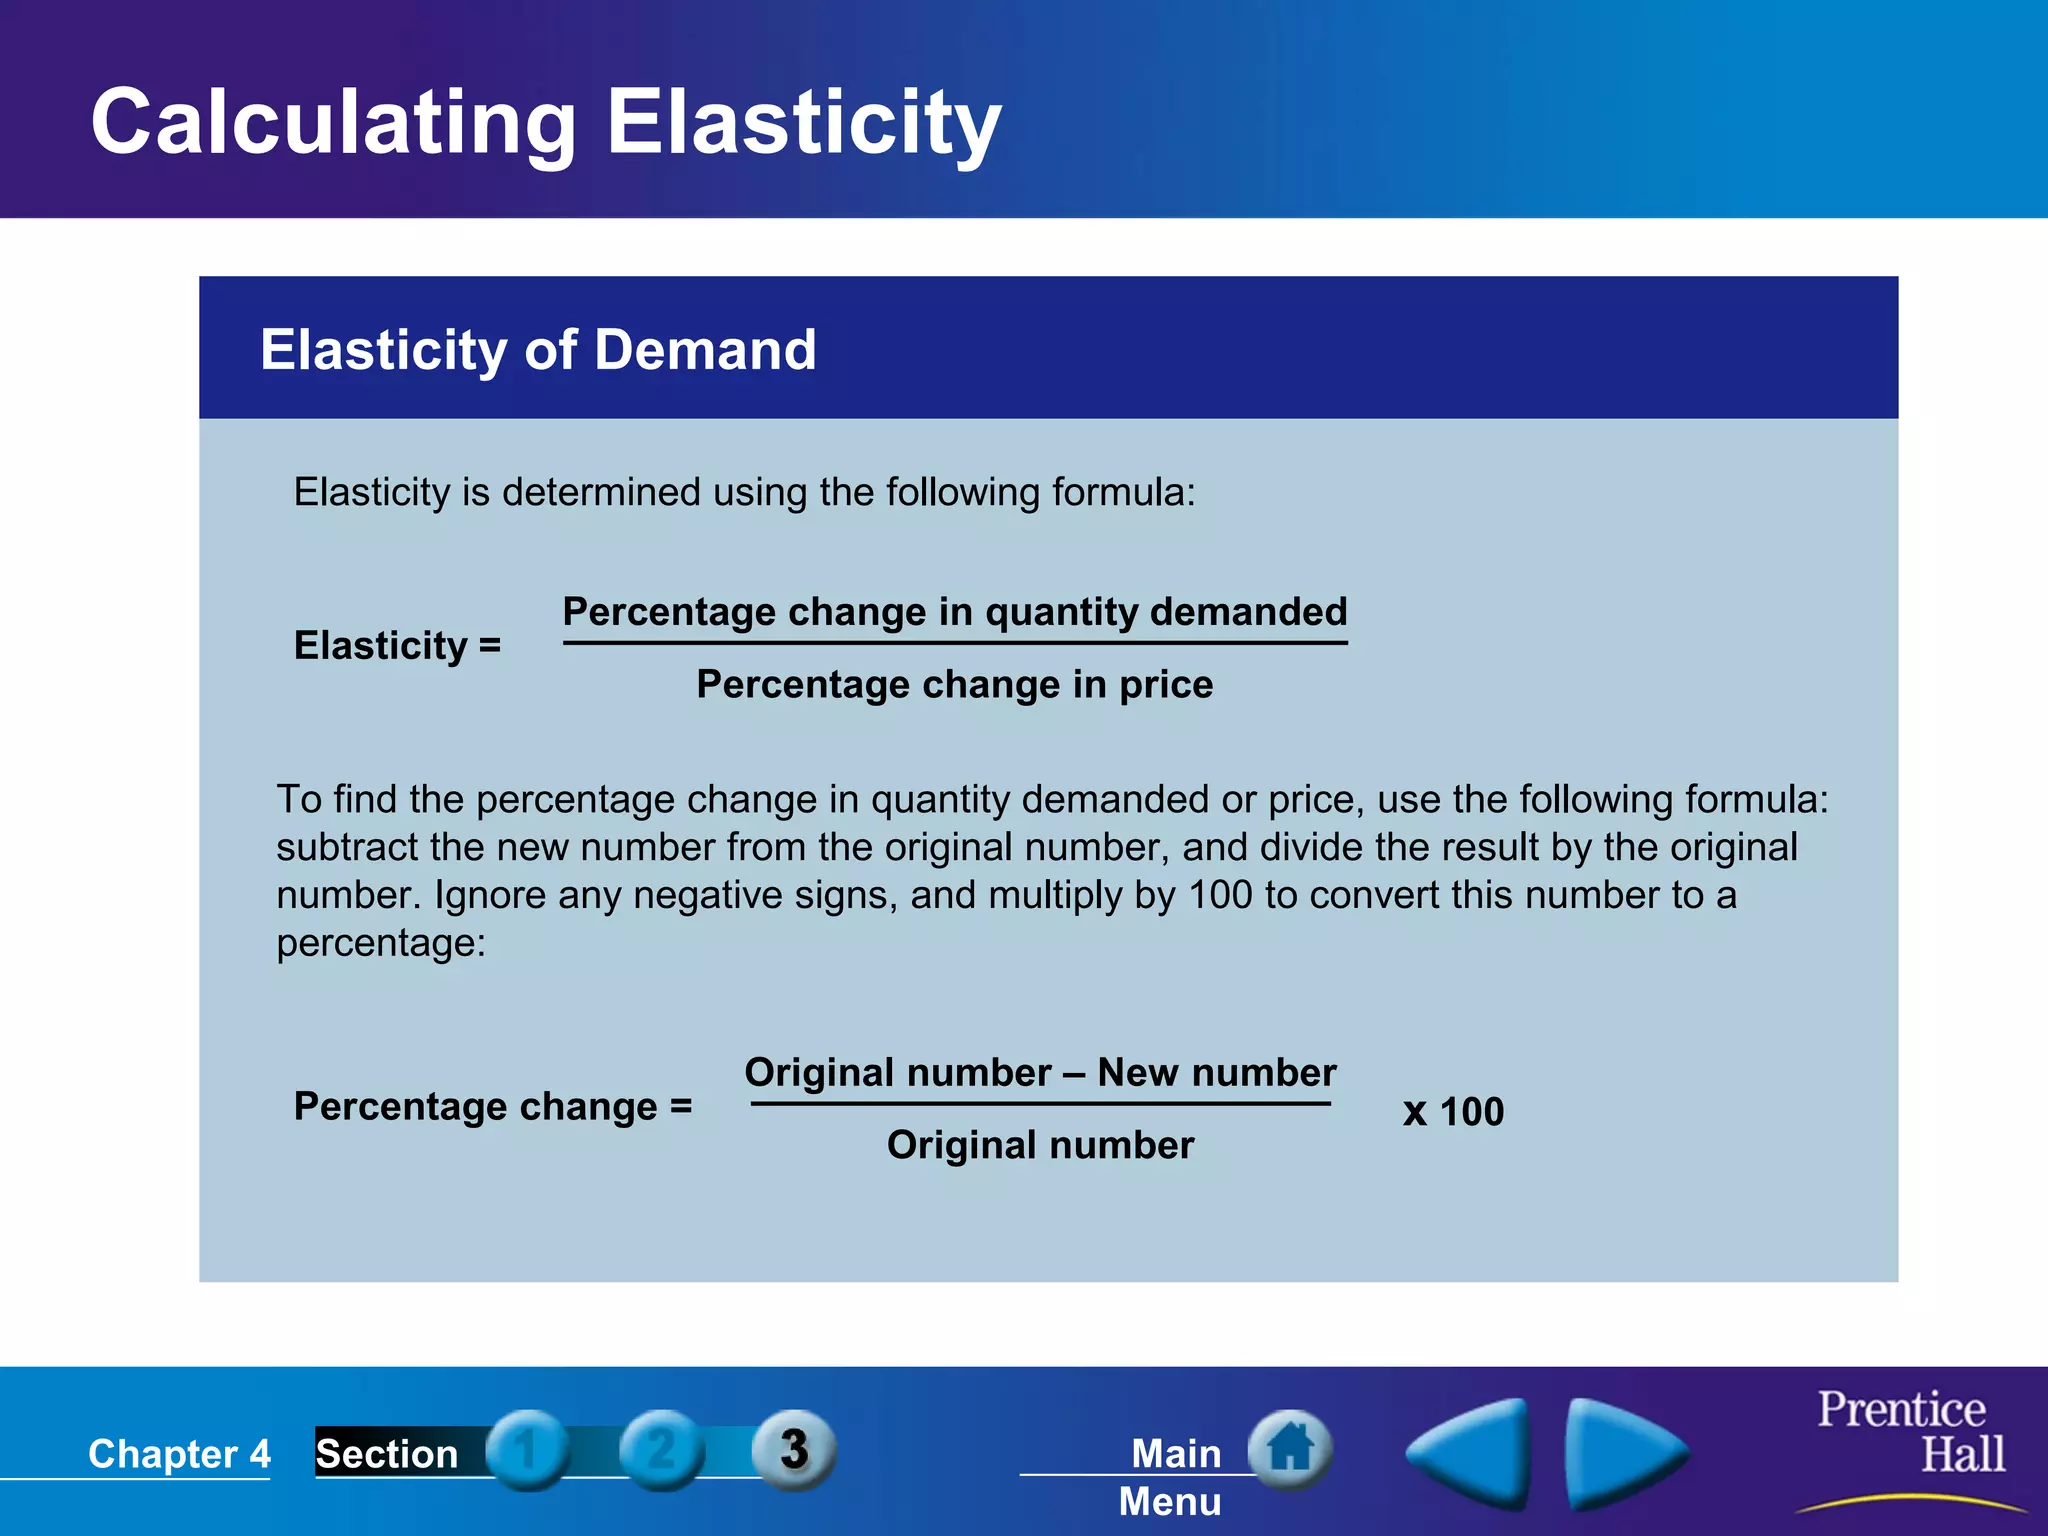
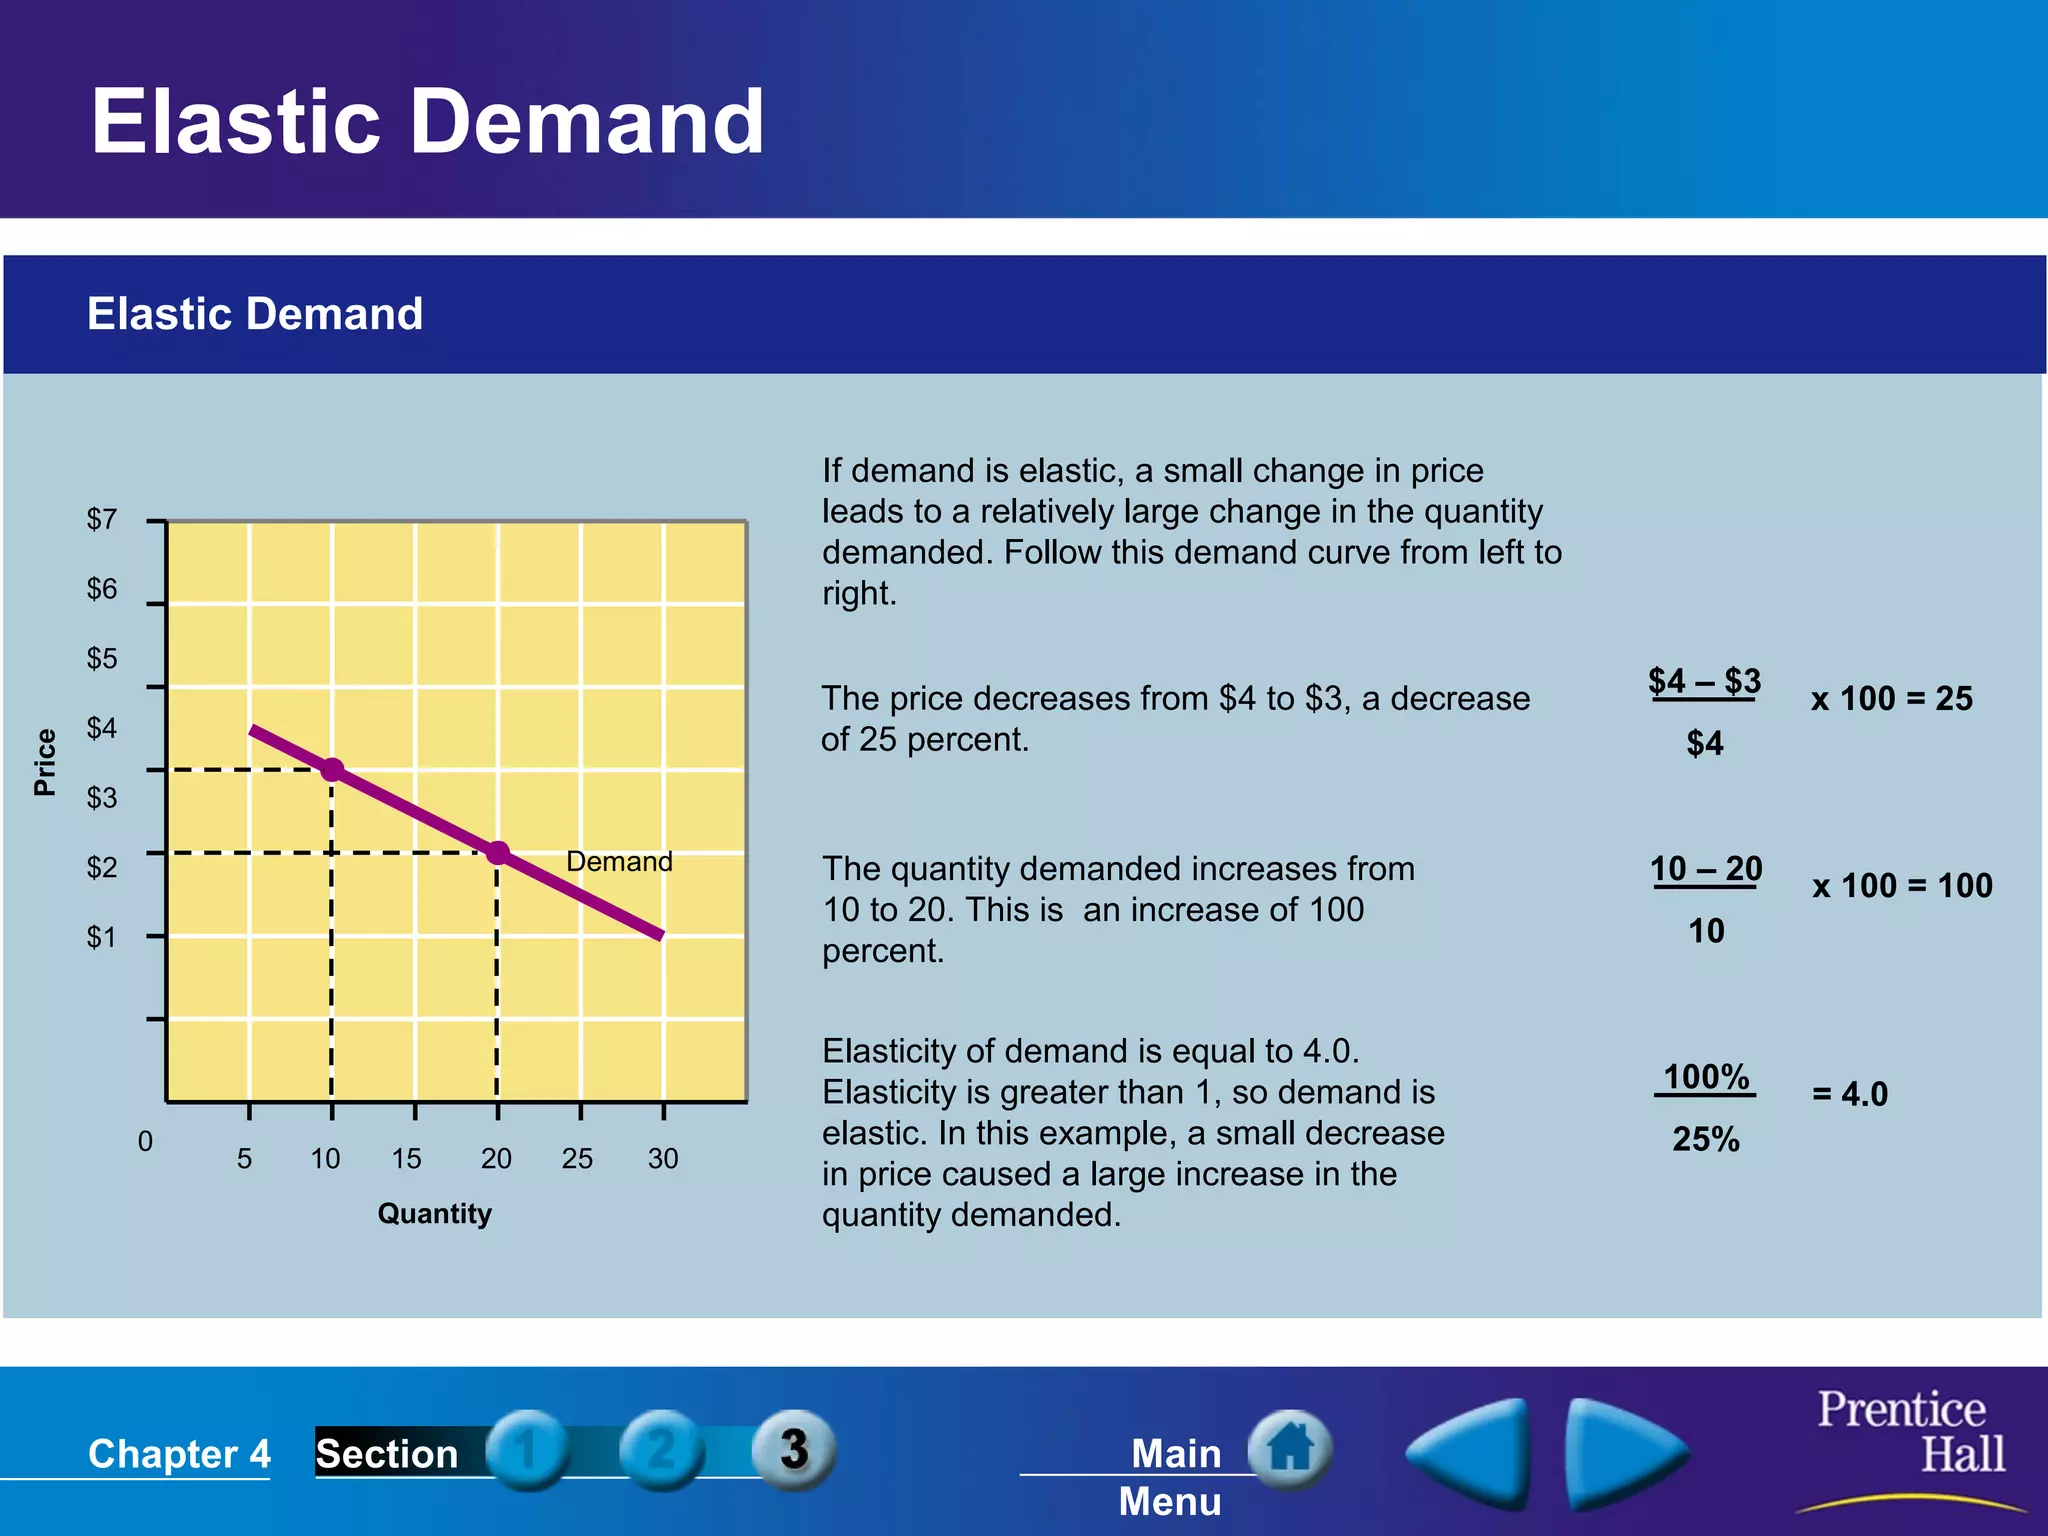
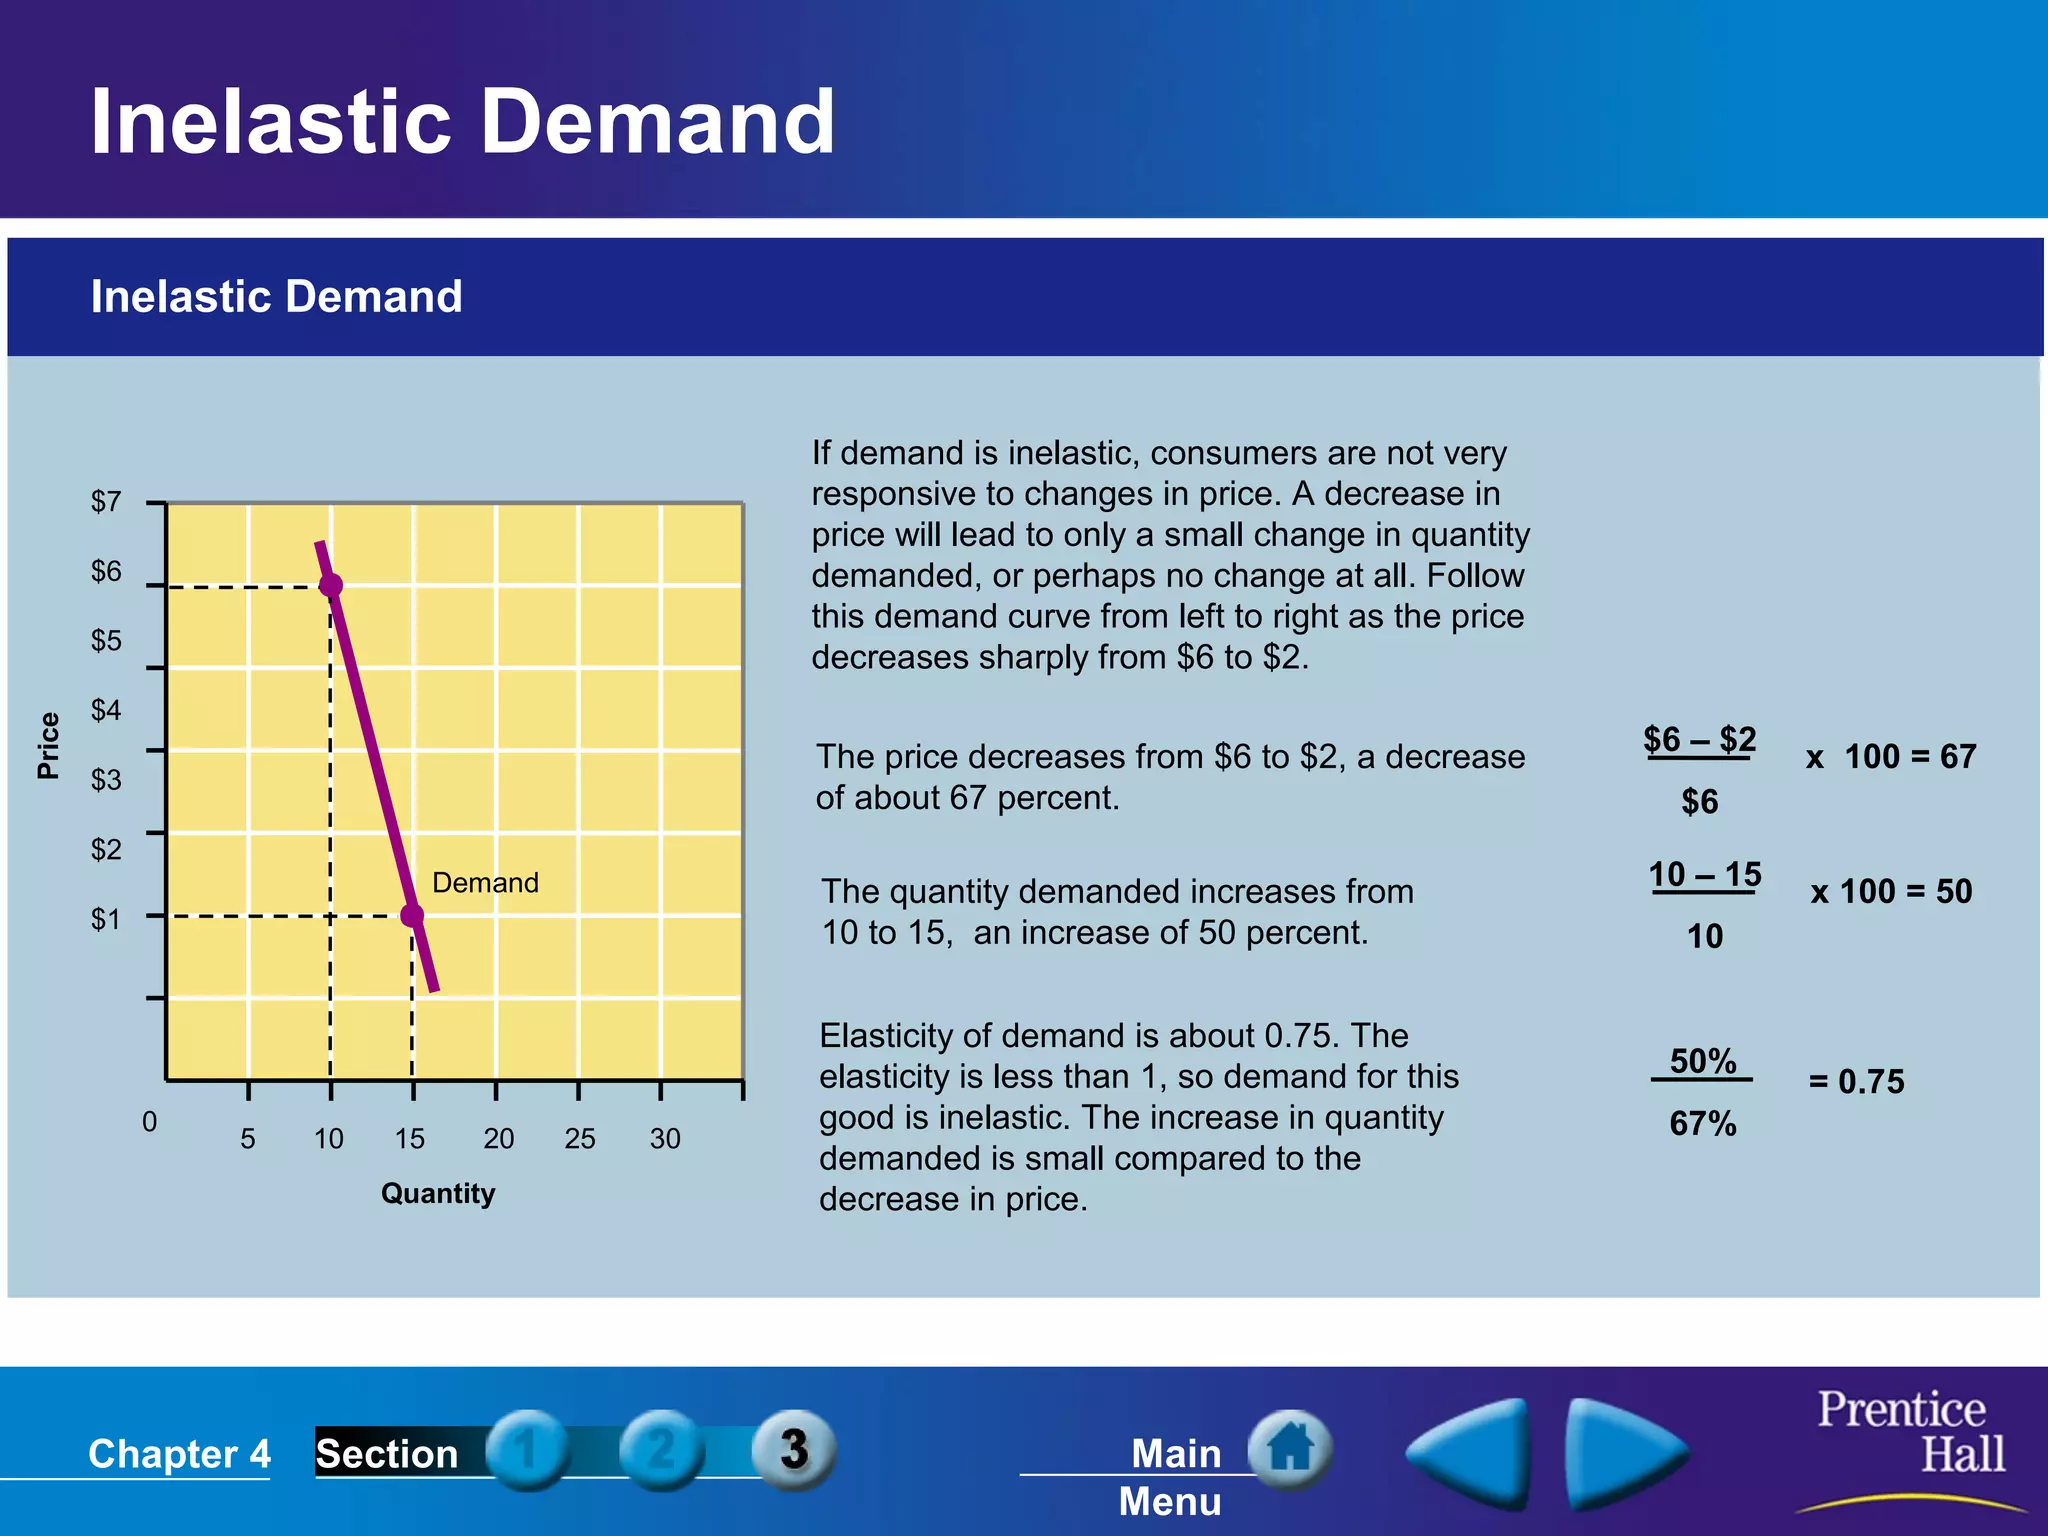
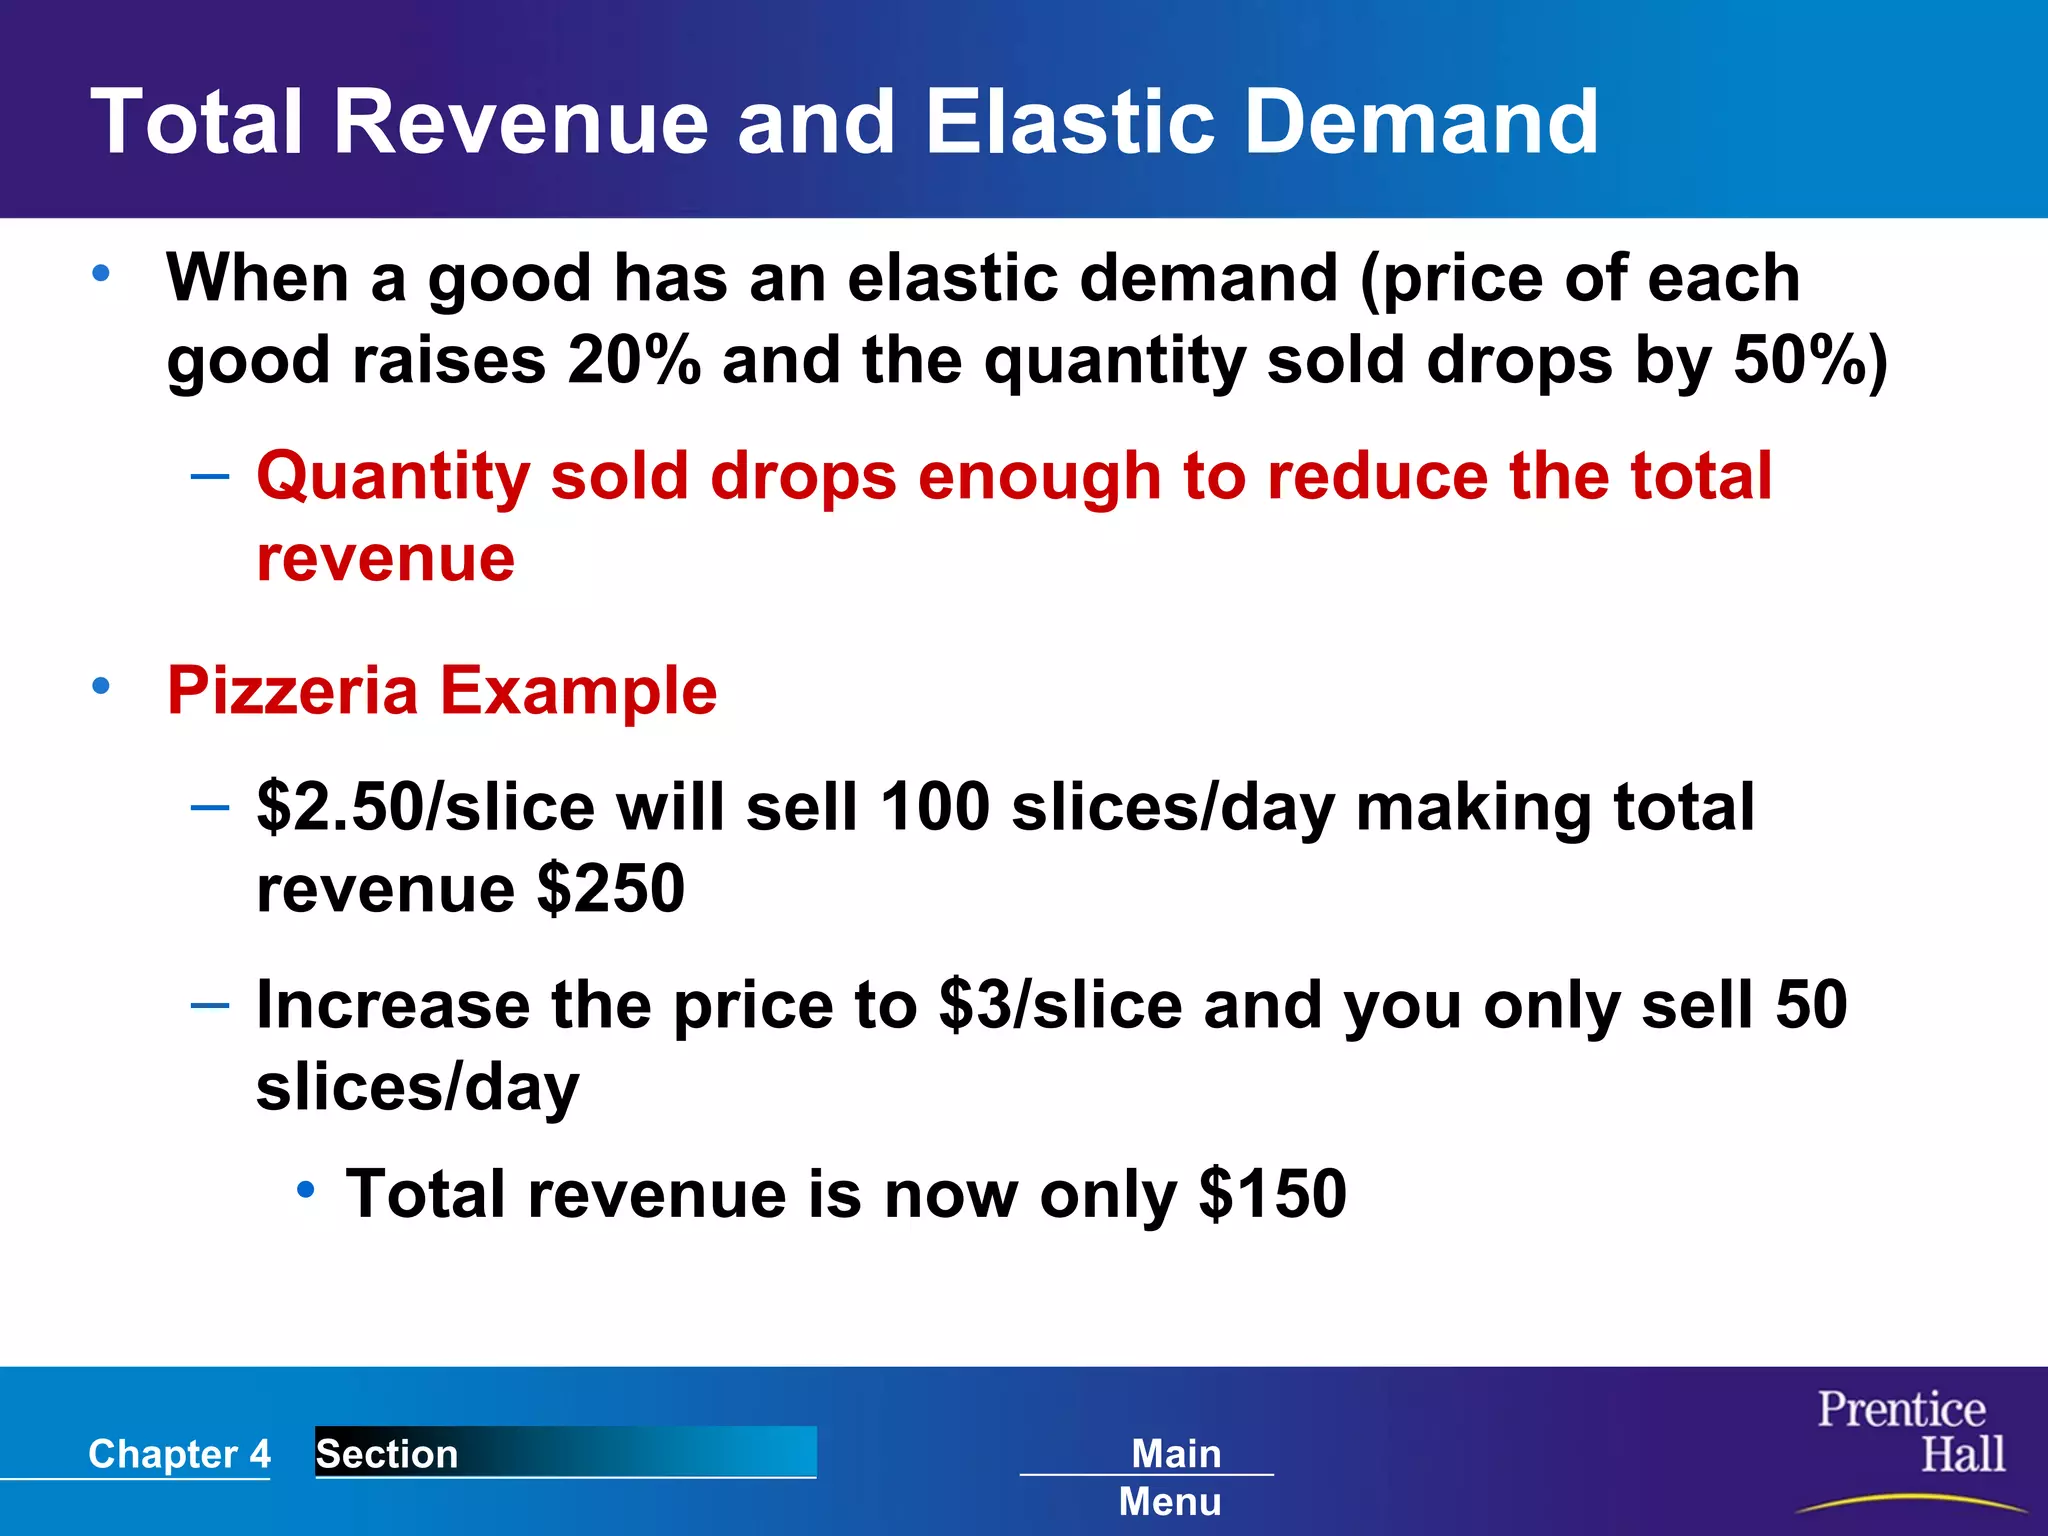
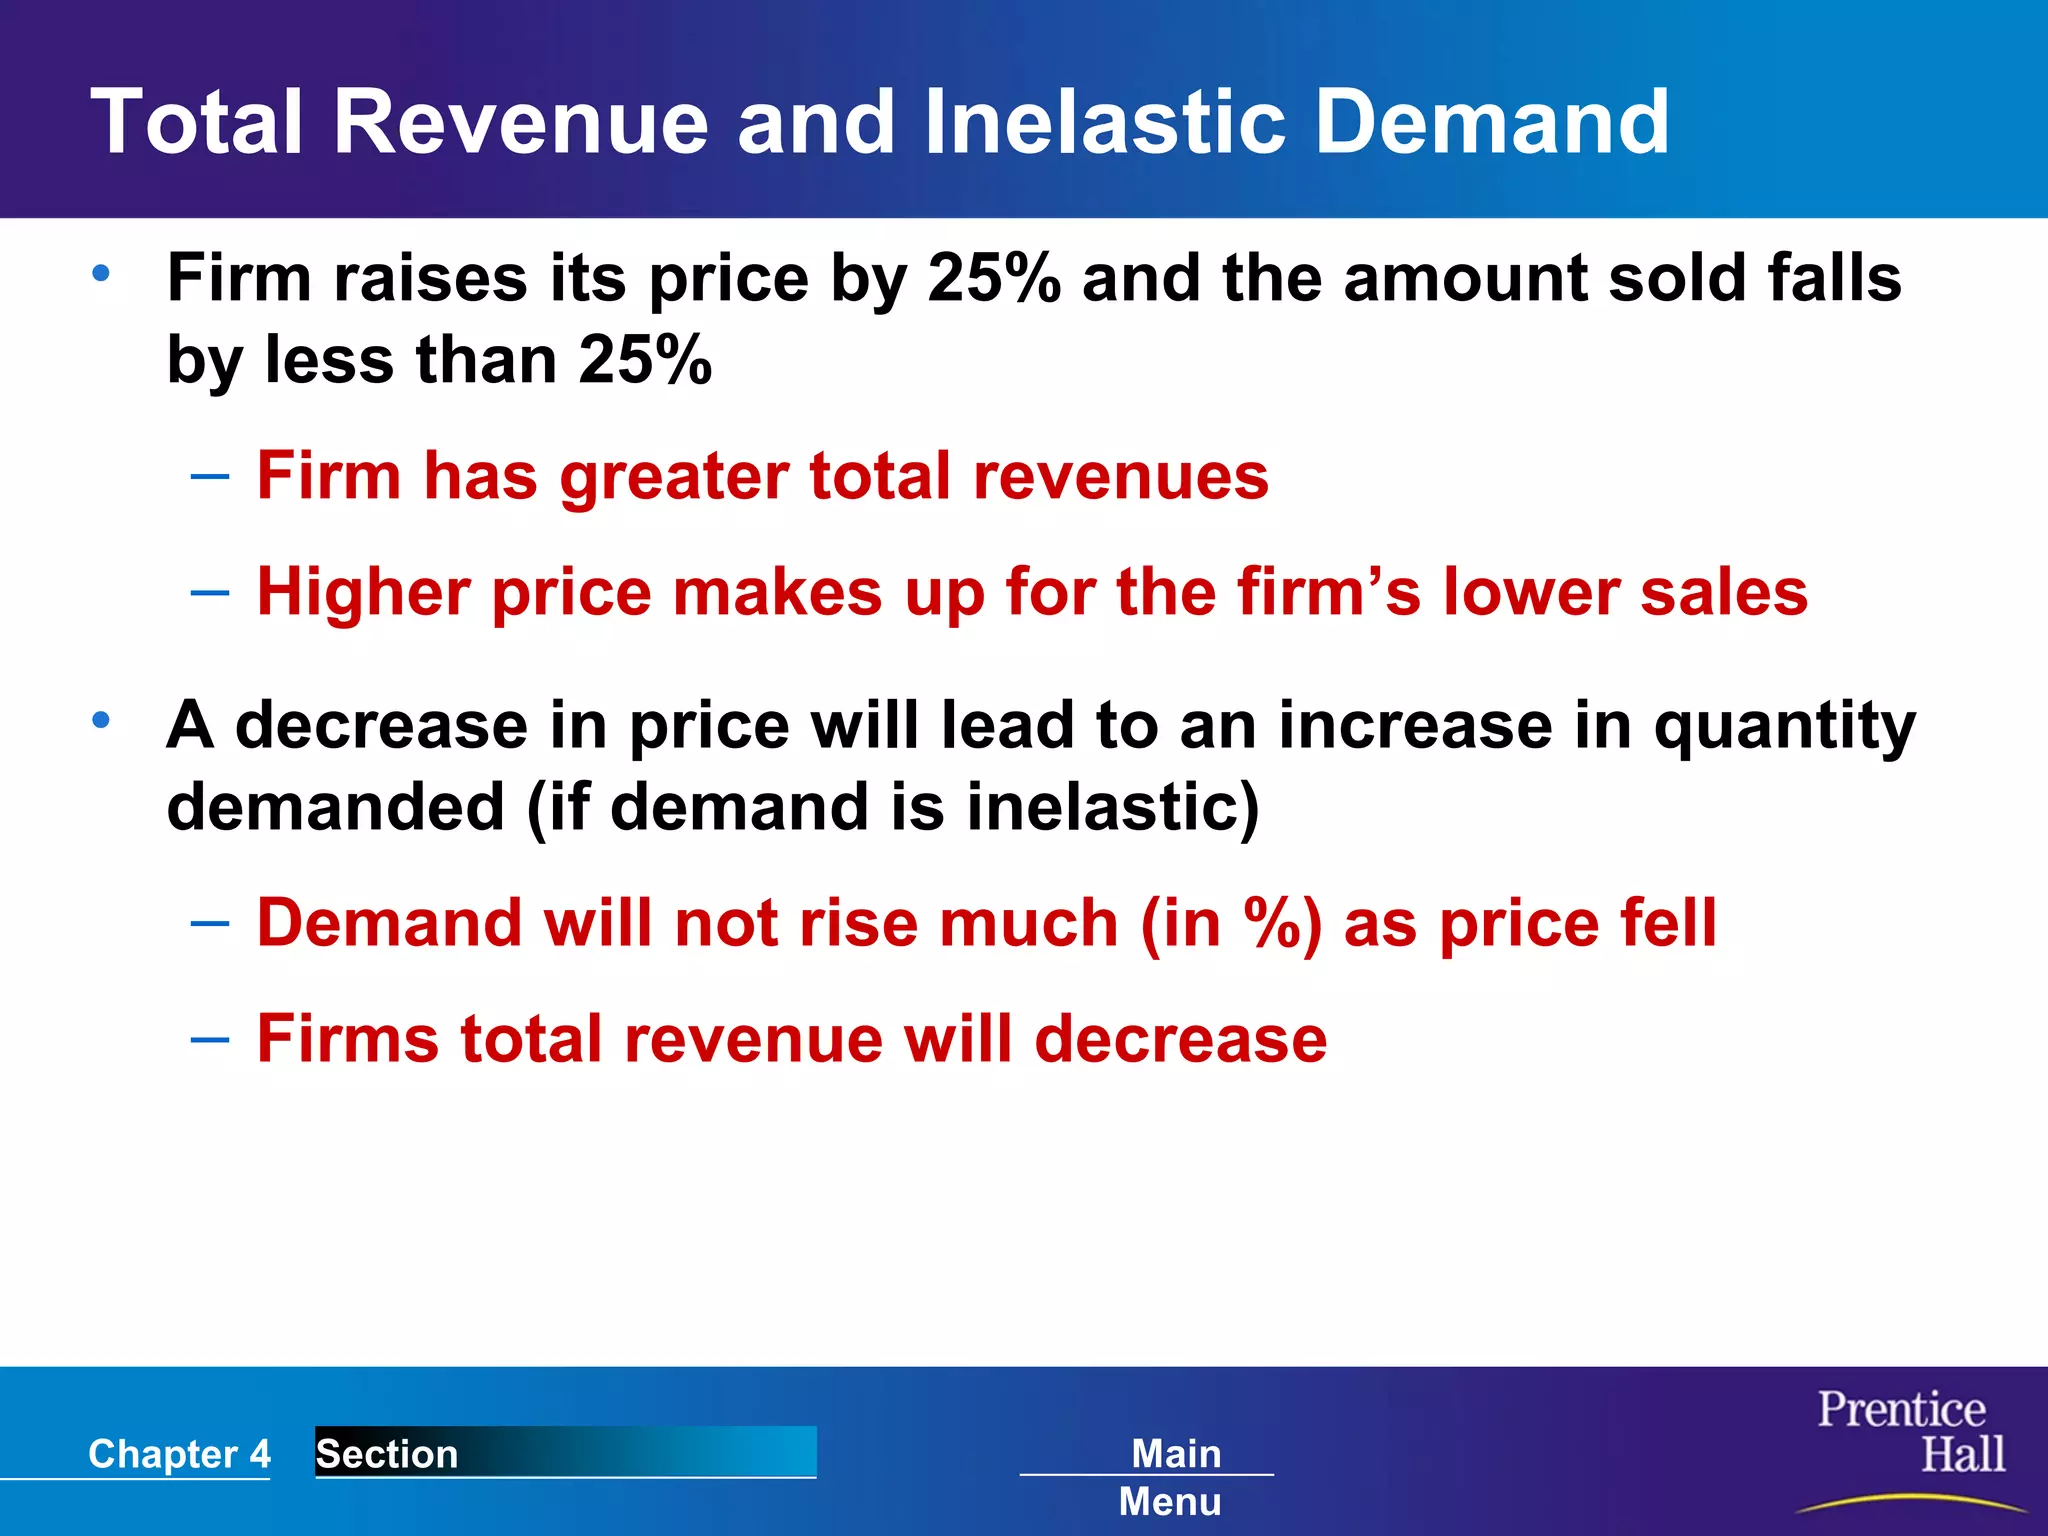
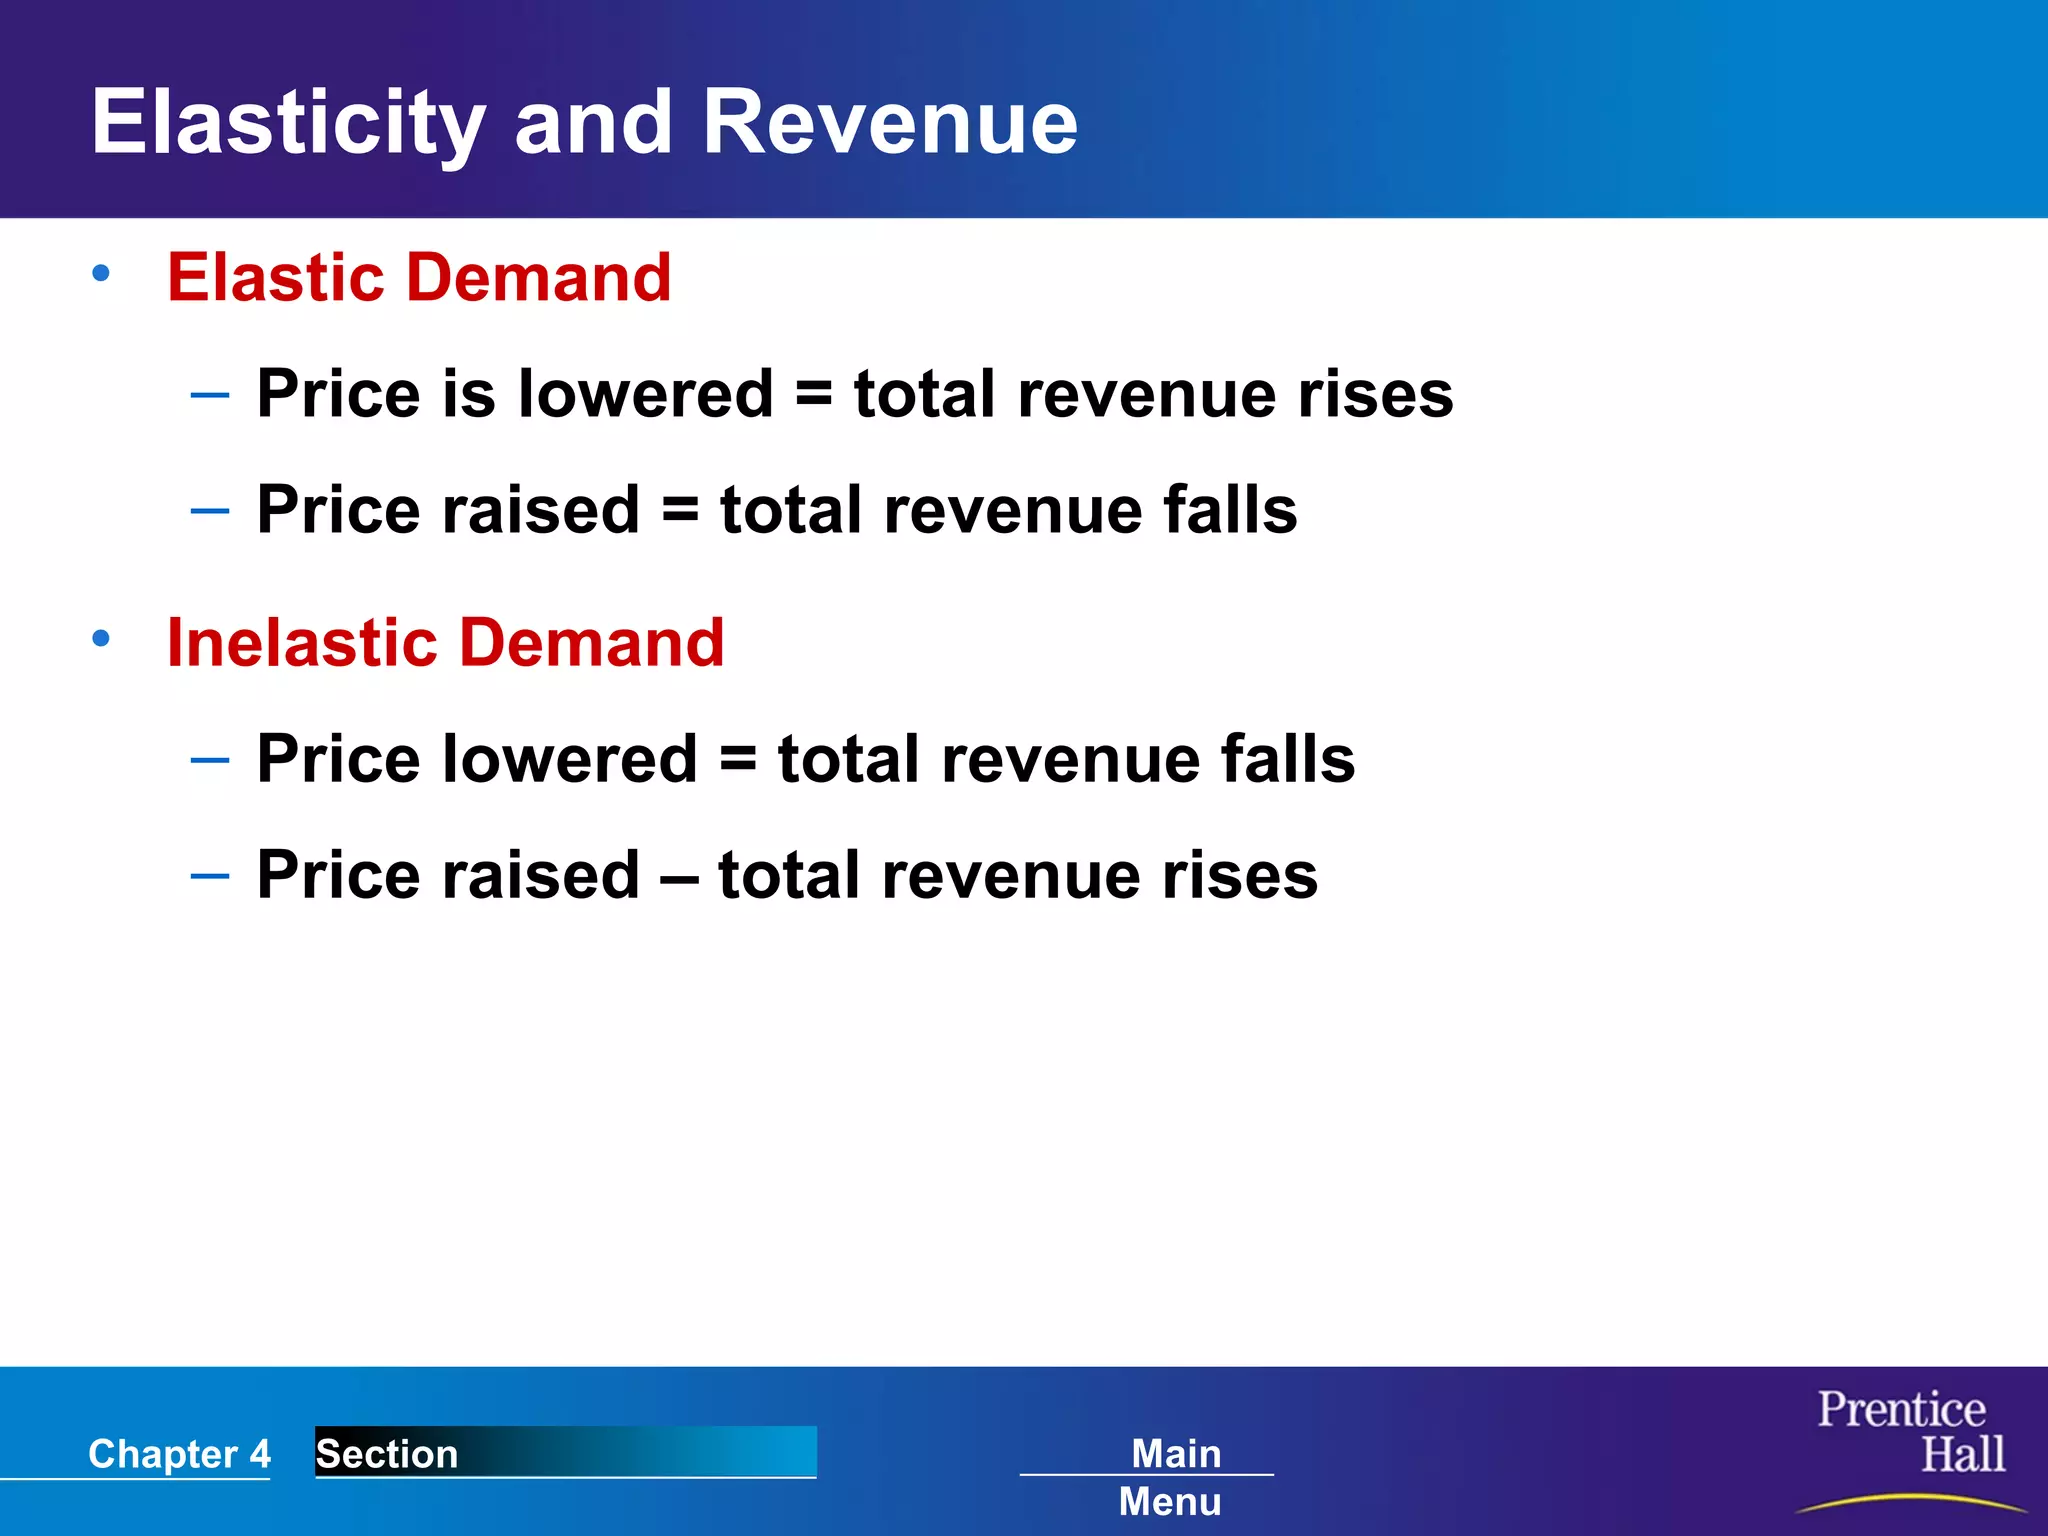
The document discusses concepts related to demand, including the law of demand, demand schedules, demand curves, elasticity of demand, and how elasticity affects total revenue. Specifically, it explains that according to the law of demand, as price increases, quantity demanded decreases, and vice versa. It provides examples of demand schedules and how they are used to construct demand curves. It also discusses factors that can cause a shift in the demand curve, such as changes in income, population, or prices of related goods. Finally, it explains the concept of elasticity of demand and how elastic versus inelastic demand impacts a firm's total revenue when price is changed.
This document summarizes key concepts about supply and demand equilibrium from economics. It defines equilibrium as the point where quantity demanded equals quantity supplied. It describes how markets can be in disequilibrium if supply and demand are not equal. It also discusses how price ceilings, price floors, and changes in supply or demand can cause markets to move to a new equilibrium point. The role of prices in signaling producers and allocating resources efficiently in a market is also covered.
This document provides an overview of demand, supply, and equilibrium in markets. It defines key concepts such as:
- The law of demand, which states that as price increases, quantity demanded decreases.
- Demand curves, which show the relationship between price and quantity demanded.
- Supply curves, which show the relationship between price and quantity supplied.
- Equilibrium, which is reached at the price where quantity demanded equals quantity supplied.
It also discusses factors that can cause demand and supply to shift, and the relationship between price elasticity and consumers' responsiveness to price changes.
DEMAND AND SUPPLY THEORY AND MARKET EQUILIBRIUMRebekahSamuel2
1. The document discusses demand and supply theory and market equilibrium. It covers topics like the demand curve, shifts in the demand curve, the supply curve, and shifts in the supply curve.
2. Key factors that can shift the demand curve are income, tastes and preferences, the prices of related goods, expectations about future prices and income, and the number of buyers in the market. The supply curve can shift due to changes in production costs, input prices, and technology.
3. When demand and supply interact in a competitive market, they determine an equilibrium price and quantity where the amount buyers want to purchase equals the amount sellers want to sell.
Canada has the comparative advantage in producing planes.
A terms of trade that benefits both is:
Canada produces x planes and trades for y ships from France.
Where x/y < 0.1 for Canada and x/y > 6 for France.
The document discusses the concepts of price elasticity of demand and supply. It defines price elasticity of demand as the percentage change in quantity demanded divided by the percentage change in price. Price elasticity of supply is defined similarly as the percentage change in quantity supplied divided by the percentage change in price. The document provides examples of different types of demand and supply curves based on their elasticities, and discusses how elasticity can be used to analyze the effects of changes in supply, demand, price, and total revenue in a market.
This document discusses the concepts of individual demand, market demand, and the assumptions of the law of demand. It provides examples of an individual demand schedule and curve for an individual named Adam. It then explains that market demand is the aggregate of individual demands. A market demand curve is created by horizontally summing individual demand curves. The market demand function is the horizontal summation of individual demand functions. Finally, it provides an example of how individual demand curves from three individuals (A, B, and C) can be summed to create a market demand curve.
This document discusses different types of demand, including:
1. Conventional perspectives on free goods, public goods, and economic goods. Islamic perspectives on al-tayyibat and al-rizq.
2. The relationship between price and quantity demanded as shown through demand schedules and curves. Individual demand curves summing to market demand.
3. Factors that can cause shifts in the demand curve, such as changes in income, tastes, prices of related goods, expectations, and market size. The differences between changes in quantity demanded versus changes in demand.
The document discusses demand theory, subsidies, and India's energy sector. It explains demand theory, including the demand curve and factors that influence demand elasticity. It then discusses the concept of subsidies, their types and rationale, as well as their advantages and disadvantages. Specifically regarding India, it outlines the trends in central government subsidies from 1994-1995 and classifications of subsidies. It also discusses explicit central government subsidies like food and fertilizer subsidies.
The document discusses demand and factors that influence the demand curve. It explains that the demand curve slopes downward, showing that as price increases, quantity demanded decreases. It also outlines several factors besides price that can cause the demand curve to shift, such as income, tastes, prices of related goods, number of buyers, and expectations. The document illustrates shifts in the demand curve through examples and graphs to distinguish between movements along the curve and shifts of the entire curve.
This document discusses demand analysis and the key concepts of demand, supply, and market equilibrium. It defines demand as the quantity of a good that consumers are willing and able to purchase at a given price. The law of demand states that price and quantity demanded move in opposite directions, with other factors held constant. Market demand is the sum of individual demands. The law of supply states that suppliers will provide a greater quantity at a higher price. Market equilibrium occurs where demand and supply are equal.
This document discusses factors that affect demand, including price, income, prices of other goods, number of buyers, future prices, tastes, and quality. Price is the most important determinant of demand, as a change in price causes a shift along the demand curve. Changes in other factors like income, population, or tastes can cause the entire demand curve to shift. An increase in demand shifts the curve to the right, raising price and quantity demanded, while a decrease shifts it left, lowering price and quantity.
1. Supply and demand are the two forces that determine market equilibrium, which is the price at which quantity supplied equals quantity demanded.
2. The supply curve shows the relationship between price and quantity supplied, and shifts due to changes in input prices, technology, and number of sellers. The demand curve shows the relationship between price and quantity demanded, and shifts due to changes in income, prices of substitutes/complements, tastes, and number of buyers.
3. Equilibrium is reached when the supply and demand curves intersect at the equilibrium price and quantity. If price is above equilibrium, there is excess supply; if below, there is excess demand, providing incentives for prices to change toward equilibrium.
The document discusses the law of demand and factors that influence demand. It can be summarized as:
1) The law of demand states that, all else being equal, as the price of a good increases, the quantity demanded decreases. The relationship between price and quantity demanded is represented by the downward sloping demand curve.
2) The demand for a good is influenced by its own price as well as the prices of substitutes and complements, income, tastes, and expectations. A change in any of these factors can cause the demand curve to shift.
3) An increase in demand results in a rightward shift of the demand curve and a higher equilibrium price, while a decrease in demand shifts the curve
The document provides an overview of supply and demand fundamentals. It defines key terms like quantity demanded, demand curve, quantity supplied, and supply curve. It explains how supply and demand are determined by price and how shifts can occur due to non-price factors. Examples of demand shifters include income, prices of related goods, tastes and preferences. Supply shifters include input prices, technology changes, and number of sellers. The document uses graphs and examples to illustrate concepts of supply, demand, and market equilibrium.
This document discusses the economic concepts of supply, demand, and market equilibrium. It provides details on:
1) How supply and demand curves model the relationship between price, quantity supplied, and quantity demanded in a competitive market, resulting in an equilibrium price and quantity.
2) The key determinants that influence supply and demand curves, including price, income, tastes, population, and prices of substitutes and complements.
3) How shifts in supply or demand curves due to changes in these determinants impact the market equilibrium price and quantity.
The Market Forces of Supply and DemandChris Thomas
1. Supply and demand are the forces that make market economies work by determining the equilibrium price and quantity in competitive markets where many buyers and sellers have little influence over price.
2. The demand curve shows how quantity demanded responds inversely to price, and it can shift due to non-price factors like income, tastes, and prices of related goods. The supply curve shows how quantity supplied responds directly to price and can shift due to input prices, technology, and number of sellers.
3. Market equilibrium occurs where supply and demand curves intersect and quantity supplied equals quantity demanded. Changes that shift the curves alter the equilibrium price and quantity.
Business Economics 03 Demand, Supply and the MarketUttam Satapathy
This document discusses demand, supply, and market equilibrium. It defines demand and supply, outlines factors that influence each, and describes the relationship between price, demand and supply. When demand and supply are equal, the market reaches equilibrium - the price where the quantity demanded equals the quantity supplied. The passage provides examples of demand and supply curves and equilibrium price and quantity points to illustrate these concepts.
Demand & suppaly PPT OF MANAGERIAL ECONOMICS MBABabasab Patil
The document discusses welfare economics and the efficiency of markets. It defines consumer surplus and producer surplus, and how they are measured using demand and supply curves. The market equilibrium maximizes total surplus, which is the sum of consumer and producer surplus. This occurs when resources are allocated efficiently. However, market power and externalities can cause markets to be inefficient.
The document discusses the theory of demand. It introduces the law of demand, which states that demand decreases when price increases and increases when price decreases. Non-price factors that influence demand are also discussed, including income, prices of substitutes, and tastes/preferences. The document analyzes demand in the short run and how changes in demand cause the equilibrium price and quantity to rise or fall. An example is given showing how increasing gas prices led to a decrease in demand for SUVs in the US, resulting in the price of SUVs falling to a new equilibrium.
11 Micro Economics Full Book Main Points PPTPranavKhudania
This document contains an acknowledgement section thanking various people for their support and inspiration, including the author's students, brother, parents, and lord Krishna. It then includes an index listing the chapters and page numbers. The main content is on the theory of demand, beginning with definitions of desire, want, demand, individual demand, and market demand. It discusses the factors that affect demand, including price, income, tastes, and the prices of substitutes and complements. It also covers the demand schedule, demand curve, individual demand curve, market demand curve, and exceptions to the law of demand.
This document discusses the economic concept of demand. It defines demand as the quantity of a good or service that consumers are willing and able to purchase at various price levels. Demand is determined by factors like price, income, tastes, population, and prices of substitutes. The law of demand states that, all else equal, demand increases when price decreases and decreases when price increases. Demand can change due to shifts in the demand curve from changes in these determinants, other than price.
The document discusses the determinants of demand. It identifies six key determinants: (1) changes in income, (2) changes in prices of related goods like substitutes and complements, (3) changes in population size or composition, (4) changes in price expectations, (5) changes in tastes/preferences, and (6) changes in consumer expectations about health effects. It provides examples showing how an increase or decrease in these determinants would shift a demand curve, representing a change in the quantity demanded at each price level rather than a movement along the curve.
This lecture covers key concepts of demand and supply including:
- Individual and market demand and supply curves and how they are derived from schedules
- Factors that affect demand and supply such as price, income, tastes, expectations, and population
- The law of demand which states that as price increases, quantity demanded decreases
- Exceptions to the law of demand such as Giffen goods and Veblen goods
- Differences between shifts in the demand curve versus movements along the demand curve
- How elasticity of demand measures responsiveness of quantity demanded to price changes
This document discusses demand theory and related concepts. It begins by defining demand as a buyer's willingness and ability to pay for a quantity of goods or services. It then covers the theory of demand, including its development by economists like Walras, Marshall, and Arrow. The document discusses the concept of effective demand and different types of demand like direct, derived, competitive, complementary, composite, and perishable versus durable. It also covers determinants of demand like price, income, tastes, expectations, and advertising. The law of demand and demand schedules and curves are explained. Exceptions to the law of demand like Giffen and Veblen goods are also mentioned.
In microeconomics, supply and demand is an economic model of price determination in a market. It concludes that in a competitive market, the unit price for a particular good will vary until it settles at a point where the quantity demanded by consumers will equal the quantity supplied by producers, resulting in an economic equilibrium for price and quantity.
The document discusses key concepts related to demand, including:
- The law of demand states that consumers will buy less of a good when its price increases and more when its price decreases.
- A demand schedule shows the quantity demanded at different price points, while a demand curve graphs this relationship.
- Elasticity of demand measures how responsive consumers are to price changes - elastic demand means consumers significantly change quantity demanded in response to price changes, while inelastic means they are not very responsive.
- Factors like availability of substitutes, importance of the good, and whether it is a necessity or luxury can impact a good's elasticity of demand.
Introduction to Supply and Demand and Market Equilibrium.pptxNonSy1
1. The document introduces supply and demand and market equilibrium. It defines demand as willingness to purchase and supply as willingness to sell. It identifies factors that affect demand and supply such as income, prices of inputs, and government policy.
2. Graphs are used to illustrate demand and supply schedules, curves, and how they intersect at the market equilibrium point where quantity demanded equals quantity supplied at an equilibrium price.
3. The document explains that surpluses and shortages occur when quantity supplied does not equal quantity demanded, and that prices adjust to bring the market back to equilibrium.
This chapter discusses consumer demand and the factors that influence it. It covers the sociopsychological and economic explanations for consumption behaviors. The key determinants of demand are tastes, income, prices, expectations, number of consumers and other goods. The chapter also explains the concepts of total utility, marginal utility, and the law of diminishing marginal utility. It introduces the law of demand and illustrates demand curves. Finally, it discusses the measurement of price elasticity, factors that influence elasticity like necessity vs luxury goods and availability of substitutes, and the relationship between elasticity and total revenue.
This document discusses utility theory and the determinants of demand. It covers several key concepts:
1) Utility is the satisfaction obtained from consuming goods and services, while total utility is the satisfaction from total consumption. Marginal utility is the change in total utility from consuming an additional unit of a good.
2) The law of diminishing marginal utility states that the marginal utility declines as consumption increases.
3) Demand is determined by factors like tastes, income, prices of other goods, and consumer expectations and numbers. The law of demand states that demand is negatively related to price, assuming other factors stay constant.
4) Price elasticity measures the responsiveness of demand to price changes. Demand
This document discusses utility theory and the determinants of demand. It provides explanations of key economic concepts including:
- The determinants of demand, which are tastes, income, expectations, prices of other goods, and number of consumers.
- Total utility, marginal utility, and the law of diminishing marginal utility. Additional quantities of a good yield smaller increments of satisfaction.
- The law of demand - quantity demanded increases as price falls, assuming other factors remain constant.
- Price elasticity measures consumer responsiveness to price changes. Demand can be elastic, inelastic, or unitary elastic.
- Price elasticity helps explain why higher prices may reduce total revenue for producers rather than increase it.
This document discusses utility theory and the determinants of demand. It covers several key concepts:
1) Utility is the satisfaction obtained from consuming goods and services, while total utility is the satisfaction from total consumption. Marginal utility is the change in total utility from consuming an additional unit of a good.
2) The law of diminishing marginal utility states that the marginal utility of a good declines as more of it is consumed.
3) Demand is determined by factors like tastes, income, expectations, prices of other goods, and number of consumers. The law of demand states that demand is negatively related to price, assuming other factors stay constant.
Table Of Contents :
1) What Is Retailer Financing?
2) Retailer Financing Options
3) Retailer Financing Benefits For Businesses
4) FAQs
1. Retailer Finance
Retailer financing or dealer financing is a credit facility to spread the cost of purchases into affordable payments. It makes shopping highly flexible, especially during times of financial stress like the one induced by the COVID-19 pandemic.
The retailer finance option is particularly beneficial during high-value purchases, allowing buyers to defer the payment or spread it out over an extended period. This mode of payment is flexible, and dealers offer different repayment options. While it is a buyer-centric financing option, it is also beneficial for sellers.
Read on to learn more about retailer financing and how it benefits customers and retailers.
What Is Retailer Financing?
In simple terms, retailer financing refers to a type of short-term unsecured credit that retail businesses offer their customers. This is a typical recourse taken to manage inventory and boost sales and is offered to buyers with a good credit rating.
Sellers offer this mode of financing to buyers at the point of sale. Customers get a credit on their purchases. They can then defer payment or spread it out, making their shopping experience simpler, quicker, and more convenient.
The seller, in turn, sells the credit to a financing institution that provides retailer financing for business as a service. These institutes can either provide credit through the retailer or set up separate payment options. Financers can take various measures to secure payment.
Retailer finance has traditionally been common in high-value purchases like automobiles. Today, it is also prevalent in other segments of the retail industry. Retailer financing allows retailers to arrange finances for their internal requirements without affecting overall business value. Internal requirements can range from effects of fluctuation in demand and supply on the inventory to salary payment, staff training, etc.
Retail financing can take various forms and may or may not include added interest.
2. Retailer Financing Options
There is no one-size-fits-all approach for customer convenience. Nevertheless, there are multiple variants when it comes to retailer payment options. Various types of payment modes include:
2.1. EMI
EMI refers to the type of financing where customers have to pay the total amount over an extended period of time with additional interest. This is most similar to a traditional loan, but a retailer offers it instead of a traditional financing institute like a bank.
2.2. No Cost EMI
As the name suggests, this is similar to EMI but with one key difference: no interest is added to the product's price. Instead, this financing method simply divides up the total price into smaller amounts payable over a period of time. Also known as "0% financing", this method allows customers to purchase a product without paying any extra amount.
2.3. Bu
This chapter introduces the concepts of supply and demand. It discusses how markets work through the interaction of supply and demand. The chapter defines different market types and outlines the factors that determine demand and supply in competitive markets. It establishes how changes in demand or supply affect price and quantity sold in a market. The chapter also looks at how prices allocate scarce resources in society.
This document provides an overview of supply and demand concepts. It discusses key topics like:
- The four types of markets and how supply and demand determine price and quantity in competitive markets.
- The determinants of demand and how changes in factors like income, prices of related goods, and tastes can shift the demand curve.
- The law of demand and how quantity demanded responds to price changes along the demand curve.
- The determinants of supply and how supply curves can shift from changes in input prices, technology, and expectations.
- How supply and demand interact in equilibrium to establish price and quantity, and what occurs in situations of excess supply or demand.
- How equilibrium changes in response to shifts in
This document provides an overview of supply and demand concepts. It begins by outlining the key topics that will be covered in the chapter, including market types, factors that determine demand and supply, and how equilibrium price and quantity are established. The chapter then defines demand, determinants of demand like income and tastes, and the difference between changes in quantity demanded versus demand. Similarly, it defines supply, determinants of supply, and the difference between changes in quantity supplied versus supply. The chapter concludes by bringing supply and demand together and explaining how equilibrium works and how it can change based on shifts in either curve.
This document provides an overview of demand concepts including:
1. The law of demand which states that as costs rise, quantity demanded falls. This relates to the cost-benefit principle where consumers will do something if benefits exceed costs.
2. Individual wants and tastes determine reservation prices which translate into demand. Wants are unlimited but resources are limited so consumers prioritize.
3. The rational spending rule states consumers should allocate spending across goods so marginal utility per dollar is equal, maximizing total utility.
4. When prices change, substitution and income effects cause consumers to alter purchases to maintain optimal spending. Substitution occurs toward substitutes, while income effects alter purchasing power.
5. Market demand is the horizontal sum
Introduction to Demand and the difference between Demand and Quantity Demanded. Including the impact prices have on Quantity and the Determinants of Demand.
The document provides an overview of supply and demand, including:
1. It defines demand as desire for a commodity backed by ability and willingness to pay, and defines the law of demand which states that quantity demanded varies inversely with price.
2. It also defines supply as the quantity firms choose to sell given a price, and defines the law of supply which states that quantity supplied varies directly with price.
3. It explains the determination of market equilibrium where the supply and demand curves intersect, and how various factors can cause the curves to shift, changing the equilibrium price and quantity.
Higher wages in the fast food industry would likely increase the supply of labor. If fast food workers were paid $2/hour, few people would choose to work in that industry due to the low wage (low price for labor). However, if they were paid $12/hour, more people would likely be willing to supply their labor to fast food companies since the higher wage (higher price) would incentivize more people to enter that industry. This illustrates the basic law of supply - that quantity supplied increases when price (in this case, wages) increases.
The document discusses supply and production costs. It defines key supply concepts like the law of supply, supply schedules, elasticity of supply, and factors that affect elasticity. It explains that according to the law of supply, suppliers will offer more of a good at a higher price. Supply schedules show the relationship between price and quantity supplied. Elasticity of supply measures how responsive suppliers are to price changes. Factors like time impact elasticity - supply is more inelastic in the short run. The document also discusses production costs like fixed costs, variable costs, marginal costs, and how firms determine optimal output levels by comparing marginal revenue and marginal costs.
This document discusses concepts related to demand, including:
1. Demand is determined by desire and ability to pay. The law of demand states that as price rises, quantity demanded falls, and vice versa. Demand is graphed with quantity on the horizontal axis and price on the vertical axis.
2. Factors that can shift the demand curve include tastes, income, prices of substitutes and complements, expectations, and population. A shift to the right indicates increased demand while a shift to the left indicates decreased demand.
3. Elasticity measures the responsiveness of quantity demanded to price changes. Demand is elastic if a small price change leads to a large quantity change, inelastic if
The document discusses the concept of elasticity of demand, specifically income elasticity of demand. It defines income elasticity of demand as the ratio of the percentage change in quantity demanded to the percentage change in income. Income elasticity of demand measures how responsive quantity demanded is to changes in consumer income. Demand can be classified as having high, unitary, low, zero, or negative income elasticity depending on the relationship between changes in income and changes in quantity demanded. The document also provides formulas for calculating income elasticity of demand.
This document discusses demand and its determinants. It defines demand and explains that demand arises from desire, ability to pay, and willingness to pay. It then lists the key determinants of demand as: price of the product, income, prices of related goods, tastes/preferences, expectations of future prices, and economic conditions. It provides examples for how each determinant influences demand. The document also discusses the law of demand, demand curves/schedules, demand functions, assumptions and exceptions to the law of demand, and different types of demand like individual vs market demand. Finally, it explains concepts of elasticity of demand including price, income, and cross elasticity.
The Genesis of BriansClub.cm Famous Dark WEb PlatformSabaaSudozai
BriansClub.cm, a famous platform on the dark web, has become one of the most infamous carding marketplaces, specializing in the sale of stolen credit card data.
Profiles of Iconic Fashion Personalities.pdfTTop Threads
The fashion industry is dynamic and ever-changing, continuously sculpted by trailblazing visionaries who challenge norms and redefine beauty. This document delves into the profiles of some of the most iconic fashion personalities whose impact has left a lasting impression on the industry. From timeless designers to modern-day influencers, each individual has uniquely woven their thread into the rich fabric of fashion history, contributing to its ongoing evolution.
[To download this presentation, visit:
https://www.oeconsulting.com.sg/training-presentations]
This PowerPoint compilation offers a comprehensive overview of 20 leading innovation management frameworks and methodologies, selected for their broad applicability across various industries and organizational contexts. These frameworks are valuable resources for a wide range of users, including business professionals, educators, and consultants.
Each framework is presented with visually engaging diagrams and templates, ensuring the content is both informative and appealing. While this compilation is thorough, please note that the slides are intended as supplementary resources and may not be sufficient for standalone instructional purposes.
This compilation is ideal for anyone looking to enhance their understanding of innovation management and drive meaningful change within their organization. Whether you aim to improve product development processes, enhance customer experiences, or drive digital transformation, these frameworks offer valuable insights and tools to help you achieve your goals.
INCLUDED FRAMEWORKS/MODELS:
1. Stanford’s Design Thinking
2. IDEO’s Human-Centered Design
3. Strategyzer’s Business Model Innovation
4. Lean Startup Methodology
5. Agile Innovation Framework
6. Doblin’s Ten Types of Innovation
7. McKinsey’s Three Horizons of Growth
8. Customer Journey Map
9. Christensen’s Disruptive Innovation Theory
10. Blue Ocean Strategy
11. Strategyn’s Jobs-To-Be-Done (JTBD) Framework with Job Map
12. Design Sprint Framework
13. The Double Diamond
14. Lean Six Sigma DMAIC
15. TRIZ Problem-Solving Framework
16. Edward de Bono’s Six Thinking Hats
17. Stage-Gate Model
18. Toyota’s Six Steps of Kaizen
19. Microsoft’s Digital Transformation Framework
20. Design for Six Sigma (DFSS)
To download this presentation, visit:
https://www.oeconsulting.com.sg/training-presentations
SATTA MATKA SATTA FAST RESULT KALYAN TOP MATKA RESULT KALYAN SATTA MATKA FAST RESULT MILAN RATAN RAJDHANI MAIN BAZAR MATKA FAST TIPS RESULT MATKA CHART JODI CHART PANEL CHART FREE FIX GAME SATTAMATKA ! MATKA MOBI SATTA 143 spboss.in TOP NO1 RESULT FULL RATE MATKA ONLINE GAME PLAY BY APP SPBOSS
NIMA2024 | De toegevoegde waarde van DEI en ESG in campagnes | Nathalie Lam |...BBPMedia1
Nathalie zal delen hoe DEI en ESG een fundamentele rol kunnen spelen in je merkstrategie en je de juiste aansluiting kan creëren met je doelgroep. Door middel van voorbeelden en simpele handvatten toont ze hoe dit in jouw organisatie toegepast kan worden.
𝐔𝐧𝐯𝐞𝐢𝐥 𝐭𝐡𝐞 𝐅𝐮𝐭𝐮𝐫𝐞 𝐨𝐟 𝐄𝐧𝐞𝐫𝐠𝐲 𝐄𝐟𝐟𝐢𝐜𝐢𝐞𝐧𝐜𝐲 𝐰𝐢𝐭𝐡 𝐍𝐄𝐖𝐍𝐓𝐈𝐃𝐄’𝐬 𝐋𝐚𝐭𝐞𝐬𝐭 𝐎𝐟𝐟𝐞𝐫𝐢𝐧𝐠𝐬
Explore the details in our newly released product manual, which showcases NEWNTIDE's advanced heat pump technologies. Delve into our energy-efficient and eco-friendly solutions tailored for diverse global markets.
Unveiling the Dynamic Personalities, Key Dates, and Horoscope Insights: Gemin...my Pandit
Explore the fascinating world of the Gemini Zodiac Sign. Discover the unique personality traits, key dates, and horoscope insights of Gemini individuals. Learn how their sociable, communicative nature and boundless curiosity make them the dynamic explorers of the zodiac. Dive into the duality of the Gemini sign and understand their intellectual and adventurous spirit.
Call8328958814 satta matka Kalyan result satta guessing➑➌➋➑➒➎➑➑➊➍
Satta Matka Kalyan Main Mumbai Fastest Results
Satta Matka ❋ Sattamatka ❋ New Mumbai Ratan Satta Matka ❋ Fast Matka ❋ Milan Market ❋ Kalyan Matka Results ❋ Satta Game ❋ Matka Game ❋ Satta Matka ❋ Kalyan Satta Matka ❋ Mumbai Main ❋ Online Matka Results ❋ Satta Matka Tips ❋ Milan Chart ❋ Satta Matka Boss❋ New Star Day ❋ Satta King ❋ Live Satta Matka Results ❋ Satta Matka Company ❋ Indian Matka ❋ Satta Matka 143❋ Kalyan Night Matka..
Part 2 Deep Dive: Navigating the 2024 Slowdownjeffkluth1
Introduction
The global retail industry has weathered numerous storms, with the financial crisis of 2008 serving as a poignant reminder of the sector's resilience and adaptability. However, as we navigate the complex landscape of 2024, retailers face a unique set of challenges that demand innovative strategies and a fundamental shift in mindset. This white paper contrasts the impact of the 2008 recession on the retail sector with the current headwinds retailers are grappling with, while offering a comprehensive roadmap for success in this new paradigm.
IMPACT Silver is a pure silver zinc producer with over $260 million in revenue since 2008 and a large 100% owned 210km Mexico land package - 2024 catalysts includes new 14% grade zinc Plomosas mine and 20,000m of fully funded exploration drilling.
Best Competitive Marble Pricing in Dubai - ☎ 9928909666Stone Art Hub
Stone Art Hub offers the best competitive Marble Pricing in Dubai, ensuring affordability without compromising quality. With a wide range of exquisite marble options to choose from, you can enhance your spaces with elegance and sophistication. For inquiries or orders, contact us at ☎ 9928909666. Experience luxury at unbeatable prices.
Industrial Tech SW: Category Renewal and CreationChristian Dahlen
Every industrial revolution has created a new set of categories and a new set of players.
Multiple new technologies have emerged, but Samsara and C3.ai are only two companies which have gone public so far.
Manufacturing startups constitute the largest pipeline share of unicorns and IPO candidates in the SF Bay Area, and software startups dominate in Germany.
4 Benefits of Partnering with an OnlyFans Agency for Content Creators.pdfonlyfansmanagedau
In the competitive world of content creation, standing out and maximising revenue on platforms like OnlyFans can be challenging. This is where partnering with an OnlyFans agency can make a significant difference. Here are five key benefits for content creators considering this option:
❼❷⓿❺❻❷❽❷❼❽ Dpboss Matka Result Satta Matka Guessing Satta Fix jodi Kalyan Final ank Satta Matka Dpbos Final ank Satta Matta Matka 143 Kalyan Matka Guessing Final Matka Final ank Today Matka 420 Satta Batta Satta 143 Kalyan Chart Main Bazar Chart vip Matka Guessing Dpboss 143 Guessing Kalyan night
Discover timeless style with the 2022 Vintage Roman Numerals Men's Ring. Crafted from premium stainless steel, this 6mm wide ring embodies elegance and durability. Perfect as a gift, it seamlessly blends classic Roman numeral detailing with modern sophistication, making it an ideal accessory for any occasion.
https://rb.gy/usj1a2
1. Chapter 4 Section Main
Menu
Understanding Demand
• What is the law of demand?
• How do the substitution effect and income effect
influence decisions?
• What is a demand schedule?
• What is a demand curve?
2. Chapter 4 Section Main
Menu
Law of Demand
• Demand – the desire to own something and ability to
pay for it
• Law of Demand
– Price goes down = demand goes up
– Price goes up = demand goes down
– Price of a good strongly influences the decision to
buy it
– Example
• How many pieces of pizza would you buy at $1?
• Same piece at $2, $3, and so on
3. Chapter 4 Section Main
Menu
Law of Demand
• Two separate patterns overlap b/c of Law of Demand
– Substitution Effect and Income Effect
• They describe 2 different ways that a consumer can
change their spending patterns
4. Chapter 4 Section Main
Menu
Substitution Effect
• When the price of the pizza rises, more people will start
buying other products
– Drops the demand for pizza
– Change in spending is known as the substitution
effect
• Eating pizza on Mondays and Fridays now turns
into pizza on only Mondays and something else
on Fridays
– Reacting to the price change of one good and
substituting it for another
5. Chapter 4 Section Main
Menu
The Income Effect
• Price of the goods you buy go up, you start to make cut
backs on the purchases you make
– Cut back on buying pizza, clothes, etc.
• Buying fewer products w/o increasing your purchases
of other goods is the Income Effect
• Economists measure consumption in the amount of a
good that is bought, not the price on the good
– Spending more on pizza but you are consuming less
• People spend more money on pizza, the demand still
goes down
6. Chapter 4 Section Main
Menu
Understanding Demand
• To have demand for a good you must be willing and
able to pay for it at a specified price
– Might want a new car, but you can’t afford it so you
do not demand it
• Demand Schedule
– Table that lists the quantity of a good that a person
will purchase at each price in a market
7. Chapter 4 Section Main
Menu
Market Demand Schedules
• Adding up the demand schedules for every buyer in the
market, this is creating a Market Demand Schedule
– Shows the quantities demanded at each price by all
consumers in the market
– Businesses use these to predict the total sale of a
product at different prices
• This schedule shows the Law of Demand in play
8. Chapter 4 Section Main
Menu
Demand Schedules
Individual Demand Schedule
Price of a
slice of pizza
Quantity demanded
per day
Market Demand Schedule
Price of a
slice of pizza
Quantity demanded
per day
$.50
$1.00
$1.50
$2.00
$2.50
$3.00
5
4
3
2
1
0
$.50
$1.00
$1.50
$2.00
$2.50
$3.00
300
250
200
150
100
50
The Demand Schedules
9. Chapter 4 Section Main
Menu
Market Demand Curve
3.00
2.50
2.00
1.50
1.00
.50
0
0 50 100 150 200 250 300 350
Slices of pizza per day
Priceperslice(indollars)
Demand
The Demand Curve
• A demand curve is a
graphical representation of
a demand schedule.
• Reading a demand curve
–Only price and quantity
are taken into account
–Slopes downward and
right
–Prices rise, quantity
drops
–Prices decrease, quantity
raises
10. Chapter 4 Section Main
Menu
Limits of a Demand Curve
• Only accurate for one very specific set of market
conditions
• Does not take any other factors into account
– Pizza place near a factory that has layoffs will lose
business b/c those workers will stop coming in
11. Chapter 4 Section Main
Menu
Shifts of the Demand Curve
• What is the difference between a change in quantity
demanded and a shift in the demand curve?
• What factors can cause shifts in the demand curve?
• How does the change in the price of one good affect
the demand for a related good?
12. Chapter 4 Section Main
Menu
Changes in Demand
• Demand curves are accurate as long as there are no
other changes other than price that affects decisions
• Ceteris Paribus
– “all other things held constant”
– This was used on the Demand Curve w/ pizza
– Does not take into account any other factors (only
price and quantity)
• When price changes we move along the curve
– Change in quantity demanded
– Up or down the curve
13. Chapter 4 Section Main
Menu
Changes in Demand
• Get rid of the ceteris paribus rule then we no longer
move along the curve
– The entire curve shifts left or right
• A shift in the demand curve means that at every price,
consumers buy a diff. amount than before
– Called Change in Demand
14. Chapter 4 Section Main
Menu
Causes for Shifts - Income
• Normal Goods – goods that consumers demand more
of when their income increases
– This would move the curve to the right to show more
demand at each price
• Increase in Demand
• Decrease in Demand – if the curve shifts to the
left
– Inferior Goods – an increase in income causes us to
buy less of these
• Buy name brand stuff once your income rises
instead of store brand
15. Chapter 4 Section Main
Menu
Causes - Consumer Expectations
• Expectations of a higher price will affect your
immediate demand of the product
– Example
• Go into Best Buy to buy a laptop and the sales
person tells you the price will go up in a week
• Your demand for the product raises and you
would probably purchase it then b/c you expect a
higher price
• Your immediate demand will drop if the laptop
would be on sale next week
16. Chapter 4 Section Main
Menu
Causes - Population
• Rise in population obviously raises the demand for
food, shelter, etc.
• After WWII
– Record number of men and women married and had
children (“baby boom”) from mid 1940s – 1964
– Initial demand grew w/ baby products, then it
thousands of schools were needed and built
(universities also expanded later)
– Now that they are retiring, the demands among
senior citizens will rise
17. Chapter 4 Section Main
Menu
Causes – Consumer Tastes and Advertising
• Trends change over periods of time (clothes, music,
etc.)
• Advertising and publicity play an important role
– Companies spend large amounts of money on
advertising to try and raise the demand for their
products
18. Chapter 4 Section Main
Menu
Prices of Related Goods
• Demand curve for one good can be affected by a
change in the demand for another good
– Complements
• Two goods that are bought and used together
• Buy new skis, need ski boots
• If the price of skis go up, the demand for both
products go down
– Substitutes
• Goods used in place of another
• Price of skis goes up, some people will switch to
snowboarding
19. Chapter 4 Section Main
Menu
Elasticity of Demand
• What is elasticity of demand?
• How can a demand schedule and demand curve be
used to determine elasticity of demand?
• What factors affect elasticity?
• How do firms use elasticity and revenue to make
decisions?
20. Chapter 4 Section Main
Menu
Elasticity of Demand
• Elasticity of Demand - Dictates how drastically buyers
will cut back or increase their demand for a good when
price rises or falls
• Inelastic – demand for a good that you will keep buying
no matter the rise in price
– Not too responsive to price change
• Elastic – buy much less of a good when the price
increases
– Very responsive to price change
21. Chapter 4 Section Main
Menu
Price Range
• Demand for a good can be highly elastic at one price
and inelastic at another
– Example:
• Price of a bottle of Coke goes from $1.00 to $1.50
– Raises 50%, most people will keep buying
almost the same amount
– Inelastic
• If the price went from $2.00 to $3.00
– Still 50% rise, however the demand will go
down more than the first example
– Highly elastic
22. Chapter 4 Section Main
Menu
Values of Elasticity
• If the elasticity of demand for a good at a certain price
is LESS than 1 it is INELASTIC
• Elasticity is GREATER than 1 it is ELASTIC
• Elasticity = 1, it is called Unitary Elastic
– % change in quantity demanded is exactly equal to
the % change in the price
– Example: Demand for a magazine at $2 is unitary
• Price rises to $3 (50% rise)
• The newsstand will sell exactly half as many
copies as before
23. Chapter 4 Section Main
Menu
Values of Elasticity
• Pizza Example from before
– Demand schedule showed that when the price rose
from $1 to $1.50, her demand fell from 4 to 3 slices
– Change in price was 50% and the quantity decreased
by 25%
– Dividing 25% by 50% you get .5
– Less than 1 so it is inelastic
24. Chapter 4 Section Main
Menu
Elasticity of Demand
Elasticity is determined using the following formula:
Elasticity =
Percentage change in quantity demanded
Percentage change in price
Percentage change =
Original number – New number
Original number
x 100
To find the percentage change in quantity demanded or price, use the following formula:
subtract the new number from the original number, and divide the result by the original
number. Ignore any negative signs, and multiply by 100 to convert this number to a
percentage:
Calculating Elasticity
25. Chapter 4 Section Main
Menu
If demand is elastic, a small change in price
leads to a relatively large change in the quantity
demanded. Follow this demand curve from left to
right.
Price
Quantity
$7
$6
$5
$4
$3
$2
$1
Elastic Demand
0
5 10 15 20 25 30
Demand
The price decreases from $4 to $3, a decrease
of 25 percent.
$4 – $3
$4
x 100 = 25
The quantity demanded increases from
10 to 20. This is an increase of 100
percent.
10 – 20
10
x 100 = 100
Elasticity of demand is equal to 4.0.
Elasticity is greater than 1, so demand is
elastic. In this example, a small decrease
in price caused a large increase in the
quantity demanded.
100%
25%
= 4.0
Elastic Demand
26. Chapter 4 Section Main
Menu
Price
Quantity
$7
$6
$5
$4
$3
$2
$1
Inelastic Demand
0
5 10 15 20 25 30
Demand
If demand is inelastic, consumers are not very
responsive to changes in price. A decrease in
price will lead to only a small change in quantity
demanded, or perhaps no change at all. Follow
this demand curve from left to right as the price
decreases sharply from $6 to $2.
The price decreases from $6 to $2, a decrease
of about 67 percent.
$6 – $2
$6
x 100 = 67
The quantity demanded increases from
10 to 15, an increase of 50 percent.
10 – 15
10
x 100 = 50
Elasticity of demand is about 0.75. The
elasticity is less than 1, so demand for this
good is inelastic. The increase in quantity
demanded is small compared to the
decrease in price.
50%
67%
= 0.75
Inelastic Demand
27. Chapter 4 Section Main
Menu
Factors Effecting Elasticity
• Availability of Substitutions
– No good substitutions for a product means when the
price rises for one, you will probably still buy it
• Want to see your favorite band in concert,
probably buy the tickets b/c there is no good sub
(inelastic)
– Lots of substitutes make some products elastic
• Foods at grocery store, just switch brands based
on price
28. Chapter 4 Section Main
Menu
Factors continued
• Relative Importance
– If you buy a lot of one good and price goes up, you
must make tough decisions
• Reduce consumption of that good or cut back
drastically on other goods in order to keep budget
in control
• Higher the jump, more adjustments
• Spend half of budget on clothes, price goes up,
large cut backs = elastic demand
29. Chapter 4 Section Main
Menu
Factors continued
• Necessities vs. Luxuries
– Necessities – food, water, gas, clothes, etc.
• Things we buy no matter the price (inelastic)
– Some people feel that Starbucks is a luxury
• Price goes down more people will buy it
• Price its at now and especially if it rises, people
will buy cheaper coffee
• Elastic
• Everyone has different idea of what necessities and
luxuries are
30. Chapter 4 Section Main
Menu
Change Over Time
• Consumers shopping habits do not change quickly
when prices increase
– Takes time to find substitutes
– Inelastic in the short term, but becomes elastic over
time
• Example
– Person buys an SUV that takes a lot of gas to run
– Work is far away and so is the grocery store
– Factors can’t be changed very easily
31. Chapter 4 Section Main
Menu
Change Over Time
• Gasoline Example continued
– 1970s – gas prices rose, but at first people kept
buying gas
– Over time the prices stayed high so people bought
more fuel efficient cars or car pooled
– Demand for gas went down
– Inelastic in short term, became elastic over time
32. Chapter 4 Section Main
Menu
Computing a Firm’s Total Revenue
• Total Revenue – the total amount of money a firm
receives by selling goods/services
– Need to know the price of goods and the amount
sold
– Pizzeria sells 125 slices/day at $2 a slice
– Total revenue is $250/day
33. Chapter 4 Section Main
Menu
Total Revenue and Elastic Demand
• When a good has an elastic demand (price of each
good raises 20% and the quantity sold drops by 50%)
– Quantity sold drops enough to reduce the total
revenue
• Pizzeria Example
– $2.50/slice will sell 100 slices/day making total
revenue $250
– Increase the price to $3/slice and you only sell 50
slices/day
• Total revenue is now only $150
34. Chapter 4 Section Main
Menu
Total Revenue and Elastic Demand
• Elastic Demand comes from one or more of these
factors
– 1. Availability of substitute goods
– 2. a limited budget that does not allow price changes
– 3. the perception of the good as a luxury item
• If these are present, then the firm may find a price
increase reduces total revenue
35. Chapter 4 Section Main
Menu
Total Revenue and Inelastic Demand
• Firm raises its price by 25% and the amount sold falls
by less than 25%
– Firm has greater total revenues
– Higher price makes up for the firm’s lower sales
• A decrease in price will lead to an increase in quantity
demanded (if demand is inelastic)
– Demand will not rise much (in %) as price fell
– Firms total revenue will decrease
36. Chapter 4 Section Main
Menu
Elasticity and Revenue
• Elastic Demand
– Price is lowered = total revenue rises
– Price raised = total revenue falls
• Inelastic Demand
– Price lowered = total revenue falls
– Price raised – total revenue rises