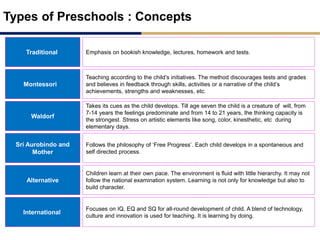
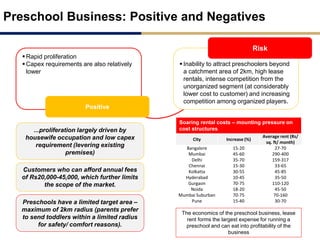
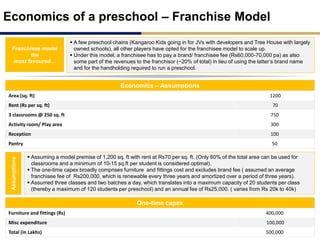
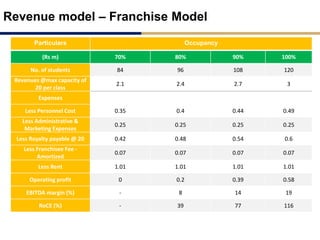
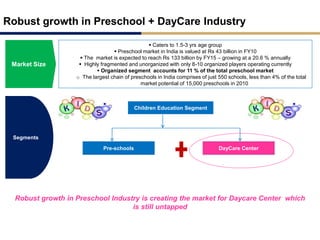
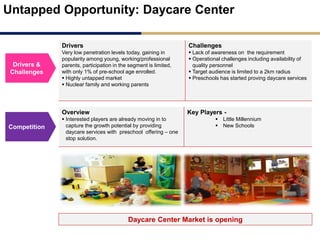
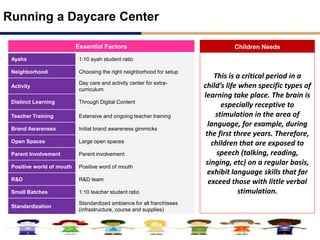
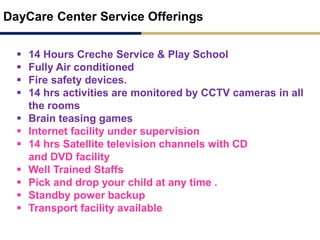
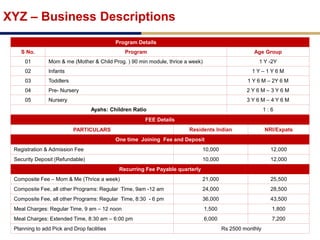
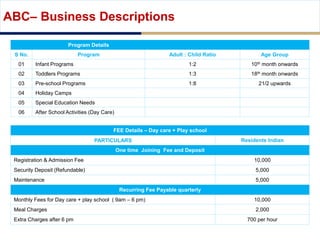
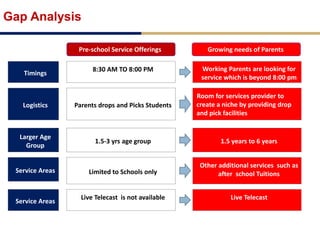
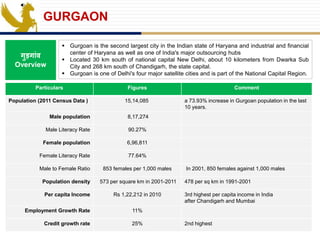
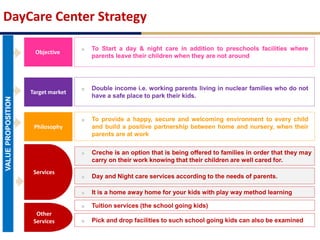
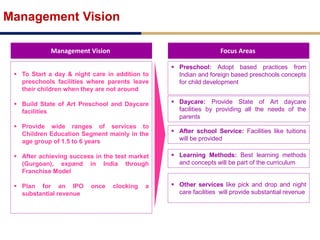
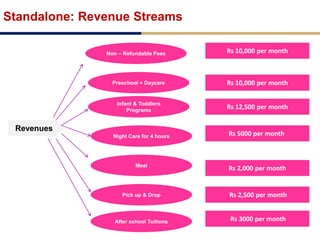
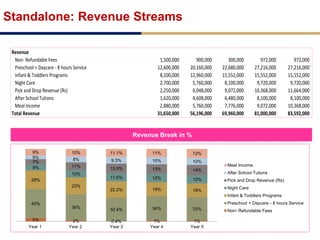
.
DAY CARE CENTER
MACROECONOMICS & INDUSTRY
BACKGROUND
Private education sector is estimated to be an INR
~2200 bn opportunity (2010)
1,752
1,980
2237
2628
2867
2008 2009 2010e 2011e 2012e
Market Size (in bn Rs)
Actual
 India is one of the largest education networks with ~1.3 mn schools and ~18,000 higher
education institutes estimated to be operational in 2009
 Indian education sector is estimated at INR 3,550 bn comprising a public sector spending
of INR 1,350 bn and private sector estimated to be an INR 2,200 bn opportunity
 With government opting for private sector participation in the development of education
infrastructure, the future opportunity for private sector is considered substantial
Forecasted
Education is expected to take a growing share of
total consumer spending in India
3% 6% 6% 9%4%
8% 9%
11%
56% 42%
34% 25%
4%
7%
9%
13%
16%
15%
15% 13%
12%
17% 22% 24%
5% 6% 5% 6%
1996 2006 2016F 2026F
Education and recreation Personal products and Services Food & beverages
Healthcare Housing and household products Comm and Transport
Apparel
With rising disposable income and increased share of education in the consumption basket,
private education sector is expected to be a key beneficiary of India’s growth story
 India has a growing middle class driving growth in demand for private education
 Currently households in India spend less than 5% of disposable income on education compared to
12% in US and 15% in China
 Household spending on education has seen a growth CAGR of 8.6% versus consumption growth of
3.2% over 1995-2005
 Private education though relatively expensive, is perceived as ‘quality’
The formal education space is regulated and has a
dominant share in the overall education market
Education Sector
Formal Education Informal Education
K-12
Higher
Education
Coaching
Institutes
Pre-schools
Vocational
Education
Regulations
 Largely unregulated
 There are no constraints on profit making in the pre-school
system
 Vocational training institutes under the government are regulated
by the Ministry of Labor and Employment, while those in the
private sector are unregulated
 Under the purview of the Ministry of Human
Resource Development
 K-12 is governed by different schooling
boards -State / ICSE/ CBSE/ IB
 Higher education* regulated by University
 Grants Commission (UGC) and All India
Council of Technical Education (AICTE)
MarketSize(inbn)
$20
$34
2008 2012E
14%
$6.50
$10.30
2008 2012E
12%
$0.8
6
$2.6
6
2010 2016E
12%
$1.6
0
$14.
00
2008 2012E
25%
$0.3
$0.6
2008 2012E
17%
Trends : Pre-schools are looking at revenue
enhancement through geographic expansion
 Many corporate houses have / are planning to set up their own chain of pre-schools - Pre
schools are viewed as attractive investment opportunities due to the growth potential
 For e.g. Alphakids set up by Camlin group and Globe Tot’ers by Yash Birla group
Entry of Big Corporates
Joint Ventures with
Builders
 Increasingly preschools are forming joint ventures with builders.
 Partnering with builders helps in imparting flexibility in the business against high lease rentals
 AEZ group and Mothers s Pride entered into a JV for a Preschool
Upgrade to K 12
 Preschool chains are moving up the value chain by upgrading to K-12 schools to ensure
scalability for preschool firms
 Kidzee, Euro Kids and Kangaroo Kids are upgrading to K-12 schools and a large majority of
their preschool population is expected to be the potential customers for K-12
 Demand and affordability is increasing in small towns with the growing awareness among
people about the need to send children to preschools
 Euro kids plans to add 1000 pre schools in medium term with Tier II and Tier III cities as
growth drivers
Expansion to Tier I & Tier
II Cities
Leveraging Infrastructure
for economic viability
 In order to maximize space utilization, preschools are leveraging the existing infrastructure to
generate additional revenues
 Additional programmes are being offered in the same premise in order to allow higher
utilization of the infrastructure
Types of Preschools : Concepts
Traditional
Montessori
Waldorf
Sri Aurobindo and
Mother
Alternative
International
Emphasis on bookish knowledge, lectures, homework and tests.
Teaching according to the child’s initiatives. The method discourages tests and grades
and believes in feedback through skills, activities or a narrative of the child’s
achievements, strengths and weaknesses, etc.
Takes its cues as the child develops. Till age seven the child is a creature of will, from
7-14 years the feelings predominate and from 14 to 21 years, the thinking capacity is
the strongest. Stress on artistic elements like song, color, kinesthetic, etc during
elementary days.
Follows the philosophy of ‘Free Progress’. Each child develops in a spontaneous and
self directed process.
Children learn at their own pace. The environment is fluid with little hierarchy. It may not
follow the national examination system. Learning is not only for knowledge but also to
build character.
Focuses on IQ, EQ and SQ for all-round development of child. A blend of technology,
culture and innovation is used for teaching. It is learning by doing.
Preschool Business: Positive and Negatives
 Rapid proliferation
 Capex requirements are also relatively
lower
Positive
 Inability to attract preschoolers beyond
a catchment area of 2km, high lease
rentals, intense competition from the
unorganized segment (at considerably
lower cost to customer) and increasing
competition among organized players.
Risk
...proliferation largely driven by
housewife occupation and low capex
requirement (levering existing
premises)
Preschools have a limited target area –
maximum of 2km radius (parents prefer
to send toddlers within a limited radius
for safety/ comfort reasons).
Customers who can afford annual fees
of Rs20,000-45,000, which further limits
the scope of the market.
Soaring rental costs – mounting pressure on
cost structures
City Increase (%)
Average rent (Rs/
sq. ft/ month)
Bangalore 15-20 27-70
Mumbai 45-60 290-400
Delhi 35-70 159-317
Chennai 15-30 33-65
Kolkatta 30-55 45-85
Hyderabad 10-45 35-50
Gurgaon 70-75 110-120
Noida 18-20 45-50
Mumbai Suburban 70-75 70-160
Pune 15-40 30-70
The economics of the preschool business, lease
rent forms the largest expense for running a
preschool and can eat into profitability of the
business
Economics of a preschool – Franchise Model
Franchisee model
the
most favoured…
 A few preschool chains (Kangaroo Kids going in for JVs with developers and Tree House with largely
owned schools), all other players have opted for the franchisee model to scale up.
 Under this model, a franchisee has to pay a brand/ franchisee fee (Rs60,000-70,000 pa) as also
some part of the revenues to the franchisor (~20% of total) in lieu of using the latter’s brand name
and for the handholding required to run a preschool.
Economics – Assumptions
Area (sq. ft) 1200
Rent (Rs per sq. ft) 70
3 classrooms @ 250 sq. ft 750
Activity room/ Play area 300
Reception 100
Pantry 50
One-time capex
Furniture and fittings (Rs) 400,000
Misc expenditure 100,000
Total (in Lakhs) 500,000
 Assuming a model premise of 1,200 sq. ft with rent at Rs70 per sq. ft. (Only 60% of the total area can be used for
classrooms and a minimum of 10-15 sq.ft per student is considered optimal).
 The one-time capex broadly comprises furniture and fittings cost and excludes brand fee ( assumed an average
franchisee fee of Rs200,000, which is renewable every three years and amortized over a period of three years).
 Assumed three classes and two batches a day, which translates into a maximum capacity of 20 students per class
(thereby a maximum of 120 students per preschool) and an annual fee of Rs25,000. ( varies from Rs 20k to 40k)
Assumptions
Revenue model – Franchise Model
Particulars Occupancy
(Rs m) 70% 80% 90% 100%
No. of students 84 96 108 120
Revenues @max capacity of
20 per class
2.1 2.4 2.7 3
Expenses
Less Personnel Cost 0.35 0.4 0.44 0.49
Less Administrative &
Marketing Expenses
0.25 0.25 0.25 0.25
Less Royalty payable @ 20 0.42 0.48 0.54 0.6
Less Franchisee Fee -
Amortized
0.07 0.07 0.07 0.07
Less Rent 1.01 1.01 1.01 1.01
Operating profit 0 0.2 0.39 0.58
EBITDA margin (%) - 8 14 19
RoCE (%) - 39 77 116
GAINING IMPORTANCE OF DAYCARE
Market Size
 Caters to 1.5-3 yrs age group
 Preschool market in India is valued at Rs 43 billion in FY10
 The market is expected to reach Rs 133 billion by FY15 – growing at a 20.6 % annually
 Highly fragmented and unorganized with only 8-10 organized players operating currently
 Organized segment accounts for 11 % of the total preschool market
o The largest chain of preschools in India comprises of just 550 schools, less than 4% of the total
market potential of 15,000 preschools in 2010
Robust growth in Preschool + DayCare Industry
Children Education Segment
Pre-schools
Segments
DayCare Center
Robust growth in Preschool Industry is creating the market for Daycare Center which
is still untapped
Untapped Opportunity: Daycare Center
Drivers &
Challenges
Drivers
Very low penetration levels today, gaining in
popularity among young, working/professional
parents, participation in the segment is limited,
with only 1% of pre-school age enrolled.
 Highly untapped market
 Nuclear family and working parents
Challenges
 Lack of awareness on the requirement
 Operational challenges including availability of
quality personnel
 Target audience is limited to a 2km radius
 Preschools has started proving daycare services
Competition
Overview
 Interested players are already moving in to
capture the growth potential by providing
daycare services with preschool offering – one
stop solution.
Key Players -
 Little Millennium
 New Schools
Daycare Center Market is opening
Running a Daycare Center
Essential Factors
Ayahs 1:10 ayah student ratio
Neighborhood Choosing the right neighborhood for setup
Activity
Day care and activity center for extra-
curriculum
Distinct Learning Through Digital Content
Teacher Training Extensive and ongoing teacher training
Brand Awareness Initial brand awareness gimmicks
Open Spaces Large open spaces
Parent Involvement Parent involvement
Positive world of mouth Positive word of mouth
R&D R&D team
Small Batches 1:10 teacher student ratio
Standardization
Standardized ambience for all franchisees
(infrastructure, course and supplies)
Children Needs
This is a critical period in a
child’s life when specific types of
learning take place. The brain is
especially receptive to
stimulation in the area of
language, for example, during
the first three years. Therefore,
children that are exposed to
speech (talking, reading,
singing, etc) on a regular basis,
exhibit language skills that far
exceed those with little verbal
stimulation.
DayCare Center Service Offerings
 14 Hours Creche Service & Play School
 Fully Air conditioned
 Fire safety devices.
 14 hrs activities are monitored by CCTV cameras in all
the rooms
 Brain teasing games
 Internet facility under supervision
 14 hrs Satellite television channels with CD
and DVD facility
 Well Trained Staffs
 Pick and drop your child at any time .
 Standby power backup
 Transport facility available
XYZ – Business Descriptions
Program Details
S No. Program Age Group
01 Mom & me (Mother & Child Prog. ) 90 min module, thrice a week) 1 Y -2Y
02 Infants 1 Y – 1 Y 6 M
03 Toddlers 1 Y 6 M – 2Y 6 M
04 Pre- Nursery 2 Y 6 M – 3 Y 6 M
05 Nursery 3 Y 6 M – 4 Y 6 M
Ayahs: Children Ratio 1 : 6
FEE Details
PARTICULARS Residents Indian NRI/Expats
One time Joining Fee and Deposit
Registration & Admission Fee 10,000 12,000
Security Deposit (Refundable) 10,000 12,000
Recurring Fee Payable quarterly
Composite Fee – Mom & Me (Thrice a week) 21,000 25,500
Composite Fee, all other Programs: Regular Time, 9am -12 am 24,000 28,500
Composite Fee, all other Programs: Regular Time, 8:30 - 6 pm 36,000 43,500
Meal Charges: Regular Time, 9 am – 12 noon 1,500 1,800
Meal Charges: Extended Time, 8:30 am – 6:00 pm 6,000 7,200
Planning to add Pick and Drop facilities Rs 2500 monthly
ABC– Business Descriptions
Program Details
S No. Program Adult : Child Ratio Age Group
01 Infant Programs 1:2 10th month onwards
02 Toddlers Programs 1:3 18th month onwards
03 Pre-school Programs 1:8 21/2 upwards
04 Holiday Camps
05 Special Education Needs
06 After School Activities (Day Care)
FEE Details – Day care + Play school
PARTICULARS Residents Indian
One time Joining Fee and Deposit
Registration & Admission Fee 10,000
Security Deposit (Refundable) 5,000
Maintenance 5,000
Recurring Fee Payable quarterly
Monthly Fees for Day care + play school ( 9am – 6 pm) 10,000
Meal Charges 2,000
Extra Charges after 6 pm 700 per hour
STRATEGIC GAP ANALYSIS
Gap Analysis
8:30 AM TO 8:00 PM Working Parents are looking for
service which is beyond 8:00 pm
Pre-school Service Offerings Growing needs of Parents
Parents drops and Picks Students
Room for services provider to
create a niche by providing drop
and pick facilities
1.5-3 yrs age group 1.5 years to 6 years
Limited to Schools only
Other additional services such as
after school Tuitions
Live Telecast is not available Live Telecast
Timings
Logistics
Larger Age
Group
Service Areas
Service Areas
GURGAON
गुड़ग ांव
Overview
 Gurgoan is the second largest city in the Indian state of Haryana and industrial and financial
center of Haryana as well as one of India's major outsourcing hubs
 Located 30 km south of national capital New Delhi, about 10 kilometers from Dwarka Sub
City and 268 km south of Chandigarh, the state capital.
 Gurgoan is one of Delhi's four major satellite cities and is part of the National Capital Region.
Particulars Figures Comment
Population (2011 Census Data ) 15,14,085 a 73.93% increase in Gurgoan population in the last
10 years.
Male population 8,17,274
Male Literacy Rate 90.27%
Female population 6,96,811
Female Literacy Rate 77.64%
Male to Female Ratio 853 females per 1,000 males In 2001, 850 females against 1,000 males
Population density 573 per square km in 2001-2011 478 per sq km in 1991-2001
Per capita Income Rs 1,22,212 in 2010 3rd highest per capita income in India
after Chandigarh and Mumbai
Employment Growth Rate 11%
Credit growth rate 25% 2nd highest
PRESCHOOL + DAYCARE FACILITIES
DayCare Center
VALUEPROPOSITION
Philosophy
Objective
To Start a day & night care in addition to preschools facilities where
parents leave their children when they are not around
Target market
Double income i.e. working parents living in nuclear families who do not
have a safe place to park their kids.
To provide a happy, secure and welcoming environment to every child
and build a positive partnership between home and nursery, when their
parents are at work
DayCare Center Strategy
Services
Tuition services (the school going kids)
Pick and drop facilities to such school going kids can also be examined
Creche is an option that is being offered to families in order that they may
carry on their work knowing that their children are well cared for.
Day and Night care services according to the needs of parents.
It is a home away home for your kids with play way method learning
Other
Services
Management Vision
Management Vision
 To Start a day & night care in addition to
preschools facilities where parents leave
their children when they are not around
 Build State of Art Preschool and Daycare
facilities
 Provide wide ranges of services to
Children Education Segment mainly in the
age group of 1.5 to 6 years
 After achieving success in the test market
(Gurgoan), expand in India through
Franchise Model
 Plan for an IPO once clocking a
substantial revenue
Focus Areas
 Preschool: Adopt based practices from
Indian and foreign based preschools concepts
for child development
 Daycare: Provide State of Art daycare
facilities by providing all the needs of the
parents
 After school Service: Facilities like tuitions
will be provided
 Learning Methods: Best learning methods
and concepts will be part of the curriculum
 Other services like pick and drop and night
care facilities will provide substantial revenue
Theme of the Preschool and Daycare - Why Waldorf
and Vedic?
 Education in our materialistic society focuses on the intellectual aspect of the human being .It
has chosen largely to ignore the several other parts that are essential to our well being.
 These include our life of Feelings (emotions, aesthetics and social sensitivity) and Will Power
(the ability to get things done) and our moral nature (being intuitive about right and wrong).
 Without having these developed , we are incomplete- a fact that may become obvious in our
later years , when a feeling of “Emptiness” begins to set in.
 Waldorf and Vedic approach in our curriculum bridges this gap .The practical and artistic
approach in the pedagogy nurtures a sensibility that is essential in achieving a preparation for
“Life” in the real world.
Building on being Vedic and Waldorf Inspired…..
 The Fourfold nature of Man
 Inspiration
 Understanding the length, width and the depth
of Maturation
 Phases of child development and pedagogy
 Lesson Planning at 3 realms
 The Only Book
 Education and Medicine
 Educational Influence and Medical disposition
 12 Senses
 The Sacred Space (The Classroom)
 Power Relationship
 The Classroom
 The threefold social order
 Soul food – The Living Kitchen
 Parenting Pathway
Vedic and Waldorf Inspired Indian Curriculum
(The growth from a seed, plant, tree, flowers, fruits)
(Preparing the Soil and Environment)- The Core Team
 Phase 1(The Seed)
Home Program( Day & Night Child Care Program) and
Preschool
 (Phase 2(The Plant)
Nursery & Kindergarten Program
 Phase 3(The Tree)
Elementary Program
 Phase 4 (The Flower)
Middle School Program
 Phase 5(The Fruit)
High School Program
Standalone: Revenue Streams
Revenues
Non – Refundable Fees
Night Care for 4 hours
Meal
Pick up & Drop
Infant & Toddlers
Programs
Rs 10,000 per month
Rs 12,500 per month
Rs 5000 per month
Rs 2,000 per month
Rs 2,500 per month
After school Tuitions Rs 3000 per month
Preschool + Daycare
Rs 10,000 per month
Standalone: Revenue Streams
Revenue Break in %
Revenue
Non- Refundable Fees 1,500,000 900,000 300,000 972,000 972,000
Preschool + Daycare - 8 hours Service 12,600,000 20,160,000 22,680,000 27,216,000 27,216,000
Infant & Toddlers Programs 8,100,000 12,960,000 15,552,000 15,552,000 15,552,000
Night Care 2,700,000 5,760,000 8,100,000 9,720,000 9,720,000
Pick and Drop Revenue (Rs) 2,250,000 6,048,000 9,072,000 10,368,000 11,664,000
After School Tutions 1,620,000 4,608,000 6,480,000 8,100,000 8,100,000
Meal Income 2,880,000 5,760,000 7,776,000 9,072,000 10,368,000
Total Revenue 31,650,000 56,196,000 69,960,000 81,000,000 83,592,000
5% 2% 0.4% 1% 1%
40%
36% 32.4% 34% 33%
26%
23%
22.2% 19% 19%
9%
10%
11.6% 12% 12%
7%
11% 13.0% 13% 14%
5% 8% 9.3% 10% 10%
9% 10% 11.1% 11% 12%
Year 1 Year 2 Year 3 Year 4 Year 5
Meal Income
After School Tutions
Pick and Drop Revenue (Rs)
Night Care
Infant & Toddlers Programs
Preschool + Daycare - 8 hours Service
Non- Refundable Fees
Standalone: Cost and Capex Structure
Cost
Personnel Cost
Rent
Meal
Pick up & Drop
Administrative &
Marketing Expenses
20% of the Revenue
10% of the Revenue
40% of the Revenue
2% of the Revenue
5% of the revenue
Capex
Fixture and Fittings
Equipments & misc items
Transport
Rs 7.5 Lakhs
Rs 10.2 Lakhs
Rs 20 Lakhs
Rent
Rs 6.0 Lakhs
Standalone: Revenue and P&L
2012 E 2013 E 2014 E 2015 E 2016 E
Mar-12 Mar-13 Mar-14 Mar-15 Mar-16
Revenue
Non- Refundable Fees 1,500,000 900,000 300,000 972,000 972,000
Preschool + Daycare - 8 hours Service 12,600,000 20,160,000 22,680,000 27,216,000 27,216,000
Infant & Toddlers Programs 8,100,000 12,960,000 15,552,000 15,552,000 15,552,000
Night Care 2,700,000 5,760,000 8,100,000 9,720,000 9,720,000
Pick and Drop Revenue (Rs) 2,250,000 6,048,000 9,072,000 10,368,000 11,664,000
After School Tutions 1,620,000 4,608,000 6,480,000 8,100,000 8,100,000
Meal Income 2,880,000 5,760,000 7,776,000 9,072,000 10,368,000
Total Revenue 31,650,000 56,196,000 69,960,000 81,000,000 83,592,000
Expenses
Advisory Grop (5,700,000) (6,600,000) (7,300,000) (8,000,000) (8,700,000)
Governess (232,500) (408,000) (526,500) (545,400) (591,300)
School Rent (4,800,000) (4,800,000) (4,800,000) (4,800,000) (4,800,000)
Books and Periodicals (60,000) (60,000) (60,000) (60,000) (60,000)
Stationery (100,000) (200,000) (300,000) (400,000) (500,000)
Adminstrative & Marketing Expenses (3,165,000) (5,619,600) (6,996,000) (4,050,000) (4,179,600)
Meal Expense (50% of the Meal Revenue) (1,440,000) (2,880,000) (3,888,000) (4,536,000) (5,184,000)
Pick and Drop (50% of Pick & Drop Revenue) (1,125,000) (3,024,000) (4,536,000) (5,184,000) (5,832,000)
Electricty (400,000) (400,000) (400,000) (400,000) (400,000)
Total Expenses (17,022,500) (23,991,600) (28,806,500) (27,975,400) (30,246,900)
EBITDA 14,627,500 32,204,400 41,153,500 53,024,600 53,345,100
EBITDA Margin 46% 57% 59% 65% 64%
Depereication (440,000) (331,500) (249,825) (188,329) (142,015)
EBIT 14,187,500 31,872,900 40,903,675 52,836,271 53,203,085
Tax at 35% (4,965,625) (11,155,515) (14,316,286) (18,492,695) (18,621,080)
Net Profit 9,221,875 20,717,385 26,587,389 34,343,576 34,582,006
Profit & Loss A/C
Rollout Plan
Year 1 Year 2 Year 3 Year 4 Year 5 Year 6
Franchise
Model
No
Franchise
5 Tier I
cities –
Targeted
cities will be
identified
20 Tier II
cities + 10 in
Tier I cities –
Targeted
cities will be
identified
15 in Tier II
cities + 10 in
Tier I cities –
Targeted
cities will be
identified
15 in Tier II
cities + 10 in
Tier I cities –
Targeted
cities will be
identified
15 in Tier II
cities + 10 in
Tier I cities –
Targeted
cities will be
identified
Company
Owned
1 2 Tier I cities 5 Tier I cities 5 Tier I cities 5 Tier I cities 5 Tier I cities
THANK YOU

Pre-School Model - Day Care Center

  • 1.
  • 2.
  • 3.
    Private education sectoris estimated to be an INR ~2200 bn opportunity (2010) 1,752 1,980 2237 2628 2867 2008 2009 2010e 2011e 2012e Market Size (in bn Rs) Actual  India is one of the largest education networks with ~1.3 mn schools and ~18,000 higher education institutes estimated to be operational in 2009  Indian education sector is estimated at INR 3,550 bn comprising a public sector spending of INR 1,350 bn and private sector estimated to be an INR 2,200 bn opportunity  With government opting for private sector participation in the development of education infrastructure, the future opportunity for private sector is considered substantial Forecasted
  • 4.
    Education is expectedto take a growing share of total consumer spending in India 3% 6% 6% 9%4% 8% 9% 11% 56% 42% 34% 25% 4% 7% 9% 13% 16% 15% 15% 13% 12% 17% 22% 24% 5% 6% 5% 6% 1996 2006 2016F 2026F Education and recreation Personal products and Services Food & beverages Healthcare Housing and household products Comm and Transport Apparel With rising disposable income and increased share of education in the consumption basket, private education sector is expected to be a key beneficiary of India’s growth story  India has a growing middle class driving growth in demand for private education  Currently households in India spend less than 5% of disposable income on education compared to 12% in US and 15% in China  Household spending on education has seen a growth CAGR of 8.6% versus consumption growth of 3.2% over 1995-2005  Private education though relatively expensive, is perceived as ‘quality’
  • 5.
    The formal educationspace is regulated and has a dominant share in the overall education market Education Sector Formal Education Informal Education K-12 Higher Education Coaching Institutes Pre-schools Vocational Education Regulations  Largely unregulated  There are no constraints on profit making in the pre-school system  Vocational training institutes under the government are regulated by the Ministry of Labor and Employment, while those in the private sector are unregulated  Under the purview of the Ministry of Human Resource Development  K-12 is governed by different schooling boards -State / ICSE/ CBSE/ IB  Higher education* regulated by University  Grants Commission (UGC) and All India Council of Technical Education (AICTE) MarketSize(inbn) $20 $34 2008 2012E 14% $6.50 $10.30 2008 2012E 12% $0.8 6 $2.6 6 2010 2016E 12% $1.6 0 $14. 00 2008 2012E 25% $0.3 $0.6 2008 2012E 17%
  • 6.
    Trends : Pre-schoolsare looking at revenue enhancement through geographic expansion  Many corporate houses have / are planning to set up their own chain of pre-schools - Pre schools are viewed as attractive investment opportunities due to the growth potential  For e.g. Alphakids set up by Camlin group and Globe Tot’ers by Yash Birla group Entry of Big Corporates Joint Ventures with Builders  Increasingly preschools are forming joint ventures with builders.  Partnering with builders helps in imparting flexibility in the business against high lease rentals  AEZ group and Mothers s Pride entered into a JV for a Preschool Upgrade to K 12  Preschool chains are moving up the value chain by upgrading to K-12 schools to ensure scalability for preschool firms  Kidzee, Euro Kids and Kangaroo Kids are upgrading to K-12 schools and a large majority of their preschool population is expected to be the potential customers for K-12  Demand and affordability is increasing in small towns with the growing awareness among people about the need to send children to preschools  Euro kids plans to add 1000 pre schools in medium term with Tier II and Tier III cities as growth drivers Expansion to Tier I & Tier II Cities Leveraging Infrastructure for economic viability  In order to maximize space utilization, preschools are leveraging the existing infrastructure to generate additional revenues  Additional programmes are being offered in the same premise in order to allow higher utilization of the infrastructure
  • 7.
    Types of Preschools: Concepts Traditional Montessori Waldorf Sri Aurobindo and Mother Alternative International Emphasis on bookish knowledge, lectures, homework and tests. Teaching according to the child’s initiatives. The method discourages tests and grades and believes in feedback through skills, activities or a narrative of the child’s achievements, strengths and weaknesses, etc. Takes its cues as the child develops. Till age seven the child is a creature of will, from 7-14 years the feelings predominate and from 14 to 21 years, the thinking capacity is the strongest. Stress on artistic elements like song, color, kinesthetic, etc during elementary days. Follows the philosophy of ‘Free Progress’. Each child develops in a spontaneous and self directed process. Children learn at their own pace. The environment is fluid with little hierarchy. It may not follow the national examination system. Learning is not only for knowledge but also to build character. Focuses on IQ, EQ and SQ for all-round development of child. A blend of technology, culture and innovation is used for teaching. It is learning by doing.
  • 8.
    Preschool Business: Positiveand Negatives  Rapid proliferation  Capex requirements are also relatively lower Positive  Inability to attract preschoolers beyond a catchment area of 2km, high lease rentals, intense competition from the unorganized segment (at considerably lower cost to customer) and increasing competition among organized players. Risk ...proliferation largely driven by housewife occupation and low capex requirement (levering existing premises) Preschools have a limited target area – maximum of 2km radius (parents prefer to send toddlers within a limited radius for safety/ comfort reasons). Customers who can afford annual fees of Rs20,000-45,000, which further limits the scope of the market. Soaring rental costs – mounting pressure on cost structures City Increase (%) Average rent (Rs/ sq. ft/ month) Bangalore 15-20 27-70 Mumbai 45-60 290-400 Delhi 35-70 159-317 Chennai 15-30 33-65 Kolkatta 30-55 45-85 Hyderabad 10-45 35-50 Gurgaon 70-75 110-120 Noida 18-20 45-50 Mumbai Suburban 70-75 70-160 Pune 15-40 30-70 The economics of the preschool business, lease rent forms the largest expense for running a preschool and can eat into profitability of the business
  • 9.
    Economics of apreschool – Franchise Model Franchisee model the most favoured…  A few preschool chains (Kangaroo Kids going in for JVs with developers and Tree House with largely owned schools), all other players have opted for the franchisee model to scale up.  Under this model, a franchisee has to pay a brand/ franchisee fee (Rs60,000-70,000 pa) as also some part of the revenues to the franchisor (~20% of total) in lieu of using the latter’s brand name and for the handholding required to run a preschool. Economics – Assumptions Area (sq. ft) 1200 Rent (Rs per sq. ft) 70 3 classrooms @ 250 sq. ft 750 Activity room/ Play area 300 Reception 100 Pantry 50 One-time capex Furniture and fittings (Rs) 400,000 Misc expenditure 100,000 Total (in Lakhs) 500,000  Assuming a model premise of 1,200 sq. ft with rent at Rs70 per sq. ft. (Only 60% of the total area can be used for classrooms and a minimum of 10-15 sq.ft per student is considered optimal).  The one-time capex broadly comprises furniture and fittings cost and excludes brand fee ( assumed an average franchisee fee of Rs200,000, which is renewable every three years and amortized over a period of three years).  Assumed three classes and two batches a day, which translates into a maximum capacity of 20 students per class (thereby a maximum of 120 students per preschool) and an annual fee of Rs25,000. ( varies from Rs 20k to 40k) Assumptions
  • 10.
    Revenue model –Franchise Model Particulars Occupancy (Rs m) 70% 80% 90% 100% No. of students 84 96 108 120 Revenues @max capacity of 20 per class 2.1 2.4 2.7 3 Expenses Less Personnel Cost 0.35 0.4 0.44 0.49 Less Administrative & Marketing Expenses 0.25 0.25 0.25 0.25 Less Royalty payable @ 20 0.42 0.48 0.54 0.6 Less Franchisee Fee - Amortized 0.07 0.07 0.07 0.07 Less Rent 1.01 1.01 1.01 1.01 Operating profit 0 0.2 0.39 0.58 EBITDA margin (%) - 8 14 19 RoCE (%) - 39 77 116
  • 11.
  • 12.
    Market Size  Catersto 1.5-3 yrs age group  Preschool market in India is valued at Rs 43 billion in FY10  The market is expected to reach Rs 133 billion by FY15 – growing at a 20.6 % annually  Highly fragmented and unorganized with only 8-10 organized players operating currently  Organized segment accounts for 11 % of the total preschool market o The largest chain of preschools in India comprises of just 550 schools, less than 4% of the total market potential of 15,000 preschools in 2010 Robust growth in Preschool + DayCare Industry Children Education Segment Pre-schools Segments DayCare Center Robust growth in Preschool Industry is creating the market for Daycare Center which is still untapped
  • 13.
    Untapped Opportunity: DaycareCenter Drivers & Challenges Drivers Very low penetration levels today, gaining in popularity among young, working/professional parents, participation in the segment is limited, with only 1% of pre-school age enrolled.  Highly untapped market  Nuclear family and working parents Challenges  Lack of awareness on the requirement  Operational challenges including availability of quality personnel  Target audience is limited to a 2km radius  Preschools has started proving daycare services Competition Overview  Interested players are already moving in to capture the growth potential by providing daycare services with preschool offering – one stop solution. Key Players -  Little Millennium  New Schools Daycare Center Market is opening
  • 14.
    Running a DaycareCenter Essential Factors Ayahs 1:10 ayah student ratio Neighborhood Choosing the right neighborhood for setup Activity Day care and activity center for extra- curriculum Distinct Learning Through Digital Content Teacher Training Extensive and ongoing teacher training Brand Awareness Initial brand awareness gimmicks Open Spaces Large open spaces Parent Involvement Parent involvement Positive world of mouth Positive word of mouth R&D R&D team Small Batches 1:10 teacher student ratio Standardization Standardized ambience for all franchisees (infrastructure, course and supplies) Children Needs This is a critical period in a child’s life when specific types of learning take place. The brain is especially receptive to stimulation in the area of language, for example, during the first three years. Therefore, children that are exposed to speech (talking, reading, singing, etc) on a regular basis, exhibit language skills that far exceed those with little verbal stimulation.
  • 15.
    DayCare Center ServiceOfferings  14 Hours Creche Service & Play School  Fully Air conditioned  Fire safety devices.  14 hrs activities are monitored by CCTV cameras in all the rooms  Brain teasing games  Internet facility under supervision  14 hrs Satellite television channels with CD and DVD facility  Well Trained Staffs  Pick and drop your child at any time .  Standby power backup  Transport facility available
  • 16.
    XYZ – BusinessDescriptions Program Details S No. Program Age Group 01 Mom & me (Mother & Child Prog. ) 90 min module, thrice a week) 1 Y -2Y 02 Infants 1 Y – 1 Y 6 M 03 Toddlers 1 Y 6 M – 2Y 6 M 04 Pre- Nursery 2 Y 6 M – 3 Y 6 M 05 Nursery 3 Y 6 M – 4 Y 6 M Ayahs: Children Ratio 1 : 6 FEE Details PARTICULARS Residents Indian NRI/Expats One time Joining Fee and Deposit Registration & Admission Fee 10,000 12,000 Security Deposit (Refundable) 10,000 12,000 Recurring Fee Payable quarterly Composite Fee – Mom & Me (Thrice a week) 21,000 25,500 Composite Fee, all other Programs: Regular Time, 9am -12 am 24,000 28,500 Composite Fee, all other Programs: Regular Time, 8:30 - 6 pm 36,000 43,500 Meal Charges: Regular Time, 9 am – 12 noon 1,500 1,800 Meal Charges: Extended Time, 8:30 am – 6:00 pm 6,000 7,200 Planning to add Pick and Drop facilities Rs 2500 monthly
  • 17.
    ABC– Business Descriptions ProgramDetails S No. Program Adult : Child Ratio Age Group 01 Infant Programs 1:2 10th month onwards 02 Toddlers Programs 1:3 18th month onwards 03 Pre-school Programs 1:8 21/2 upwards 04 Holiday Camps 05 Special Education Needs 06 After School Activities (Day Care) FEE Details – Day care + Play school PARTICULARS Residents Indian One time Joining Fee and Deposit Registration & Admission Fee 10,000 Security Deposit (Refundable) 5,000 Maintenance 5,000 Recurring Fee Payable quarterly Monthly Fees for Day care + play school ( 9am – 6 pm) 10,000 Meal Charges 2,000 Extra Charges after 6 pm 700 per hour
  • 18.
  • 19.
    Gap Analysis 8:30 AMTO 8:00 PM Working Parents are looking for service which is beyond 8:00 pm Pre-school Service Offerings Growing needs of Parents Parents drops and Picks Students Room for services provider to create a niche by providing drop and pick facilities 1.5-3 yrs age group 1.5 years to 6 years Limited to Schools only Other additional services such as after school Tuitions Live Telecast is not available Live Telecast Timings Logistics Larger Age Group Service Areas Service Areas
  • 20.
    GURGAON गुड़ग ांव Overview  Gurgoanis the second largest city in the Indian state of Haryana and industrial and financial center of Haryana as well as one of India's major outsourcing hubs  Located 30 km south of national capital New Delhi, about 10 kilometers from Dwarka Sub City and 268 km south of Chandigarh, the state capital.  Gurgoan is one of Delhi's four major satellite cities and is part of the National Capital Region. Particulars Figures Comment Population (2011 Census Data ) 15,14,085 a 73.93% increase in Gurgoan population in the last 10 years. Male population 8,17,274 Male Literacy Rate 90.27% Female population 6,96,811 Female Literacy Rate 77.64% Male to Female Ratio 853 females per 1,000 males In 2001, 850 females against 1,000 males Population density 573 per square km in 2001-2011 478 per sq km in 1991-2001 Per capita Income Rs 1,22,212 in 2010 3rd highest per capita income in India after Chandigarh and Mumbai Employment Growth Rate 11% Credit growth rate 25% 2nd highest
  • 21.
  • 22.
    DayCare Center VALUEPROPOSITION Philosophy Objective To Starta day & night care in addition to preschools facilities where parents leave their children when they are not around Target market Double income i.e. working parents living in nuclear families who do not have a safe place to park their kids. To provide a happy, secure and welcoming environment to every child and build a positive partnership between home and nursery, when their parents are at work DayCare Center Strategy Services Tuition services (the school going kids) Pick and drop facilities to such school going kids can also be examined Creche is an option that is being offered to families in order that they may carry on their work knowing that their children are well cared for. Day and Night care services according to the needs of parents. It is a home away home for your kids with play way method learning Other Services
  • 23.
    Management Vision Management Vision To Start a day & night care in addition to preschools facilities where parents leave their children when they are not around  Build State of Art Preschool and Daycare facilities  Provide wide ranges of services to Children Education Segment mainly in the age group of 1.5 to 6 years  After achieving success in the test market (Gurgoan), expand in India through Franchise Model  Plan for an IPO once clocking a substantial revenue Focus Areas  Preschool: Adopt based practices from Indian and foreign based preschools concepts for child development  Daycare: Provide State of Art daycare facilities by providing all the needs of the parents  After school Service: Facilities like tuitions will be provided  Learning Methods: Best learning methods and concepts will be part of the curriculum  Other services like pick and drop and night care facilities will provide substantial revenue
  • 24.
    Theme of thePreschool and Daycare - Why Waldorf and Vedic?  Education in our materialistic society focuses on the intellectual aspect of the human being .It has chosen largely to ignore the several other parts that are essential to our well being.  These include our life of Feelings (emotions, aesthetics and social sensitivity) and Will Power (the ability to get things done) and our moral nature (being intuitive about right and wrong).  Without having these developed , we are incomplete- a fact that may become obvious in our later years , when a feeling of “Emptiness” begins to set in.  Waldorf and Vedic approach in our curriculum bridges this gap .The practical and artistic approach in the pedagogy nurtures a sensibility that is essential in achieving a preparation for “Life” in the real world. Building on being Vedic and Waldorf Inspired…..  The Fourfold nature of Man  Inspiration  Understanding the length, width and the depth of Maturation  Phases of child development and pedagogy  Lesson Planning at 3 realms  The Only Book  Education and Medicine  Educational Influence and Medical disposition  12 Senses  The Sacred Space (The Classroom)  Power Relationship  The Classroom  The threefold social order  Soul food – The Living Kitchen  Parenting Pathway
  • 25.
    Vedic and WaldorfInspired Indian Curriculum (The growth from a seed, plant, tree, flowers, fruits) (Preparing the Soil and Environment)- The Core Team  Phase 1(The Seed) Home Program( Day & Night Child Care Program) and Preschool  (Phase 2(The Plant) Nursery & Kindergarten Program  Phase 3(The Tree) Elementary Program  Phase 4 (The Flower) Middle School Program  Phase 5(The Fruit) High School Program
  • 26.
    Standalone: Revenue Streams Revenues Non– Refundable Fees Night Care for 4 hours Meal Pick up & Drop Infant & Toddlers Programs Rs 10,000 per month Rs 12,500 per month Rs 5000 per month Rs 2,000 per month Rs 2,500 per month After school Tuitions Rs 3000 per month Preschool + Daycare Rs 10,000 per month
  • 27.
    Standalone: Revenue Streams RevenueBreak in % Revenue Non- Refundable Fees 1,500,000 900,000 300,000 972,000 972,000 Preschool + Daycare - 8 hours Service 12,600,000 20,160,000 22,680,000 27,216,000 27,216,000 Infant & Toddlers Programs 8,100,000 12,960,000 15,552,000 15,552,000 15,552,000 Night Care 2,700,000 5,760,000 8,100,000 9,720,000 9,720,000 Pick and Drop Revenue (Rs) 2,250,000 6,048,000 9,072,000 10,368,000 11,664,000 After School Tutions 1,620,000 4,608,000 6,480,000 8,100,000 8,100,000 Meal Income 2,880,000 5,760,000 7,776,000 9,072,000 10,368,000 Total Revenue 31,650,000 56,196,000 69,960,000 81,000,000 83,592,000 5% 2% 0.4% 1% 1% 40% 36% 32.4% 34% 33% 26% 23% 22.2% 19% 19% 9% 10% 11.6% 12% 12% 7% 11% 13.0% 13% 14% 5% 8% 9.3% 10% 10% 9% 10% 11.1% 11% 12% Year 1 Year 2 Year 3 Year 4 Year 5 Meal Income After School Tutions Pick and Drop Revenue (Rs) Night Care Infant & Toddlers Programs Preschool + Daycare - 8 hours Service Non- Refundable Fees
  • 28.
    Standalone: Cost andCapex Structure Cost Personnel Cost Rent Meal Pick up & Drop Administrative & Marketing Expenses 20% of the Revenue 10% of the Revenue 40% of the Revenue 2% of the Revenue 5% of the revenue Capex Fixture and Fittings Equipments & misc items Transport Rs 7.5 Lakhs Rs 10.2 Lakhs Rs 20 Lakhs Rent Rs 6.0 Lakhs
  • 29.
    Standalone: Revenue andP&L 2012 E 2013 E 2014 E 2015 E 2016 E Mar-12 Mar-13 Mar-14 Mar-15 Mar-16 Revenue Non- Refundable Fees 1,500,000 900,000 300,000 972,000 972,000 Preschool + Daycare - 8 hours Service 12,600,000 20,160,000 22,680,000 27,216,000 27,216,000 Infant & Toddlers Programs 8,100,000 12,960,000 15,552,000 15,552,000 15,552,000 Night Care 2,700,000 5,760,000 8,100,000 9,720,000 9,720,000 Pick and Drop Revenue (Rs) 2,250,000 6,048,000 9,072,000 10,368,000 11,664,000 After School Tutions 1,620,000 4,608,000 6,480,000 8,100,000 8,100,000 Meal Income 2,880,000 5,760,000 7,776,000 9,072,000 10,368,000 Total Revenue 31,650,000 56,196,000 69,960,000 81,000,000 83,592,000 Expenses Advisory Grop (5,700,000) (6,600,000) (7,300,000) (8,000,000) (8,700,000) Governess (232,500) (408,000) (526,500) (545,400) (591,300) School Rent (4,800,000) (4,800,000) (4,800,000) (4,800,000) (4,800,000) Books and Periodicals (60,000) (60,000) (60,000) (60,000) (60,000) Stationery (100,000) (200,000) (300,000) (400,000) (500,000) Adminstrative & Marketing Expenses (3,165,000) (5,619,600) (6,996,000) (4,050,000) (4,179,600) Meal Expense (50% of the Meal Revenue) (1,440,000) (2,880,000) (3,888,000) (4,536,000) (5,184,000) Pick and Drop (50% of Pick & Drop Revenue) (1,125,000) (3,024,000) (4,536,000) (5,184,000) (5,832,000) Electricty (400,000) (400,000) (400,000) (400,000) (400,000) Total Expenses (17,022,500) (23,991,600) (28,806,500) (27,975,400) (30,246,900) EBITDA 14,627,500 32,204,400 41,153,500 53,024,600 53,345,100 EBITDA Margin 46% 57% 59% 65% 64% Depereication (440,000) (331,500) (249,825) (188,329) (142,015) EBIT 14,187,500 31,872,900 40,903,675 52,836,271 53,203,085 Tax at 35% (4,965,625) (11,155,515) (14,316,286) (18,492,695) (18,621,080) Net Profit 9,221,875 20,717,385 26,587,389 34,343,576 34,582,006 Profit & Loss A/C
  • 30.
    Rollout Plan Year 1Year 2 Year 3 Year 4 Year 5 Year 6 Franchise Model No Franchise 5 Tier I cities – Targeted cities will be identified 20 Tier II cities + 10 in Tier I cities – Targeted cities will be identified 15 in Tier II cities + 10 in Tier I cities – Targeted cities will be identified 15 in Tier II cities + 10 in Tier I cities – Targeted cities will be identified 15 in Tier II cities + 10 in Tier I cities – Targeted cities will be identified Company Owned 1 2 Tier I cities 5 Tier I cities 5 Tier I cities 5 Tier I cities 5 Tier I cities
  • 31.