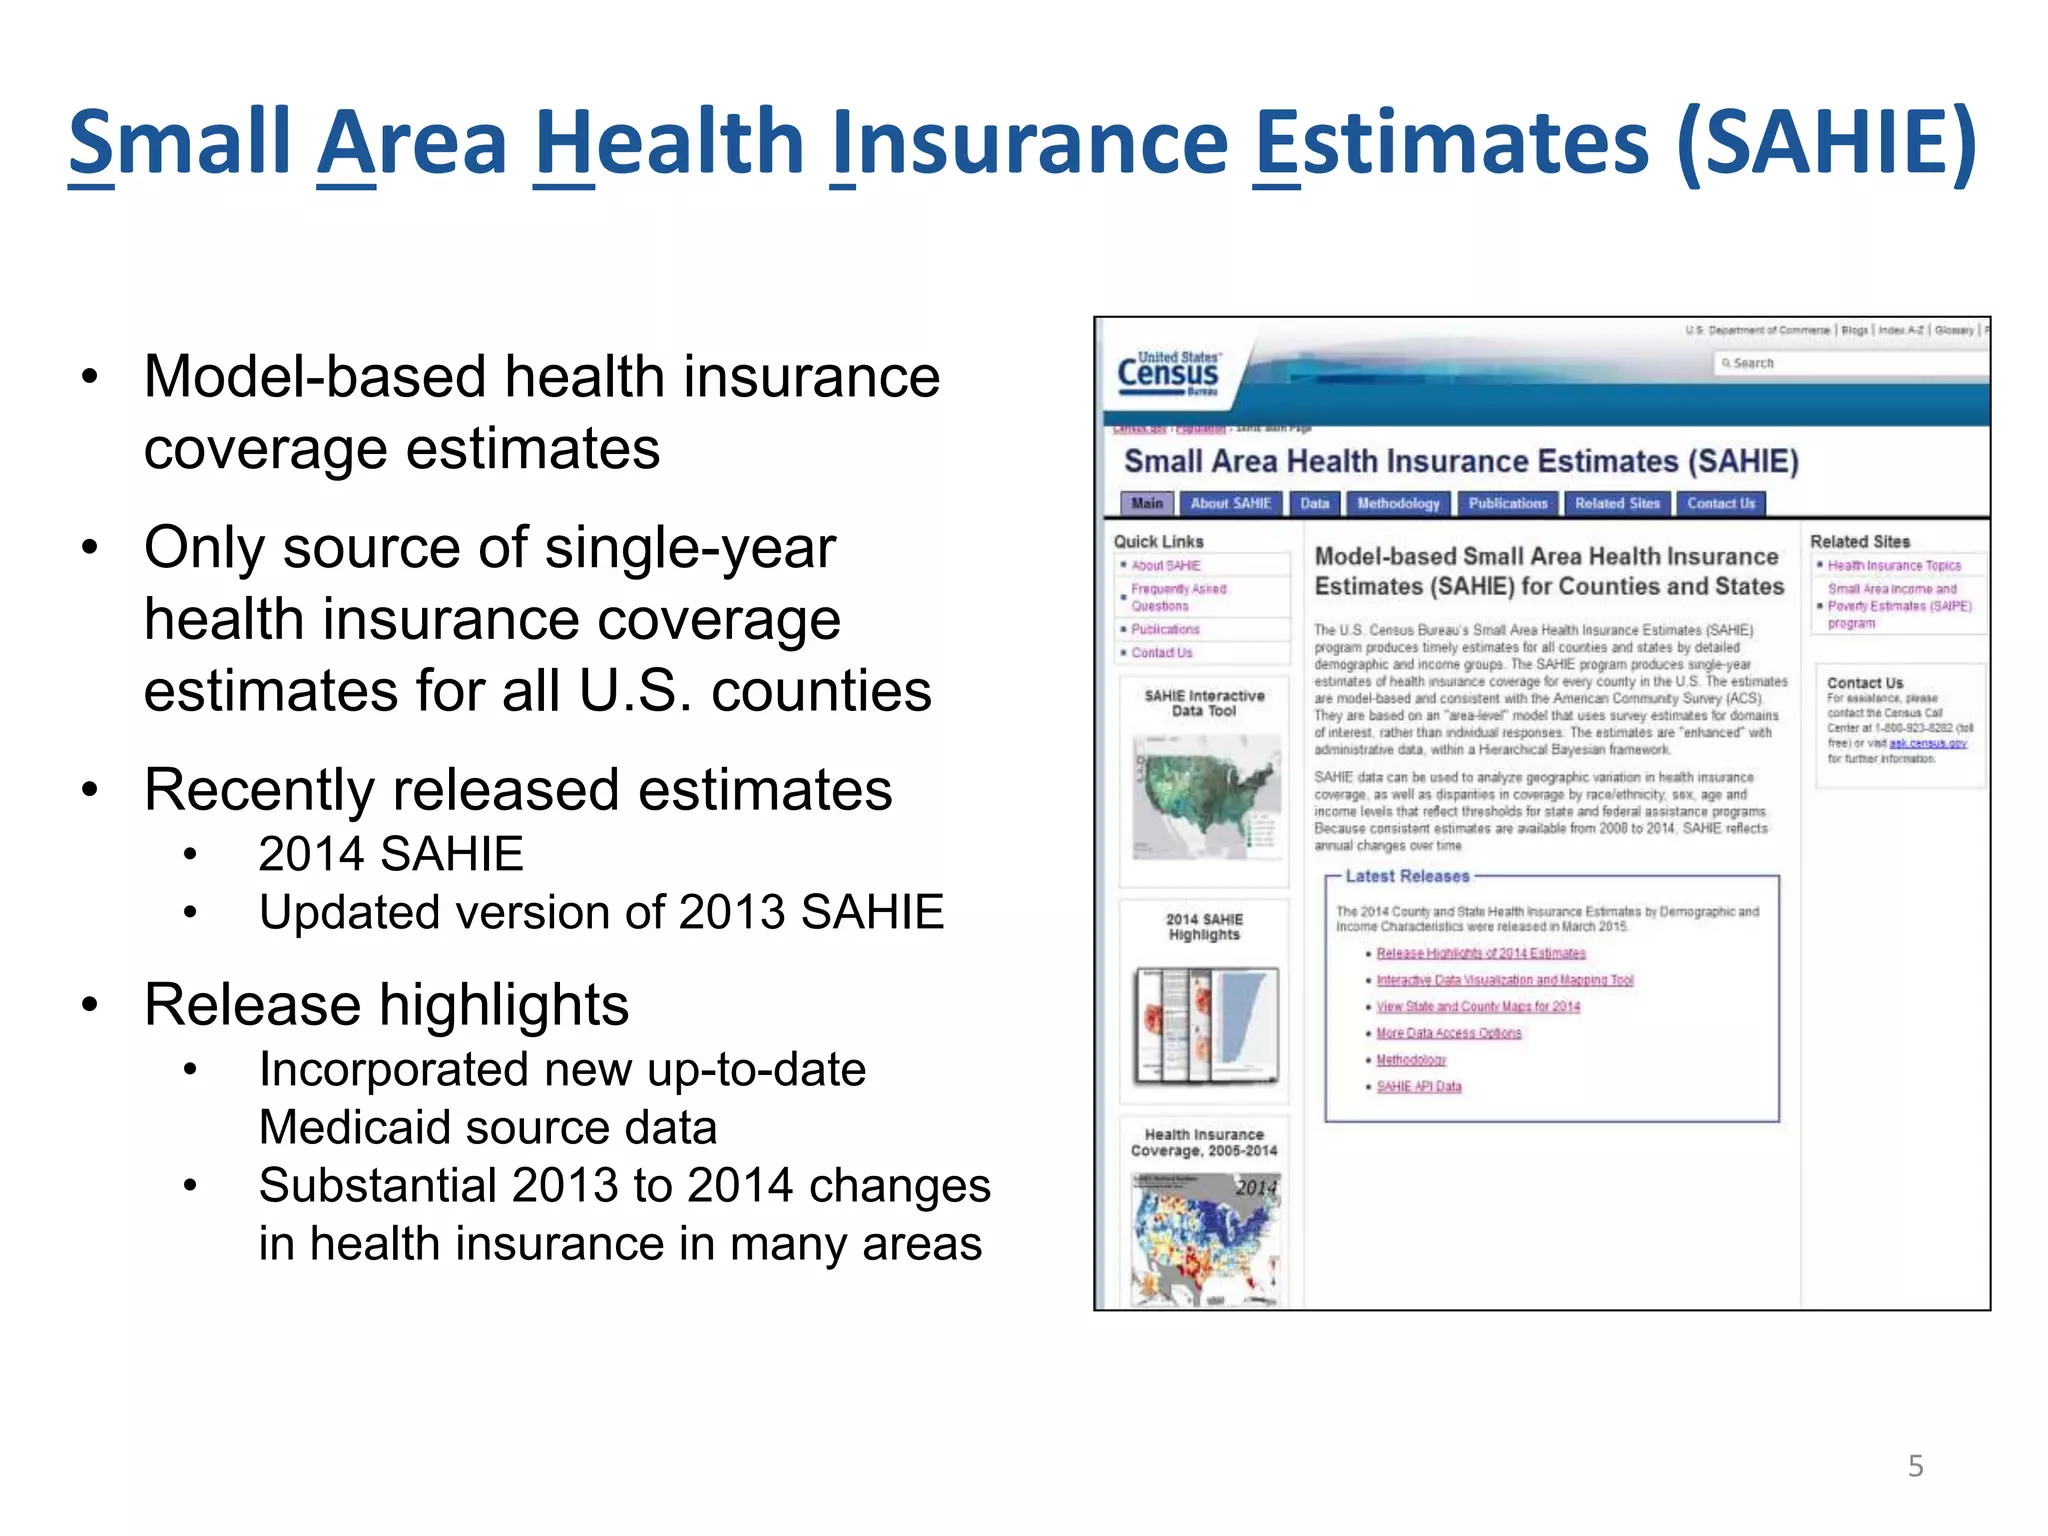
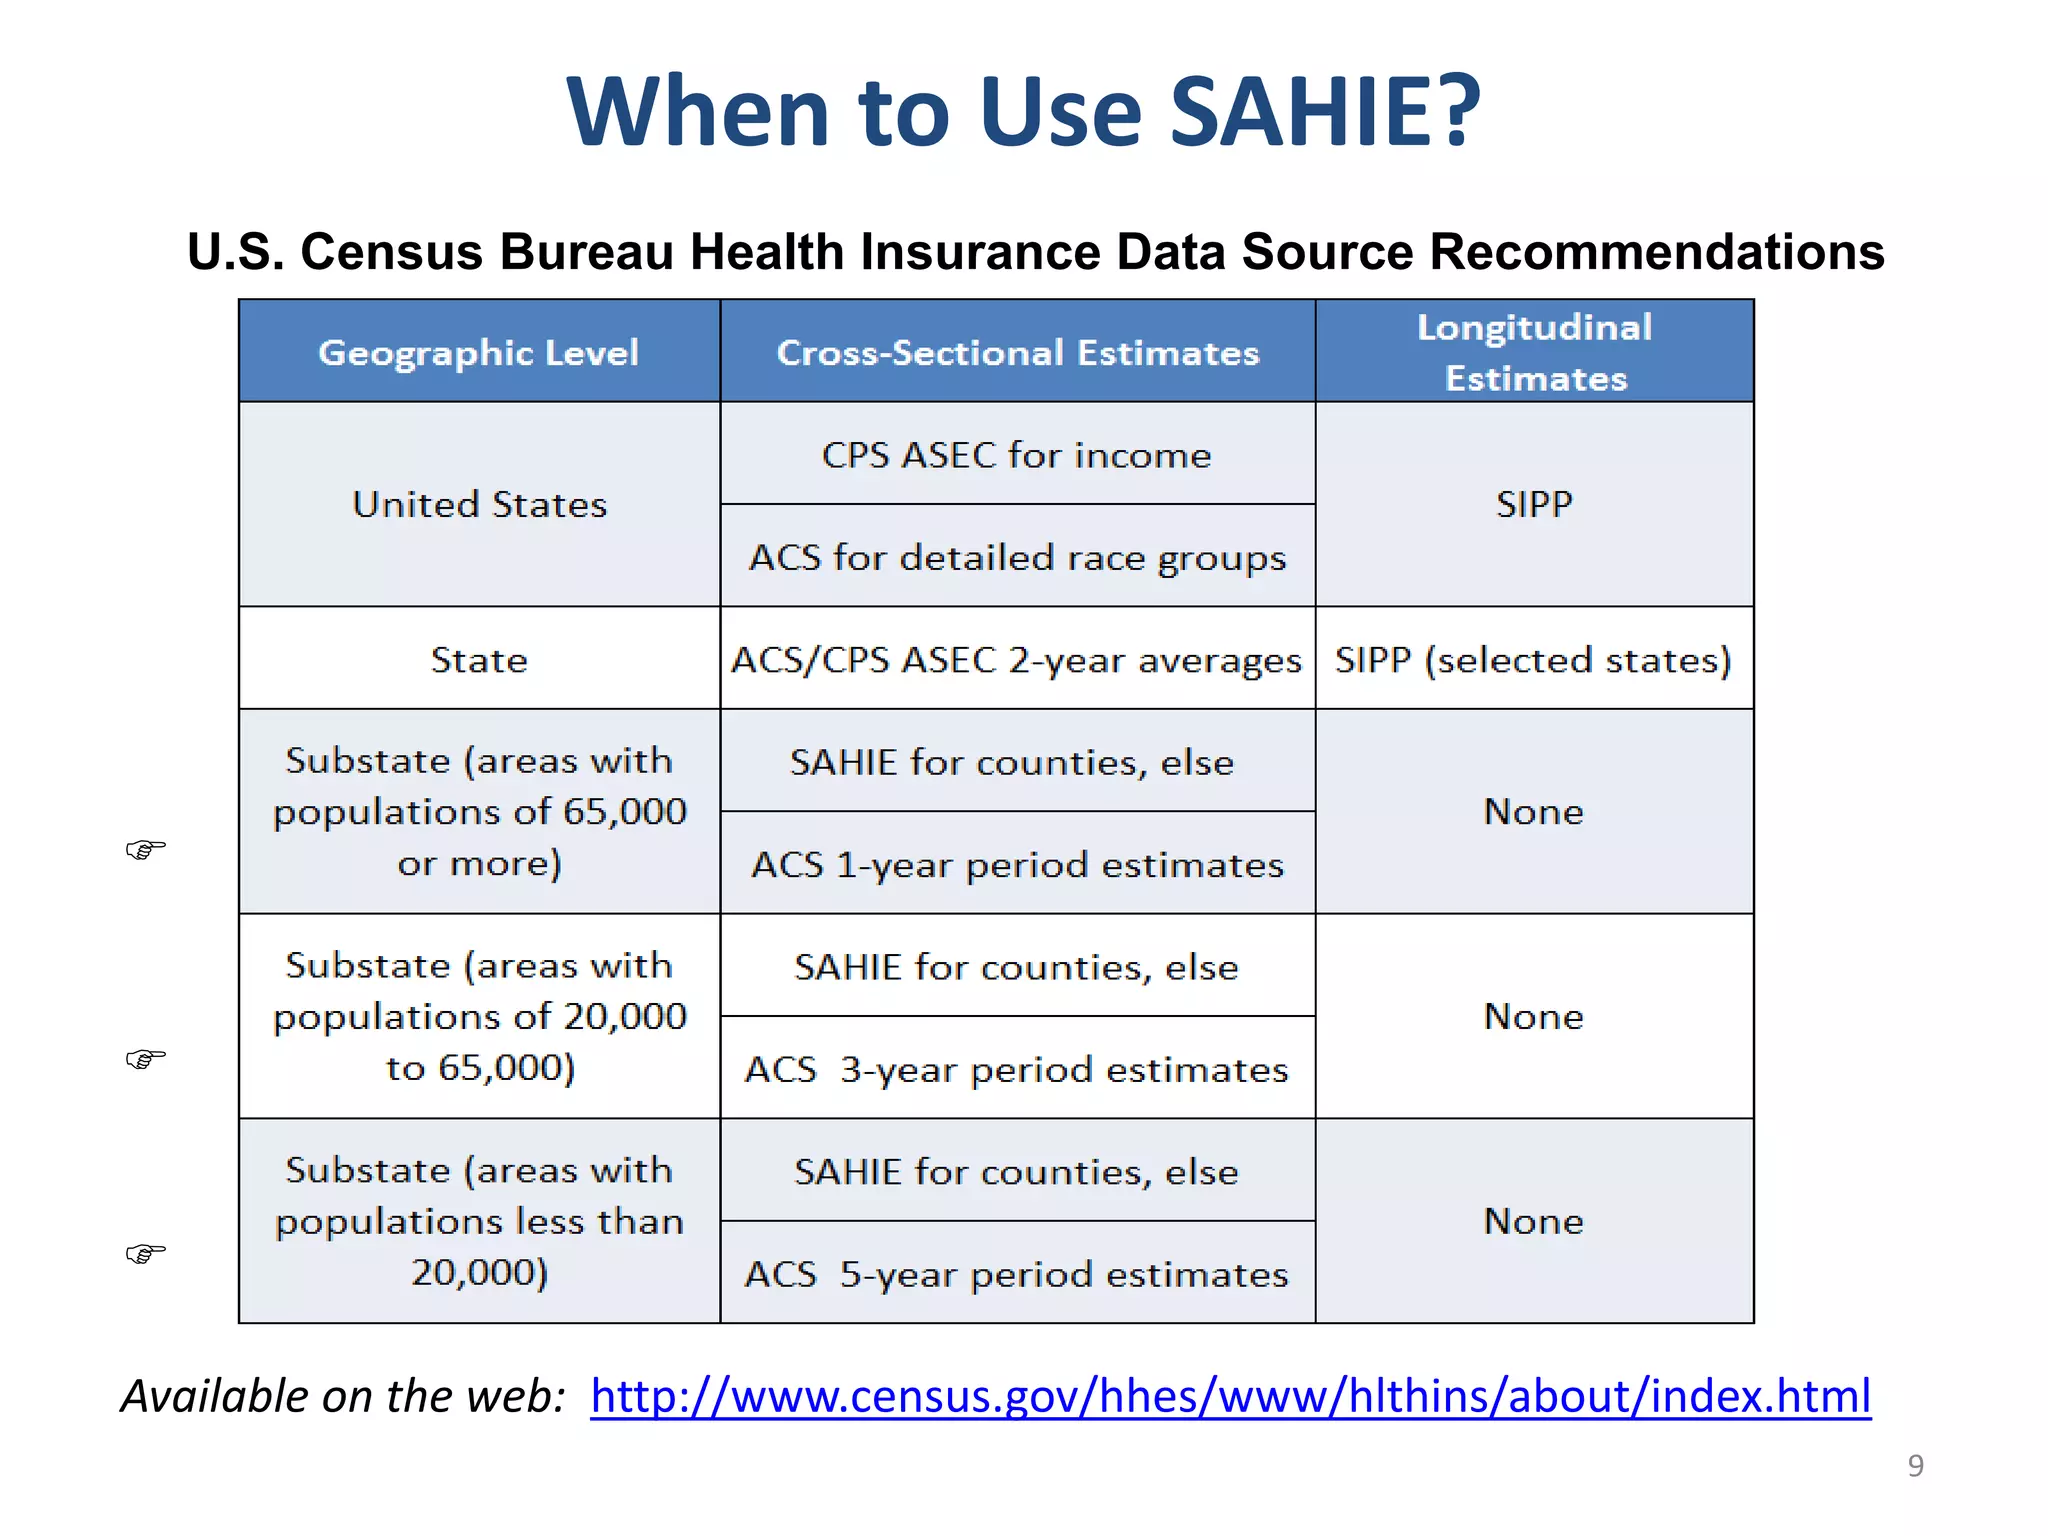
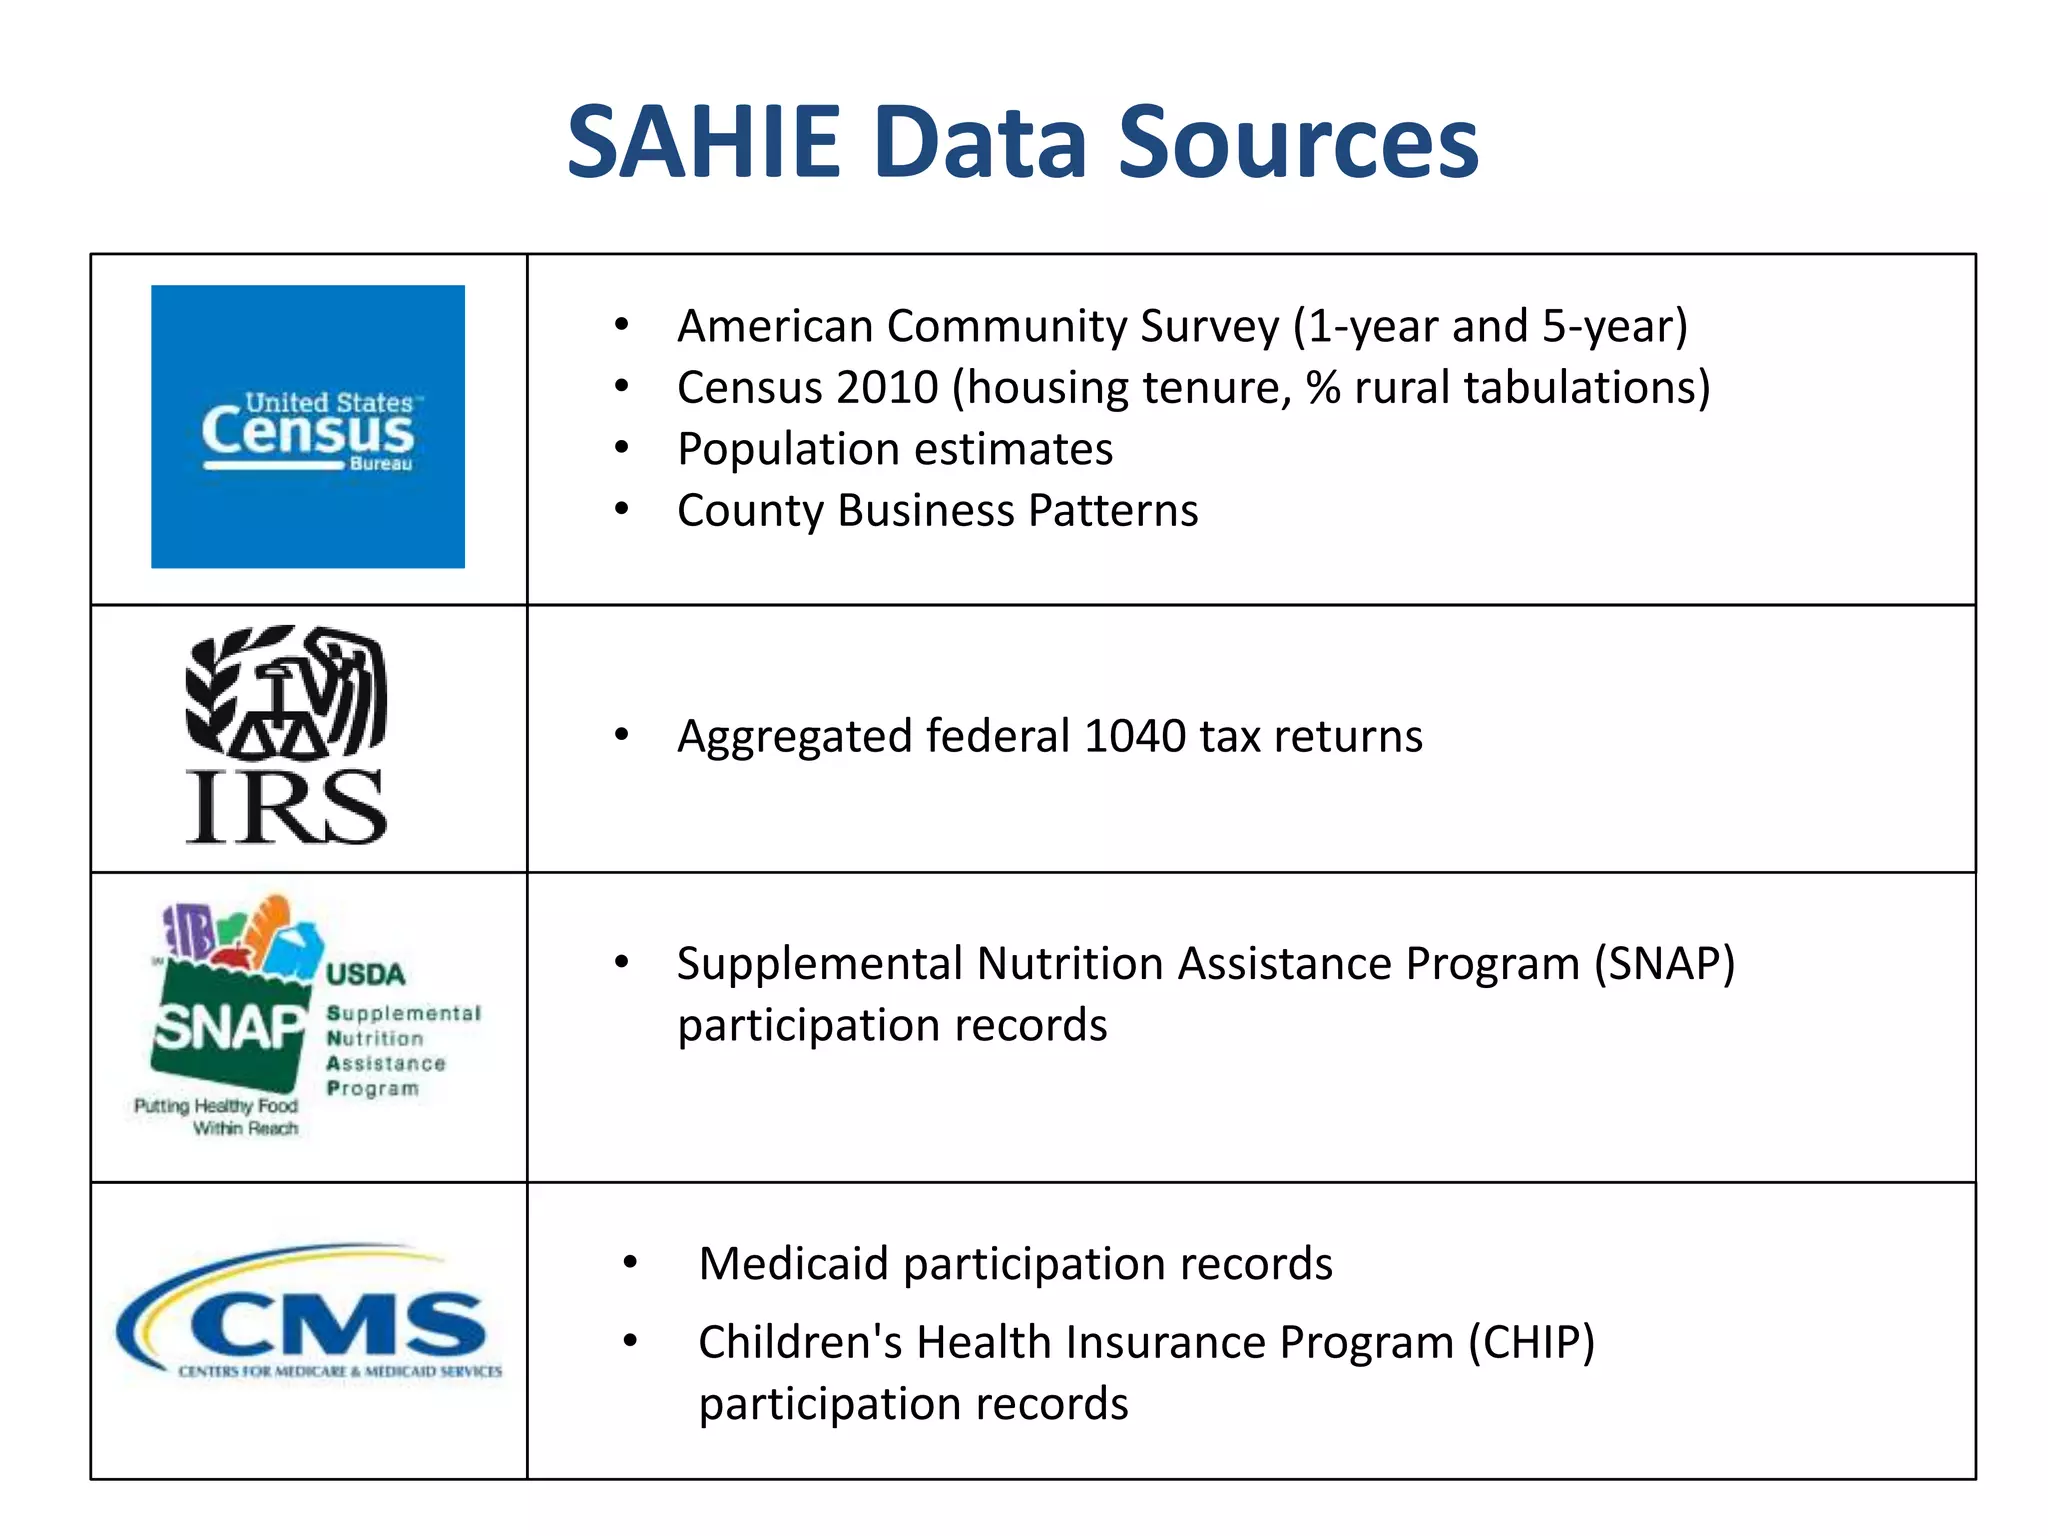
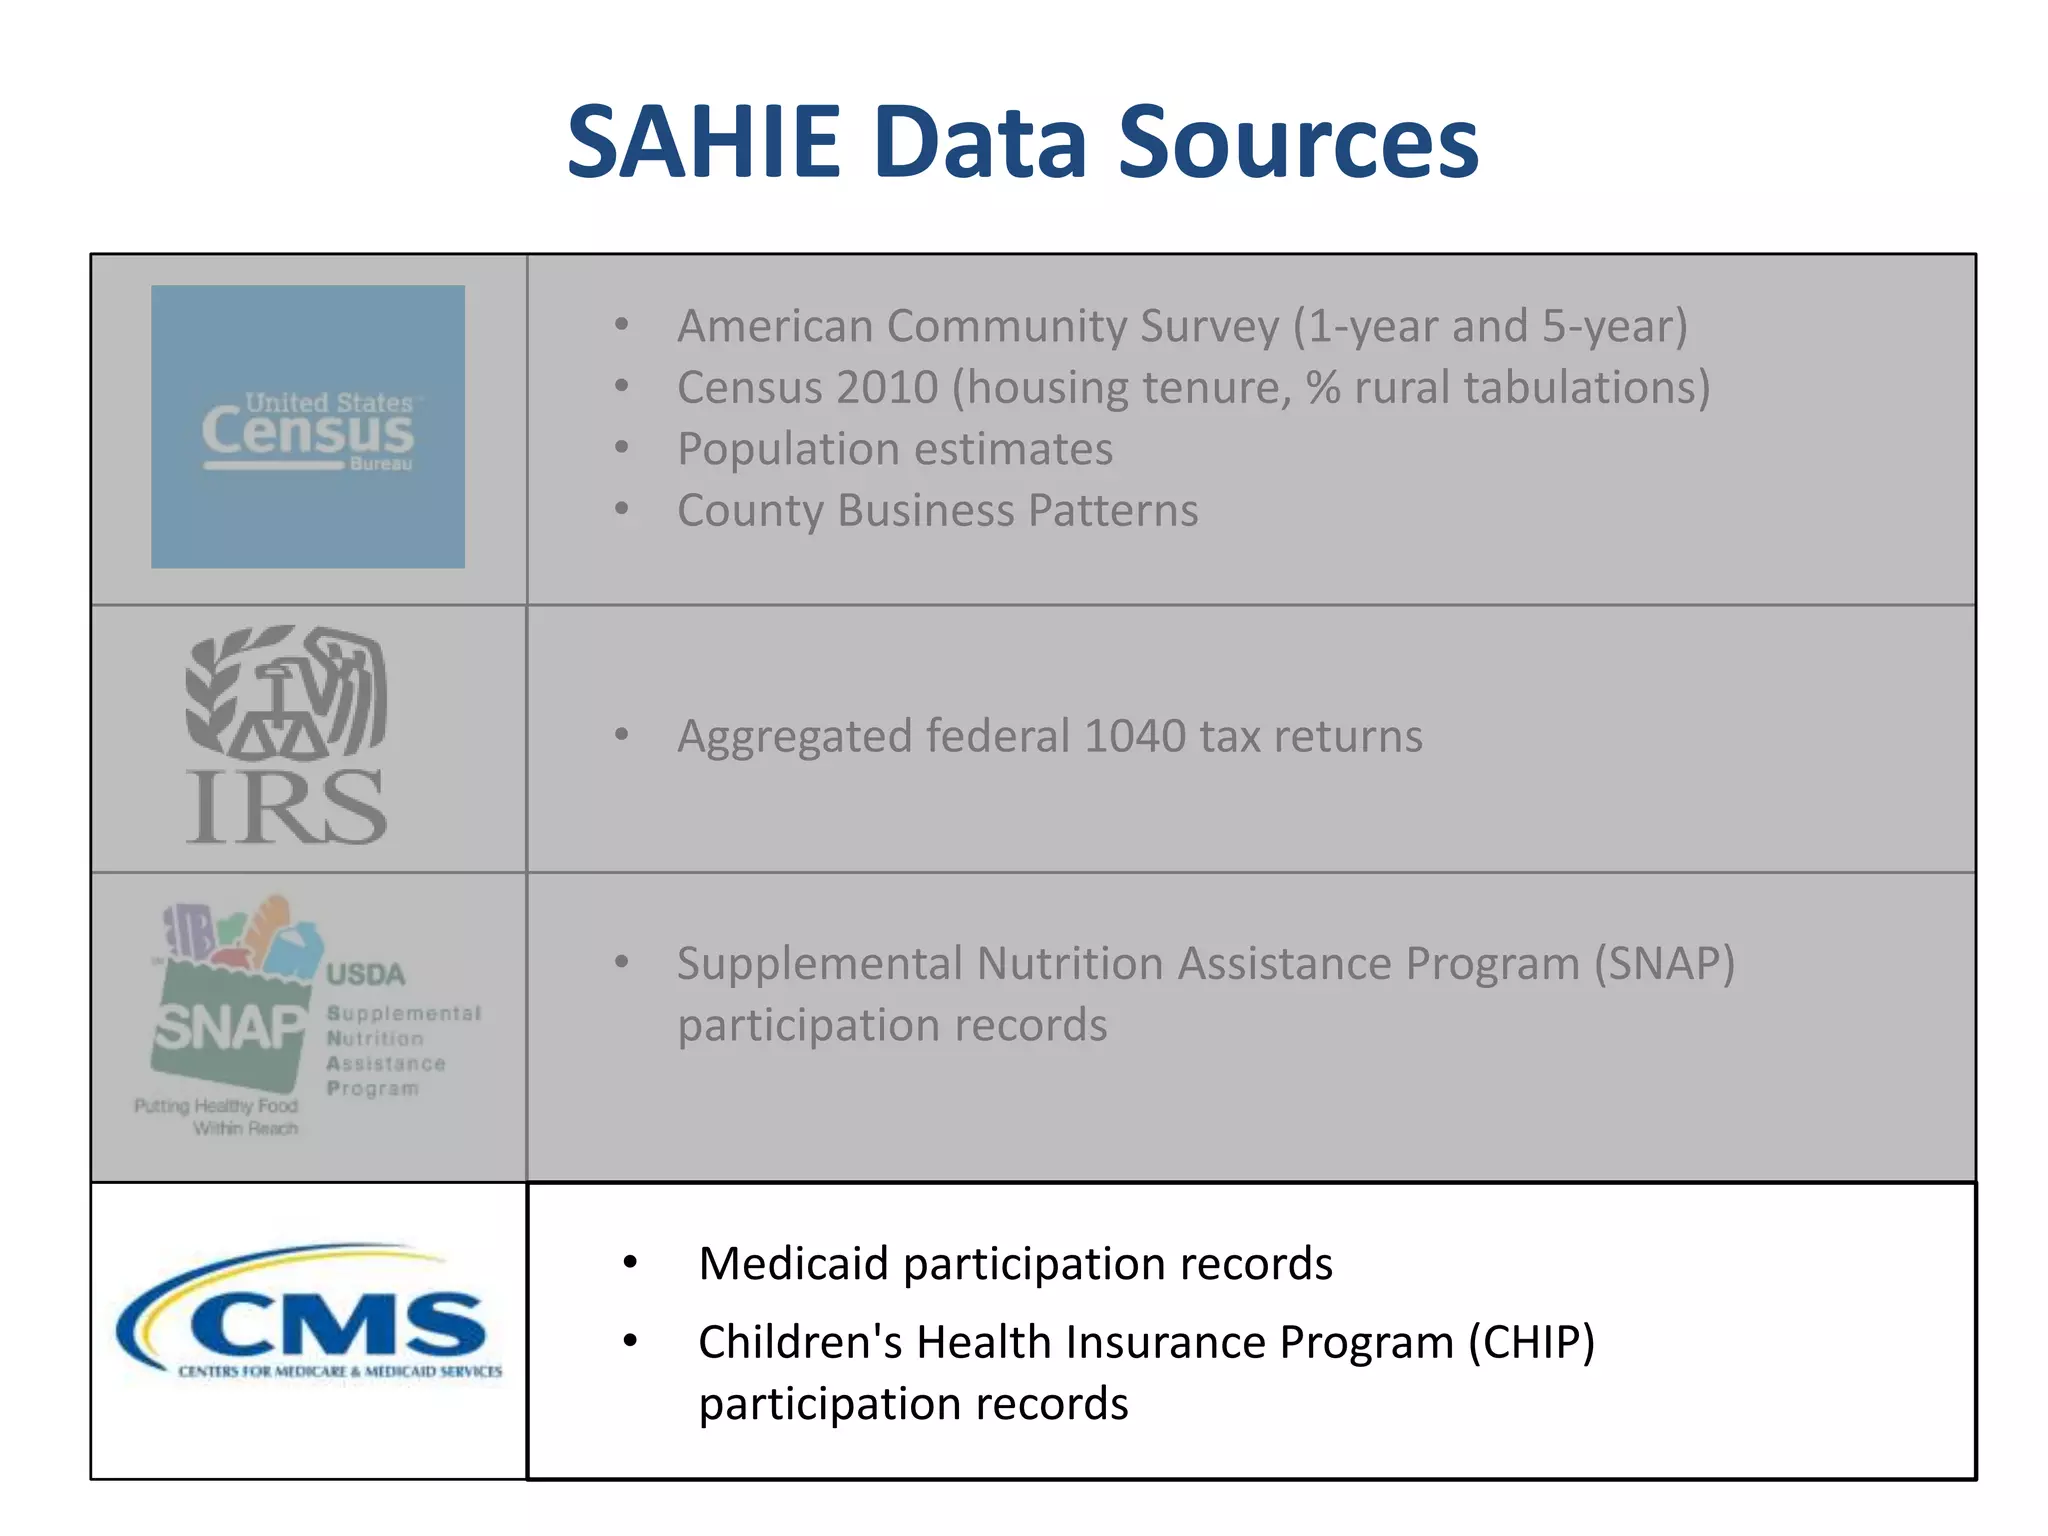
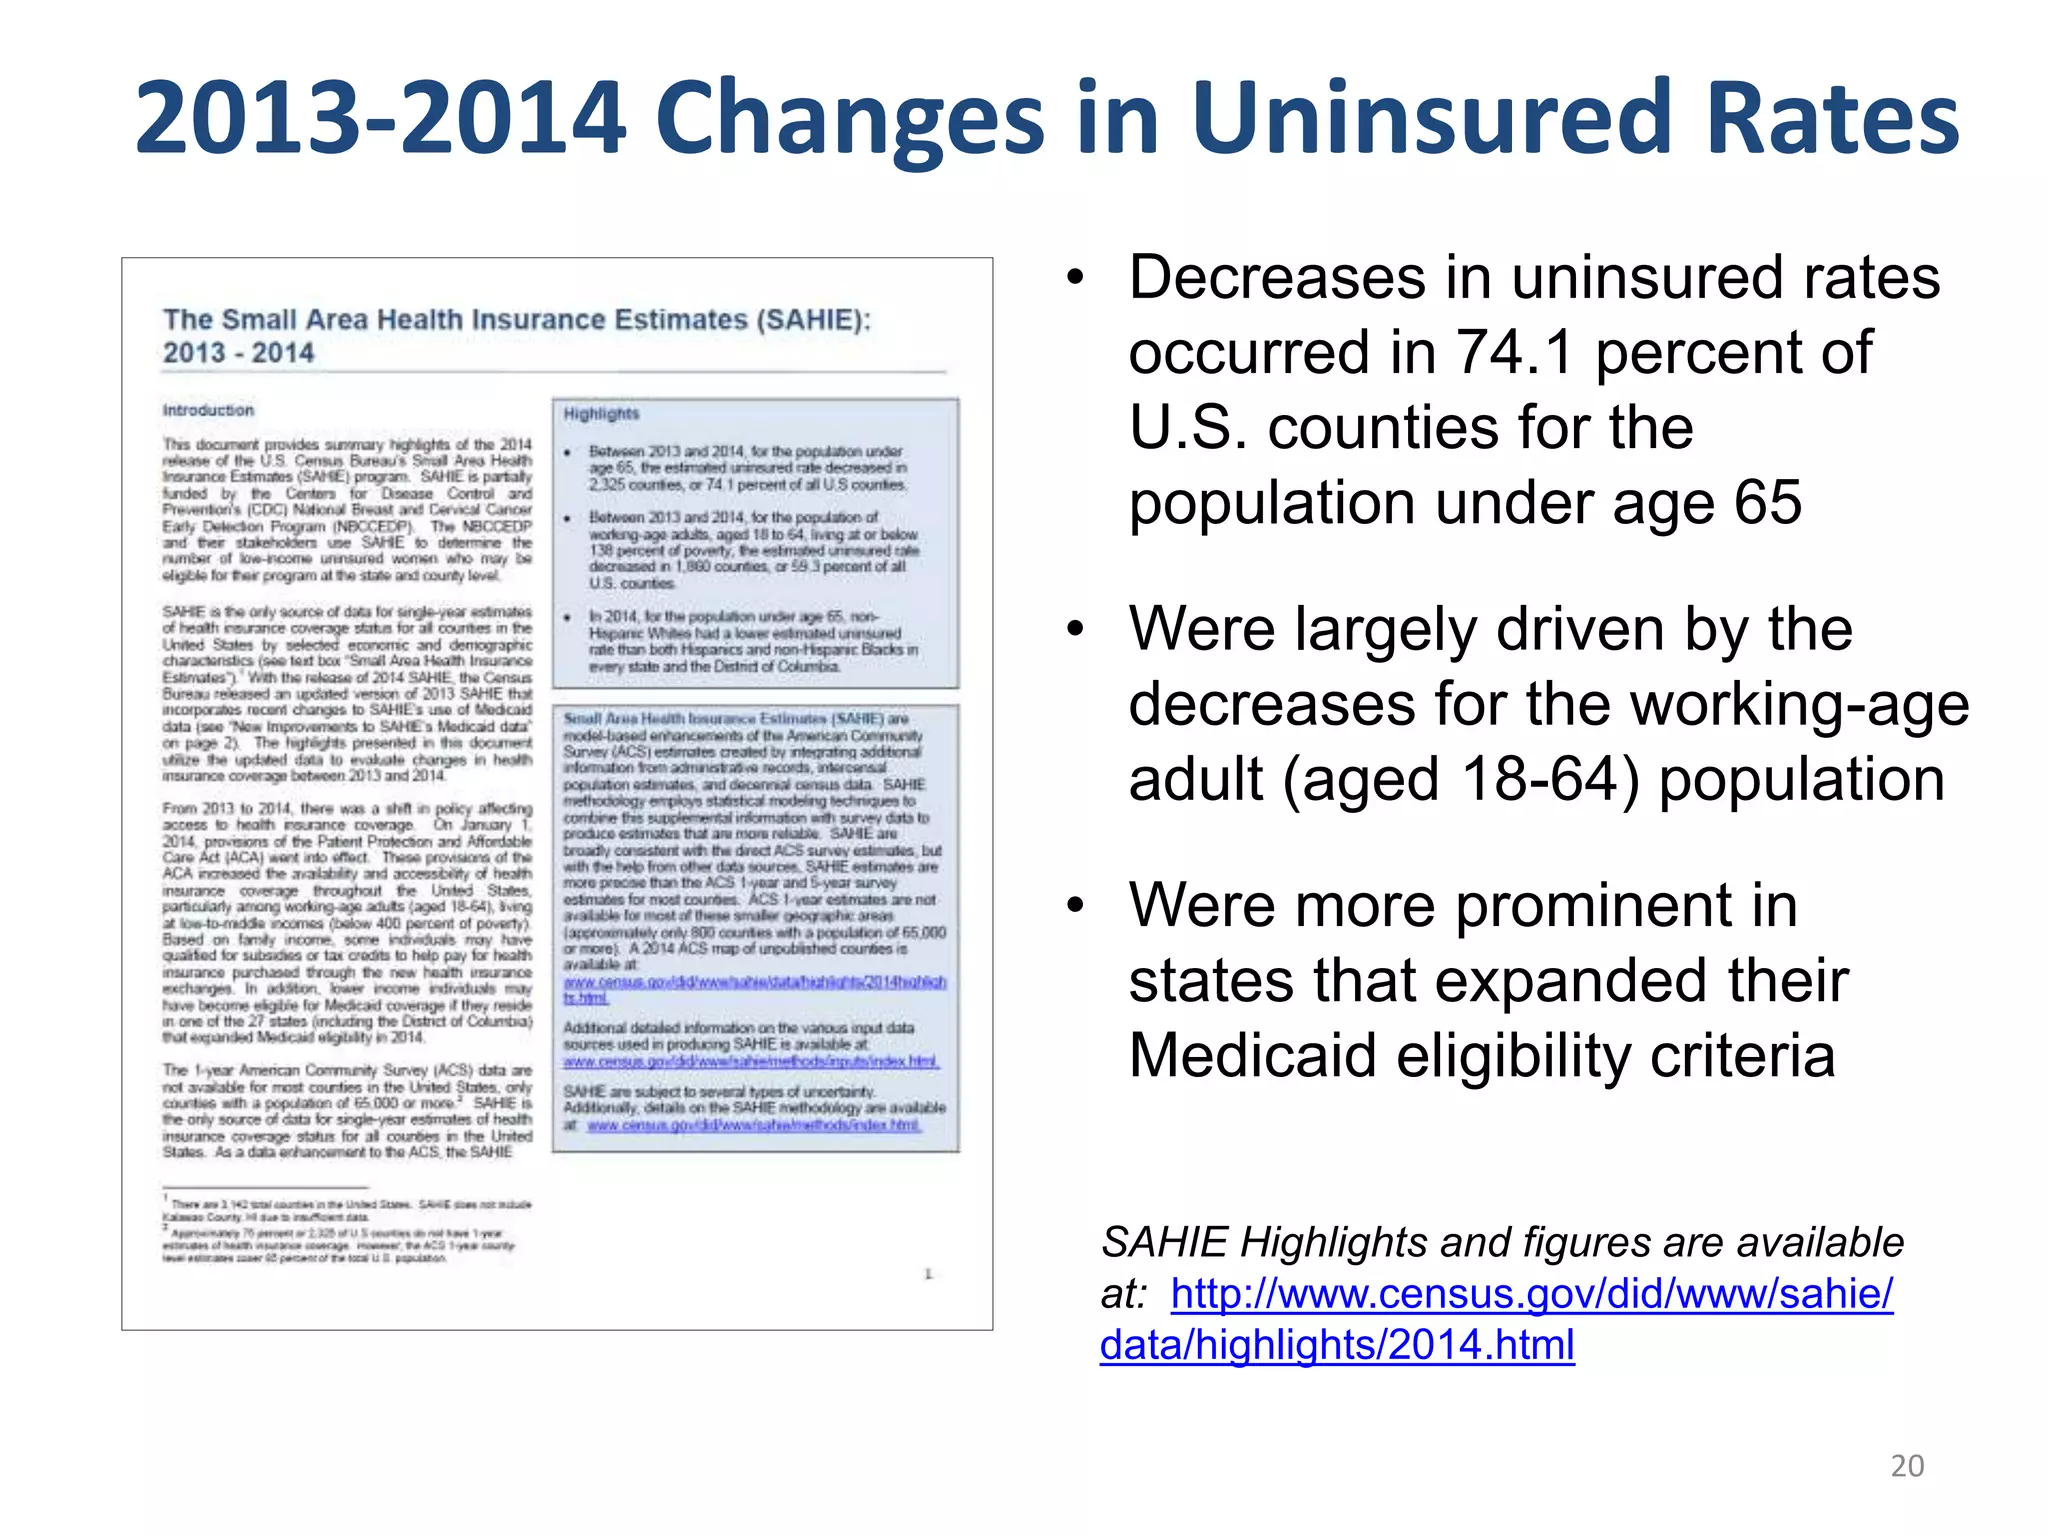
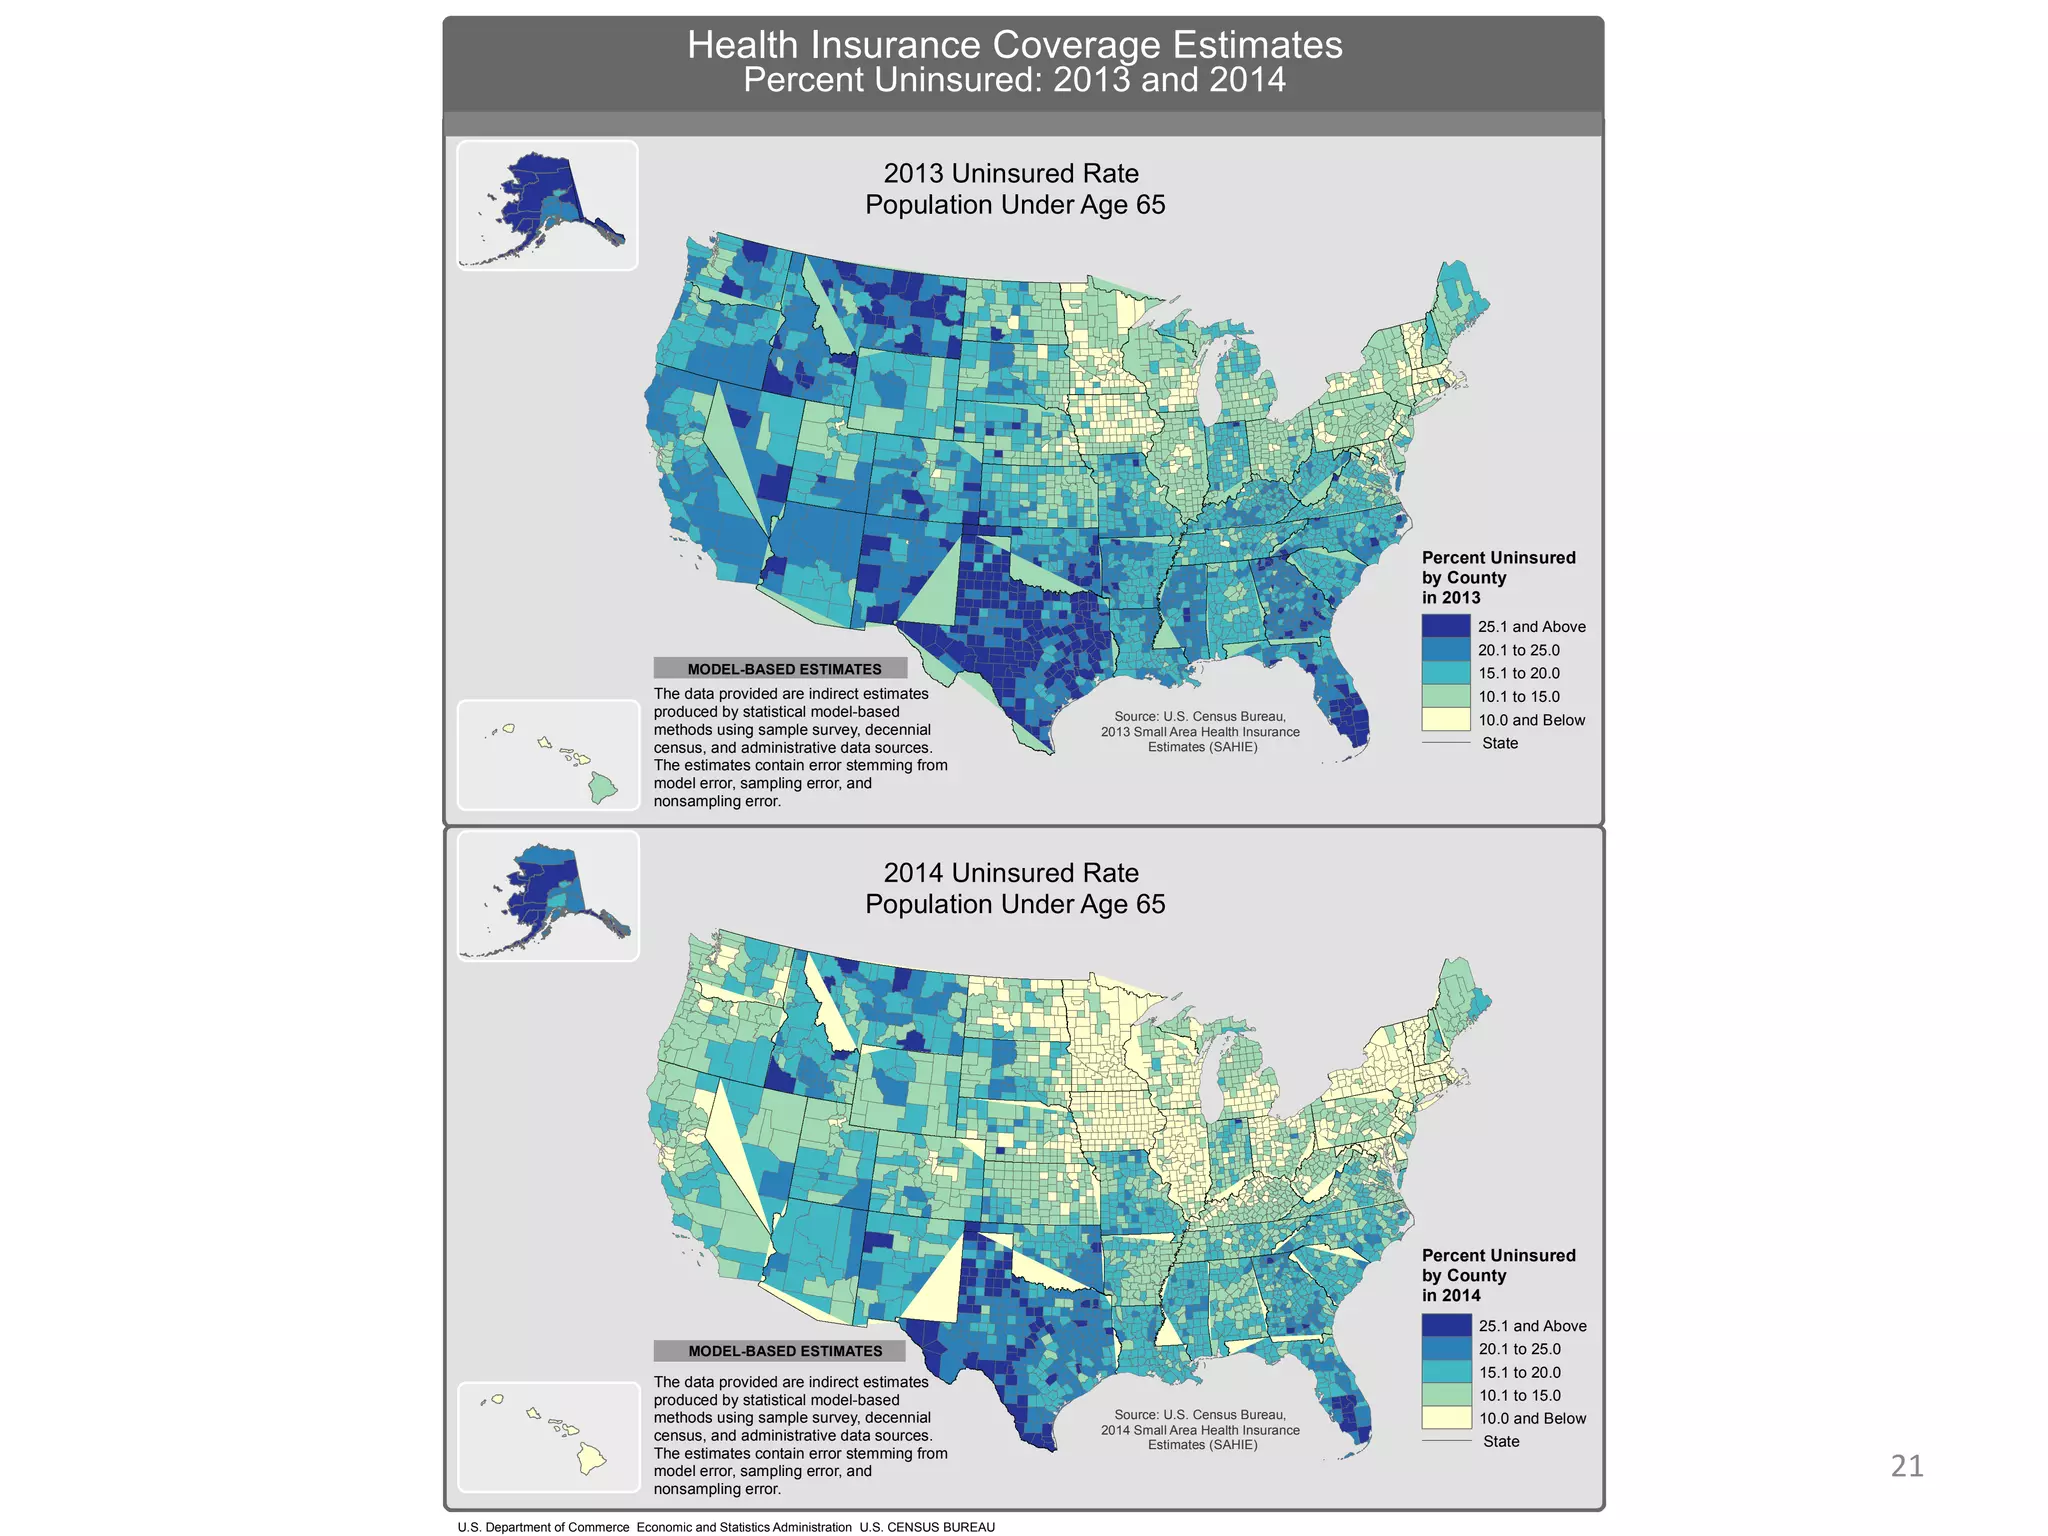
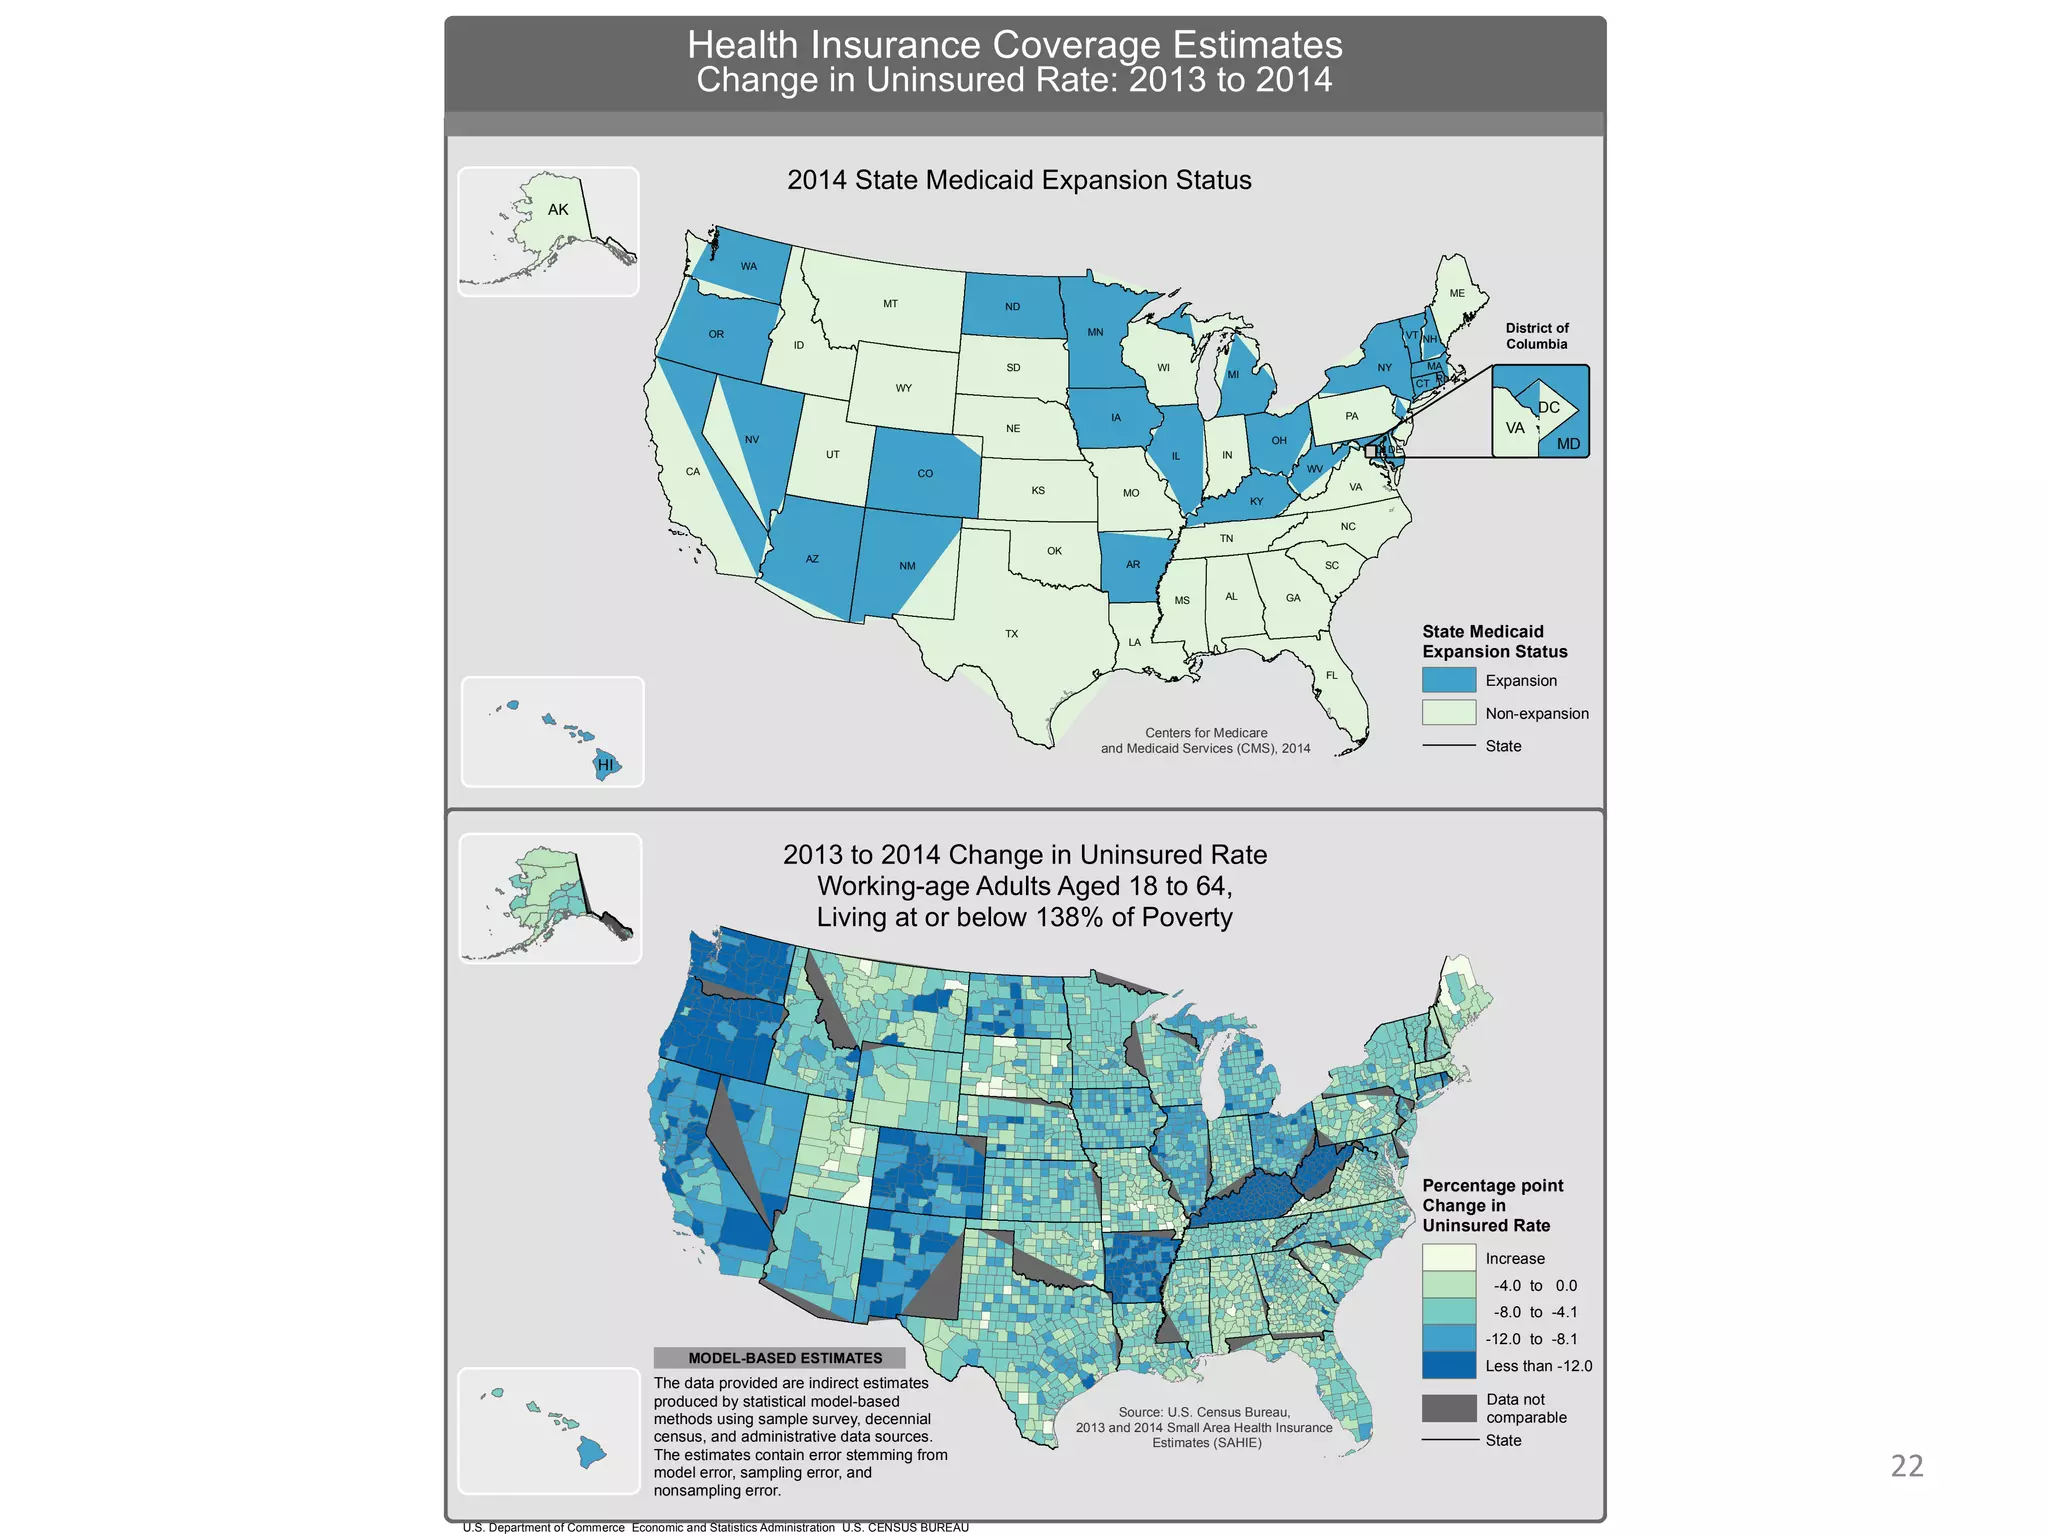
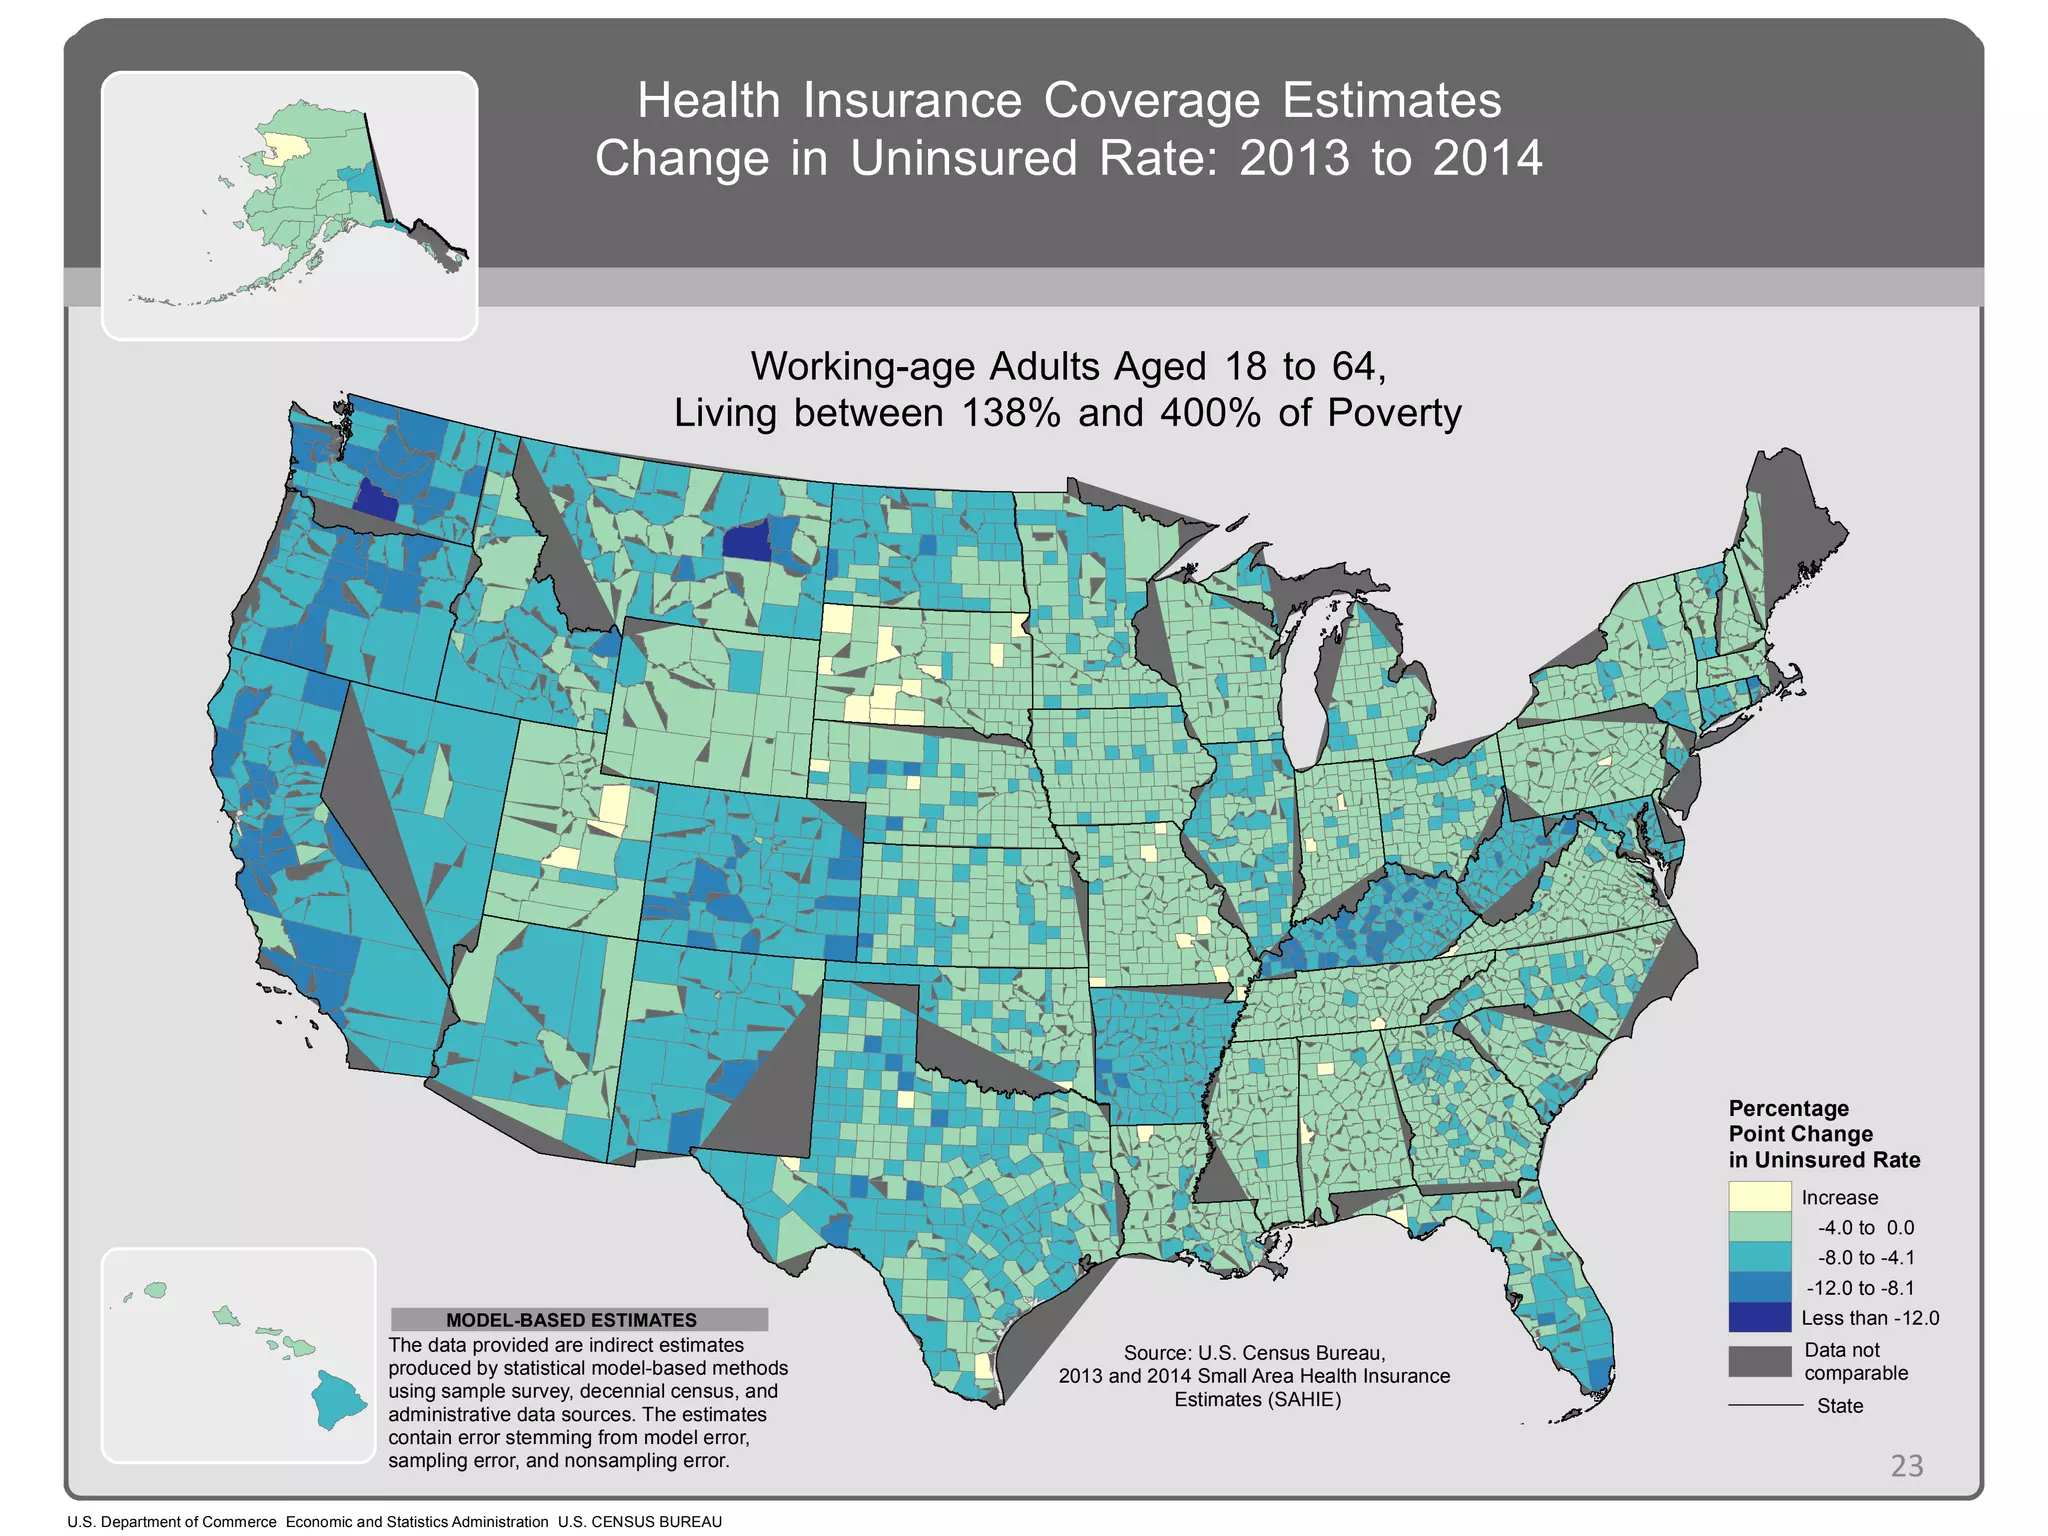
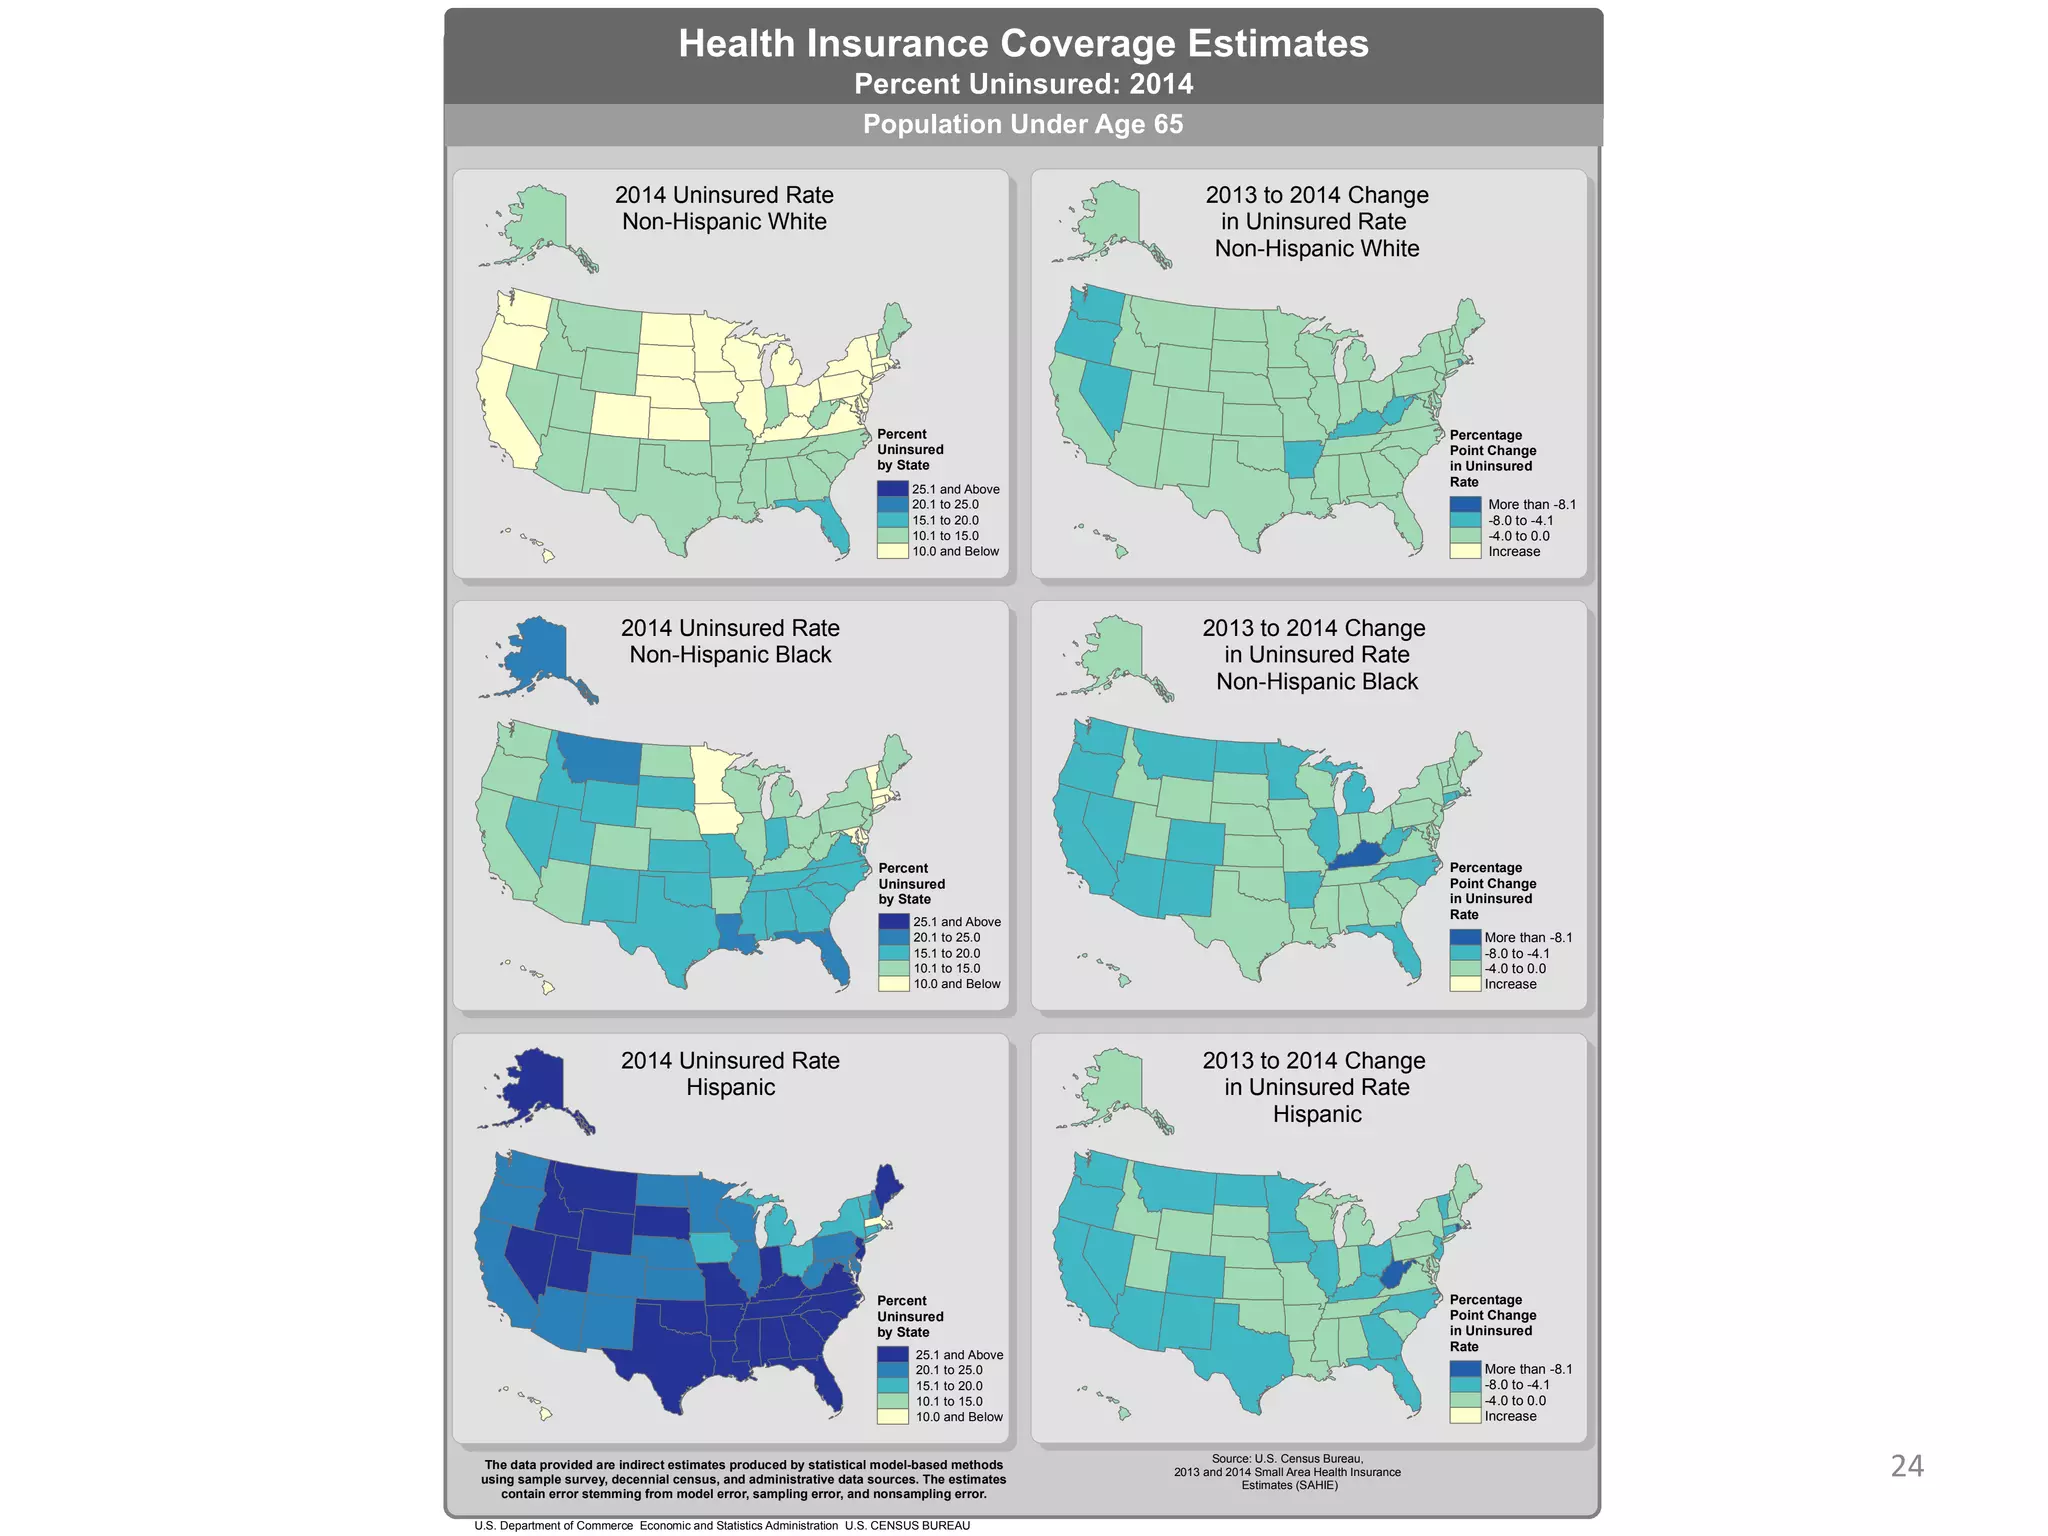
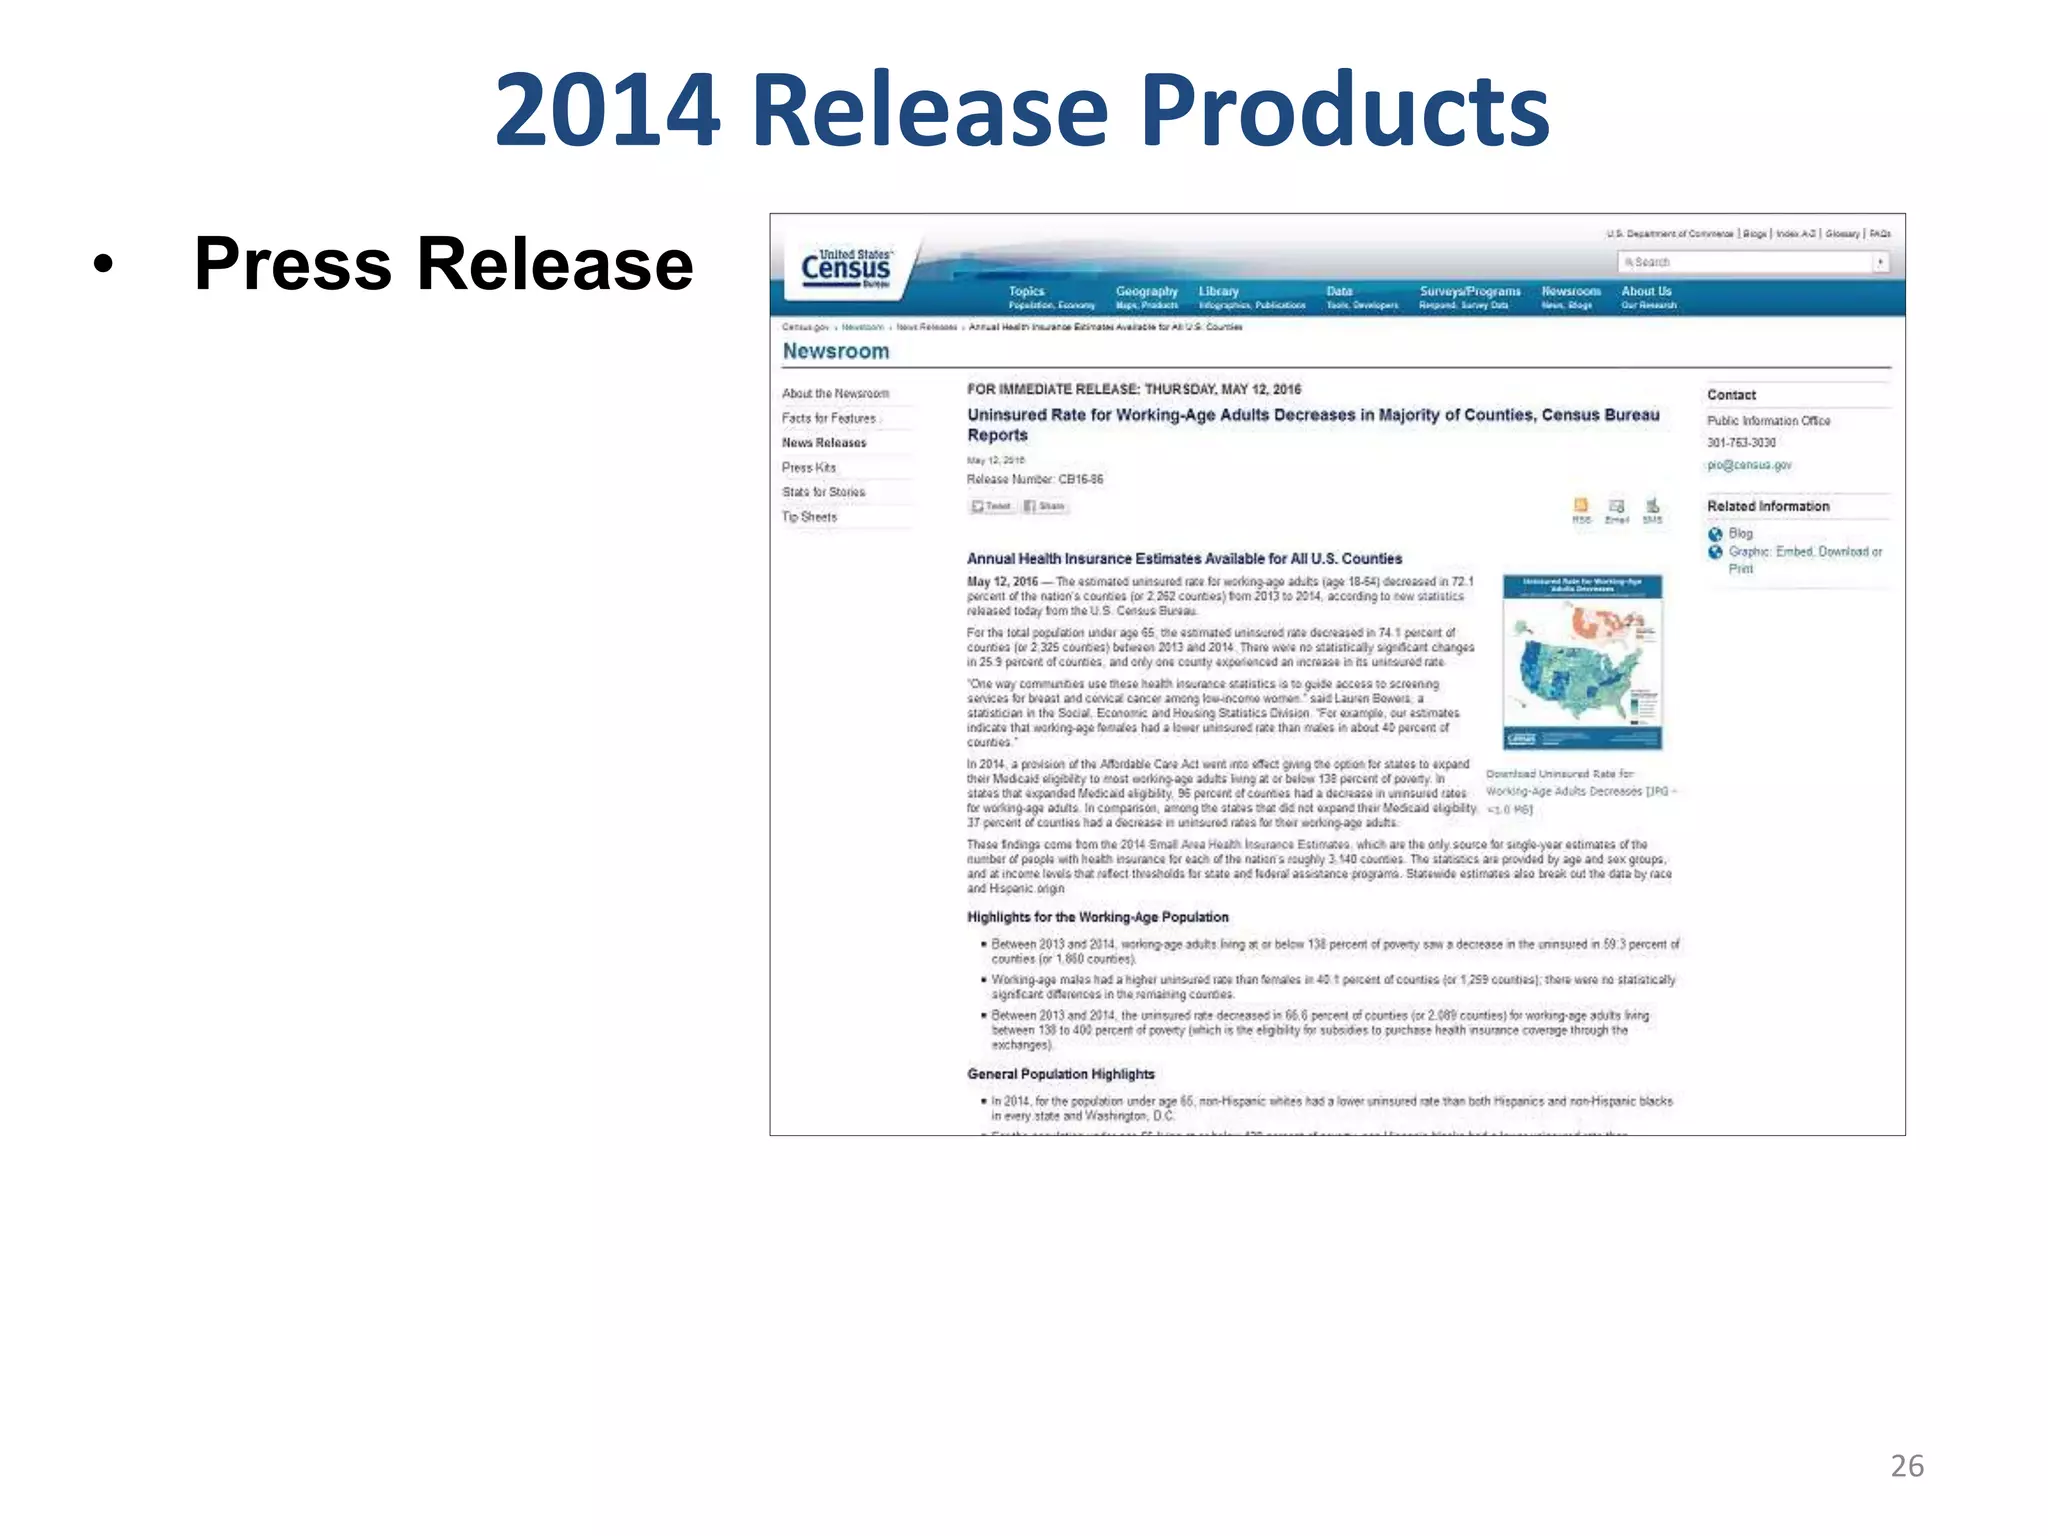
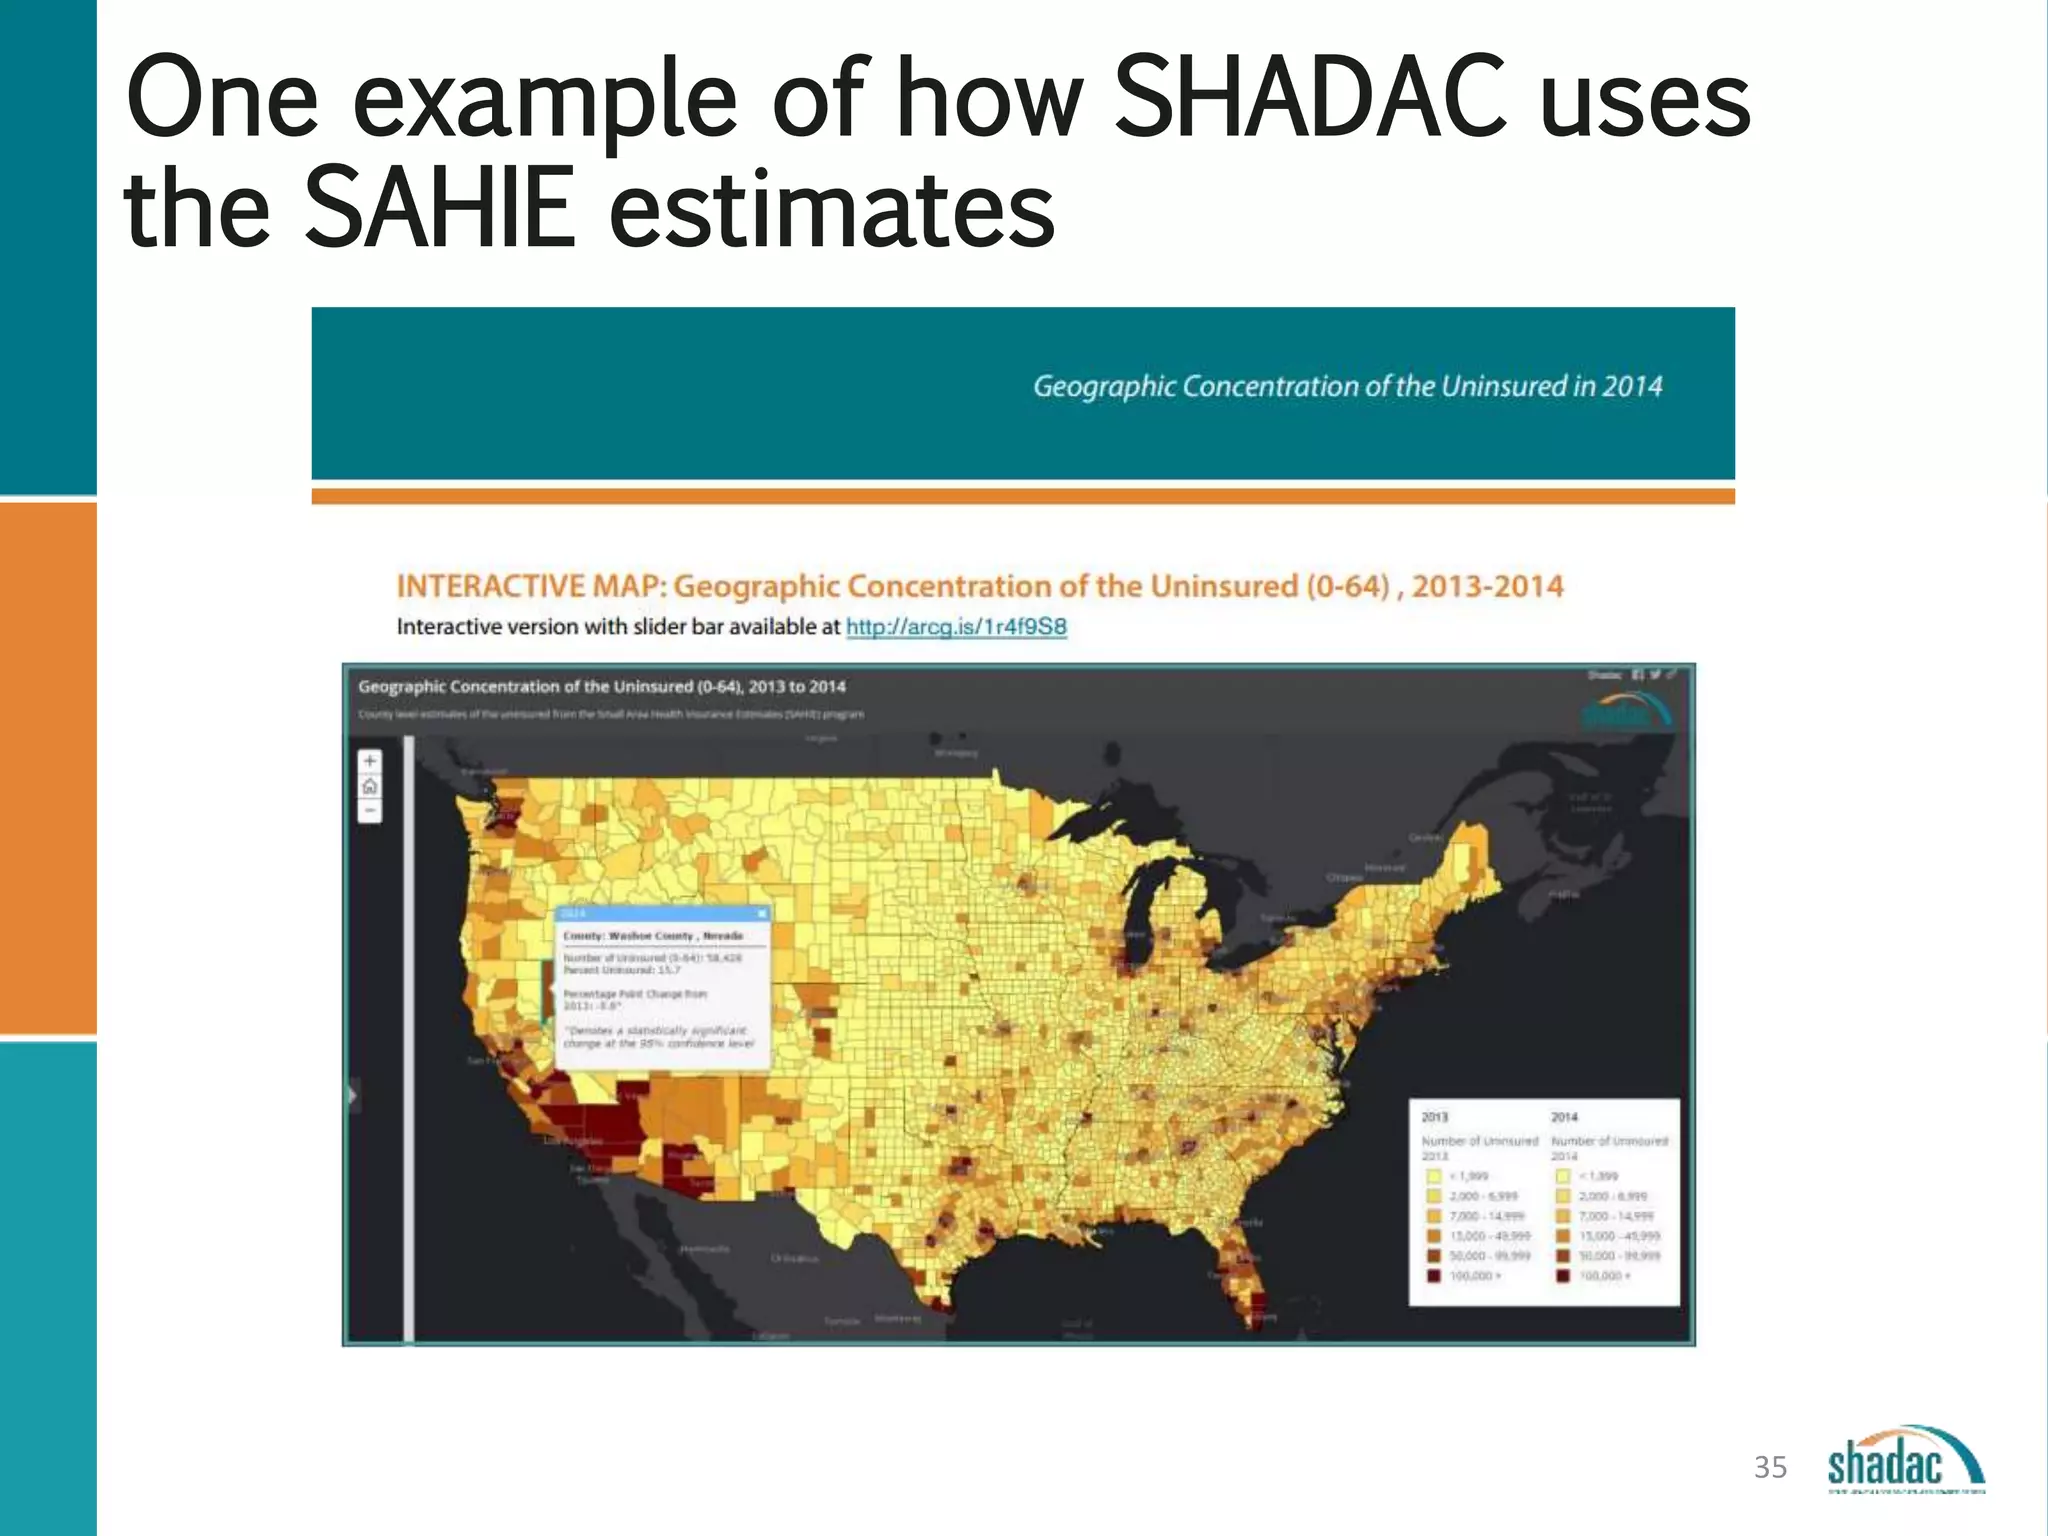
The document summarizes a webinar presented by experts from the U.S. Census Bureau on the Small Area Health Insurance Estimates (SAHIE). SAHIE provides county-level estimates of health insurance coverage across various demographic groups. The webinar discussed the 2014 SAHIE release, which incorporated more up-to-date Medicaid data and showed substantial changes in insurance rates from 2013 to 2014. The webinar also reviewed the data sources and methodology used to produce the SAHIE estimates.
Raspberry Pi Base - A flexible support frame for Raspberry Pi projectsSeggy Segaran
The Raspberry Pi Base protects the Raspberry Pi from accidental damage while still allowing various GPIO breakout cards to be used.
It is also big enough to accommodate external breadboards and prototyping boards.
The Pi Base is ideal for hobbyists and school projects.
This presentation is a step by step instruction on assembling the Pi Base.
2016 Health Insurance Coverag Estimates: SHADAC Webinar Featuring U.S. Census...Caroline Au-Yeung, MPH
Join us for an overview of the 2016 health insurance coverage estimates from two key, large-scale federal data sources: The American Community Survey (ACS) and the Current Population Survey (CPS).
Data from these annual surveys paint a picture of coverage at the national and state level under three years of ACA implementation while also providing historical trend information for context.
2017 Health Insurance Coverage Estimates: SHADAC Webinar Featuring U.S. Censu...soder145
Join us for an overview of the 2017 health insurance coverage estimates from two key, large-scale federal data sources: The American Community Survey (ACS) and the Current Population Survey (CPS).
This webinar will examine the new estimates with technical insight from experts at the U.S. Census Bureau, which administers both the ACS and CPS, and from SHADAC researchers.
Attendees will learn about:
The new 2017 national and state coverage estimates
When to use which estimates from which survey
How to access the estimates via Census reports and American FactFinder
How to access state-level estimates from the ACS using SHADAC tables
SHADAC researchers and Census experts will answer questions from attendees after the presentation.
This webinar will demonstrate how to use HealthyCity.org to enhance your grant proposals and reports with visually impactful and relevant data and maps. Learn how to access data highlighting the needs and opportunities within your communities and how to make the case that your program will make a difference.
Delivering early benefits and trial outputs using administrative dataUKDSCensus
Following the Government’s endorsement of the National Statistician’s recommendation on ‘The census and future provision of population statistics in England and Wales’, the ONS Beyond 2011 Programme has been closed and replaced by the new Census Transformation Programme. The new programme is focusing on developing the strategies and plans needed for delivery of the following major strands of work:- • an online census in 2021; • integrated statistical outputs that make use of administrative data and surveys in conjunction with the census; • a recommendation for the future provision of population statistics beyond 2021. Strand 3 continues with research carried out in the Beyond 2011 Programme exploring the potential of administrative data and surveys as a future alternative to traditional Census taking beyond 2021. Building upon the concept of ‘Statistical Population Datasets’ derived through anonymous linkage of multiple administrative sources, the ONS plans to release a series of annual ‘trial output’ statistics to deliver early benefits and engage users with the development and evaluation of methods. ‘Trial outputs’ are intended to illustrate what might be realised from administrative data, in particular the range and frequency of outputs, and the potential for small area statistics. The first release will focus on local authority population counts at age/sex level. Subsequent annual releases will aspire to produce smaller area population counts and additional outputs on households, income and ethnicity, subject to data access and quality. This presentation will outline ONS plans to deliver trial outputs in the run up to the 2021 Census.
The Population and Public Health team at the BC Centre for Disease Control undertook a project to support the integration of data into the community health planning process in British Columbia.
Alicia Van Orman, from the Population Reference Bureau, shares techniques and resources for collecting publically-available data and disaggregating it by race during a recent webinar. Using disaggregated data allows researchers to uncover patterns or other information that could lead to targeted and efficient investments.
ONS presentation at RSS South Wales poverty & inequality stats eventRichard Tonkin
Update on ONS data for poverty statistics & research. Presentation given at RSS South Wales event: Poverty & Inequality in Wales - Statistics for Action (28th Sept 2016)
Needs assessment training for Cycle IV of the "Identifying our Needs: A Survey of Elders" needs assessment - for participating tribes, Title VI, and int
Similar to 2014 SAHIE: Overview with Census Experts (20)
Exploring Disparities Using New and Updated MEasures on SHADAC's State Health...soder145
Slides from webinar webinar introducing two new measures of health outcomes and social determinants of health on SHADAC’s State Health Compare—Unhealthy Days and Unaffordable Rents. This presentation, hosted by SHADAC researchers Brett Fried and Robert Hest, examine these new measures and highlight how the estimates can be used to explore disparities between states and among sub-populations.
Leveraging 1332 State Innovation Waivers to Stabilize Individual Health Insur...soder145
Presentation by SHADAC Senior Research Fellow Emily Zylla at the 2018 Association for Public Policy Analysis & Management (APPAM) Fall Research Meeting in Washington, DC.
Modeling State-based Reinsurance: One Option for Stabilization of the Individ...soder145
Presentation by SHADAC Director Lynn Blewett at the 2018 Association for Public Policy Analysis and Management (APPAM) Fall Research Conference in Washington, DC.
Exploring the New State-Level Opioid Data On SHADAC's State Health Comparesoder145
Between 2000 and 2016, the annual number of drug overdose deaths in the United States more than tripled, from 17,500 to 63,500, and most of these deaths involved opioids. Despite widespread increases in overdose death rates from natural and semi-synthetic opioids, synthetic opioids, and heroin, individual states’ death rates varied widely. For example, in 2016, Nebraska’s rate of 1.2 deaths per 100,000 people was the lowest in the U.S. for natural and semi-synthetic opioids, while West Virginia’s rate (the highest) was more than 15 times larger, at 18.5 deaths. These deaths are the most glaring indication of the growing crisis of opioid abuse and addiction that has been spreading unevenly throughout the country over the past two decades.
On this SHADAC webinar, Research Fellow Colin Planalp will examine the United States opioid epidemic at the state level, analyzing trends in overdose deaths from heroin and other opioids, such as prescription painkillers. Using data available through SHADAC’s State Health Compare, he will look at which states have the highest rates of opioid-related deaths and which have experienced the largest increases in death rates.
Mr. Planalp will be joined by SHADAC Research Fellow Robert Hest, who will discuss the data on opioid-related overdose deaths from the U.S. Centers from Disease Control and Prevention (CDC) that are available on SHADAC’s State Health Compare. He will also discuss State Health Compare data from the U.S. Drug Enforcement Administration (DEA) on sales of common prescription opioid painkillers. Mr. Hest will show users how to access and use the data for state-level analyses.
Deep Leg Vein Thrombosis (DVT): Meaning, Causes, Symptoms, Treatment, and Mor...The Lifesciences Magazine
Deep Leg Vein Thrombosis occurs when a blood clot forms in one or more of the deep veins in the legs. These clots can impede blood flow, leading to severe complications.
Medical Technology Tackles New Health Care Demand - Research Report - March 2...pchutichetpong
M Capital Group (“MCG”) predicts that with, against, despite, and even without the global pandemic, the medical technology (MedTech) industry shows signs of continuous healthy growth, driven by smaller, faster, and cheaper devices, growing demand for home-based applications, technological innovation, strategic acquisitions, investments, and SPAC listings. MCG predicts that this should reflects itself in annual growth of over 6%, well beyond 2028.
According to Chris Mouchabhani, Managing Partner at M Capital Group, “Despite all economic scenarios that one may consider, beyond overall economic shocks, medical technology should remain one of the most promising and robust sectors over the short to medium term and well beyond 2028.”
There is a movement towards home-based care for the elderly, next generation scanning and MRI devices, wearable technology, artificial intelligence incorporation, and online connectivity. Experts also see a focus on predictive, preventive, personalized, participatory, and precision medicine, with rising levels of integration of home care and technological innovation.
The average cost of treatment has been rising across the board, creating additional financial burdens to governments, healthcare providers and insurance companies. According to MCG, cost-per-inpatient-stay in the United States alone rose on average annually by over 13% between 2014 to 2021, leading MedTech to focus research efforts on optimized medical equipment at lower price points, whilst emphasizing portability and ease of use. Namely, 46% of the 1,008 medical technology companies in the 2021 MedTech Innovator (“MTI”) database are focusing on prevention, wellness, detection, or diagnosis, signaling a clear push for preventive care to also tackle costs.
In addition, there has also been a lasting impact on consumer and medical demand for home care, supported by the pandemic. Lockdowns, closure of care facilities, and healthcare systems subjected to capacity pressure, accelerated demand away from traditional inpatient care. Now, outpatient care solutions are driving industry production, with nearly 70% of recent diagnostics start-up companies producing products in areas such as ambulatory clinics, at-home care, and self-administered diagnostics.
CHAPTER 1 SEMESTER V PREVENTIVE-PEDIATRICS.pdfSachin Sharma
This content provides an overview of preventive pediatrics. It defines preventive pediatrics as preventing disease and promoting children's physical, mental, and social well-being to achieve positive health. It discusses antenatal, postnatal, and social preventive pediatrics. It also covers various child health programs like immunization, breastfeeding, ICDS, and the roles of organizations like WHO, UNICEF, and nurses in preventive pediatrics.
Leading the Way in Nephrology: Dr. David Greene's Work with Stem Cells for Ki...Dr. David Greene Arizona
As we watch Dr. Greene's continued efforts and research in Arizona, it's clear that stem cell therapy holds a promising key to unlocking new doors in the treatment of kidney disease. With each study and trial, we step closer to a world where kidney disease is no longer a life sentence but a treatable condition, thanks to pioneers like Dr. David Greene.
Empowering ACOs: Leveraging Quality Management Tools for MIPS and BeyondHealth Catalyst
Join us as we delve into the crucial realm of quality reporting for MSSP (Medicare Shared Savings Program) Accountable Care Organizations (ACOs).
In this session, we will explore how a robust quality management solution can empower your organization to meet regulatory requirements and improve processes for MIPS reporting and internal quality programs. Learn how our MeasureAble application enables compliance and fosters continuous improvement.
1. SMALL AREA HEALTH INSURANCE ESTIMATES (SAHIE)
SHADAC Webinar Featuring U.S. Census Bureau Experts
June 9, 2016, 12:00 -12:30 PM EDT
You will be connected to broadcast audio through your computer.
You can also connect via telephone:
(866)-831-1467, Conference ID 17495609
Slides and handouts at:
www.shadac.org/2016SAHIEwebinar
2. Technical Items
• For those dialing in: Phones automatically muted
• Submit questions using the chat window at any
time during the webinar
• Problems:
• Call Readytalk’s help line: (800) 843-9166
• Ask for help using the chat feature
• Download the slides at
www.shadac.org/2016SAHIEwebinar
• Webinar archive will be posted on SHADAC’s
website
• E-mail notice will be sent to participants
2
4. Small Area Health Insurance
Estimates from the Census Bureau:
2013 and 2014
David Powers and Lauren Bowers
Social, Economic, and Housing Statistics Division
United States Census Bureau
Presentation for State Health Access Data Assistance Center (SHADAC)
June 9, 2016
Disclaimer: This presentation is released to inform interested parties of ongoing research and
to encourage discussion. Any views expressed are those of the authors and not necessarily
those of the U.S. Census Bureau.
4
5. Small Area Health Insurance Estimates (SAHIE)
5
• Model-based health insurance
coverage estimates
• Only source of single-year
health insurance coverage
estimates for all U.S. counties
• Recently released estimates
• 2014 SAHIE
• Updated version of 2013 SAHIE
• Release highlights
• Incorporated new up-to-date
Medicaid source data
• Substantial 2013 to 2014 changes
in health insurance in many areas
6. • SAHIE is partially funded by the Centers for Disease
Control and Prevention’s (CDC) National Breast and
Cervical Cancer Early Detection Program (NBCCEDP)
• The CDC uses SAHIE to assess the eligible population
of low-income, uninsured women for cancer screening
and diagnostic services under the NBCCEDP
Sponsor: Centers for Disease Control and
Prevention (CDC)
6
7. SAHIE Cross Classifications
Age Sex Income Race and Ethnicity
(State only)
Under age 65
18 to 64 years
40 to 64 years
50 to 64 years
Under age 19*
Both Sexes
Male
Female
All Incomes
At or below 200% of poverty
At or below 250% of poverty
At or below 138% of poverty
At or below 400% of poverty
Between 138 and 400% of poverty
All Race and Ethnicities
White Alone, not Hispanic
Black Alone, not Hispanic
Hispanic
*For the population under age 19 estimates are not available by sex or by race and ethnicity
7
By “% of poverty,” we mean the ratio of
income to the federal poverty threshold
8. SAHIE Cross Classifications
Age Sex Income Race and Ethnicity
(State only)
Under age 65
18 to 64 years
40 to 64 years
50 to 64 years
Under age 19*
Both Sexes
Male
Female
All Incomes
At or below 200% of poverty
At or below 250% of poverty
At or below 138% of poverty
At or below 400% of poverty
Between 138 and 400% of poverty
All Race and Ethnicities
White Alone, not Hispanic
Black Alone, not Hispanic
Hispanic
*For the population under age 19 estimates are not available by sex or by race and ethnicity
Centers for
Disease Control
(CDC)
Children’s Health
Insurance Program
(CHIP)
Patient Protection and
Affordable Care Act
(ACA)
8
By “% of poverty,” we mean the ratio of
income to the federal poverty threshold
9. When to Use SAHIE?
U.S. Census Bureau Health Insurance Data Source Recommendations
Available on the web: http://www.census.gov/hhes/www/hlthins/about/index.html
9
11. SAHIE Data Sources
• American Community Survey (1-year and 5-year)
• Census 2010 (housing tenure, % rural tabulations)
• Population estimates
• County Business Patterns
• Aggregated federal 1040 tax returns
• Supplemental Nutrition Assistance Program (SNAP)
participation records
• Medicaid participation records
• Children's Health Insurance Program (CHIP)
participation records
12. Benefits from Modeling
• Estimates can be released for all counties,
regardless of population size, and for many
detailed domains
• Reduction in year-to-year volatility relative
to the survey estimates
• Improvement in precision (margins of error)
relative to the survey estimates
12
17. • American Community Survey (1-year and 5-year)
• Census 2010 (housing tenure, % rural tabulations)
• Population estimates
• County Business Patterns
SAHIE Data Sources
• Aggregated federal 1040 tax returns
• Supplemental Nutrition Assistance Program (SNAP)
participation records
• Medicaid participation records
• Children's Health Insurance Program (CHIP)
participation records
18. • Starting in late 2013, CMS began to release new timely
Medicaid/CHIP summary data
• SAHIE historically has used Medicaid/CHIP participation
data that lagged 2 years behind the estimate year
• e.g., 2012 SAHIE used 2010 Medicaid and CHIP data
• Opportunity for SAHIE to improve source data timeliness
and to protect against uncertain delays in future delivery
• Using more up-to-date Medicaid/CHIP data may be
especially important during 2013-2014 as many states
expanded Medicaid eligibility under the ACA
New Medicaid Data (1)
18
19. • SAHIE production now incorporates the new CMS
Medicaid/CHIP summary data together with the
previous (detailed but lagged) Medicaid/CHIP data
• The resulting SAHIE, which uses the combined new
Medicaid/CHIP data, show improved consistency
with ACS 1-year estimates of the uninsured for
people aged 0-18 in smaller counties
New Medicaid Data (2)
19
For more information on SAHIE’s use of updated Medicaid
enrollment data, please visit
http://www.census.gov/did/www/sahie/methods/inputs/medicaid.html
20. 2013-2014 Changes in Uninsured Rates
• Decreases in uninsured rates
occurred in 74.1 percent of
U.S. counties for the
population under age 65
• Were largely driven by the
decreases for the working-age
adult (aged 18-64) population
• Were more prominent in
states that expanded their
Medicaid eligibility criteria
SAHIE Highlights and figures are available
at: http://www.census.gov/did/www/sahie/
data/highlights/2014.html
20
21. U.S. Department of Commerce Economic and Statistics Administration U.S. CENSUS BUREAU
Health Insurance Coverage Estimates
MODEL-BASED ESTIMATES
2013 Uninsured Rate
Population Under Age 65
Source: U.S. Census Bureau,
2013 Small Area Health Insurance
Estimates (SAHIE)
The data provided are indirect estimates
produced by statistical model-based
methods using sample survey, decennial
census, and administrative data sources.
The estimates contain error stemming from
model error, sampling error, and
nonsampling error.
The data provided are indirect estimates
produced by statistical model-based
methods using sample survey, decennial
census, and administrative data sources.
The estimates contain error stemming from
model error, sampling error, and
nonsampling error.
MODEL-BASED ESTIMATES
Percent Uninsured
by County
in 2014
25.1 and Above
20.1 to 25.0
15.1 to 20.0
10.1 to 15.0
10.0 and Below
State
Percent Uninsured: 2013 and 2014
2014 Uninsured Rate
Population Under Age 65
Percent Uninsured
by County
in 2013
25.1 and Above
20.1 to 25.0
15.1 to 20.0
10.1 to 15.0
10.0 and Below
State
Source: U.S. Census Bureau,
2014 Small Area Health Insurance
Estimates (SAHIE)
21
28. • Press Release
• Census Bureau’s API
• Research Matters blog
2014 Release Products
28
29. • Press Release
• Census Bureau’s API
• Research Matters blog
• Conference papers
2014 Release Products
29
30. • Press Release
• Census Bureau’s API
• Research Matters blog
• Conference papers
• SAHIE website:
‒ Data for download
o .CSV, .TXT files
‒ Interactive tool
2014 Release Products
30
31. • Press Release
• Census Bureau’s API
• Research Matters blog
• Conference papers
• SAHIE website:
‒ Data for download
o .CSV, .TXT files
‒ Interactive tool
‒ Updated 2013 SAHIE and comparison tab of original vs.
new
2014 Release Products
31
32. • Press Release
• Census Bureau’s API
• Research Matters blog
• Conference papers
• SAHIE website:
‒ Data for download
o .CSV, .TXT files
‒ Interactive tool
‒ Updated 2013 SAHIE and comparison tab of original vs. new
‒ Highlights document
2014 Release Products
32
33. • Press Release
• Census Bureau’s API
• Research Matters blog
• Conference papers
• SAHIE website:
‒ Data for download
o .CSV, .TXT files
‒ Interactive tool
‒ Updated 2013 SAHIE and comparison tab of original vs. new
‒ Highlights document
‒ Heat map for 2005 through 2014
2014 Release Products
33
35. SAHIE Website: http://www.census.gov/did/www/sahie/index.html
Data for download:
Data interactive tool (table , maps , and trend tools)
http://www.census.gov/did/www/sahie/data/interactive/sahie.html
CSV and text files
http://www.census.gov/did/www/sahie/data/20082014/index.html
Census Bureau’s API
http://www.census.gov/data/developers/data-sets/Health-Insurance-Statistics.html
Reports and Graphics:
Press Release
http://www.census.gov/newsroom/press-releases/2016/cb16-86.html
2014 SAHIE Release Highlights
http://www.census.gov/did/www/sahie/data/2014/2014highlights.pdf
2014 SAHIE Maps
http://www.census.gov/did/www/sahie/data/highlights/2014highlights.html
Heat Map
http://www.census.gov/did/www/sahie/data/visualization/healthins/index.html?reload
Conference papers:
Medicaid and CHIP Data Methodology for SAHIE Models - David Powers, Lauren Bowers, Wesley Basel, and Samuel Szelepka
http://www.census.gov/content/dam/Census/library/working-papers/2016/demo/powers-bowers-basel-szelepka-fcsm.pdf
Evaluating 2012-2014 Trends in Health Insurance Coverage for All U.S. Counties - Lauren Bowers, Wes Basel, and David Powers
http://www.census.gov/content/dam/Census/library/working-papers/2016/demo/SEHSD-WP2016-16.pdf
Blogs:
More Timely Medicaid Data Helps Improve Small Area Health Insurance Estimates
http://researchmatters.blogs.census.gov/2016/05/12/more-timely-medicaid-data-helps-improve-small-area-health-insurance-estimates/
Evaluating 2013-2014 Trends in County-Level Health Insurance Coverage for Low-Income Working-Age Adults
http://researchmatters.blogs.census.gov/2016/04/02/evaluating-2013-2014-tr, ends-in-county-level-health-insurance-coverage-for-low-income-
working-age-adults/
Reference Page
35