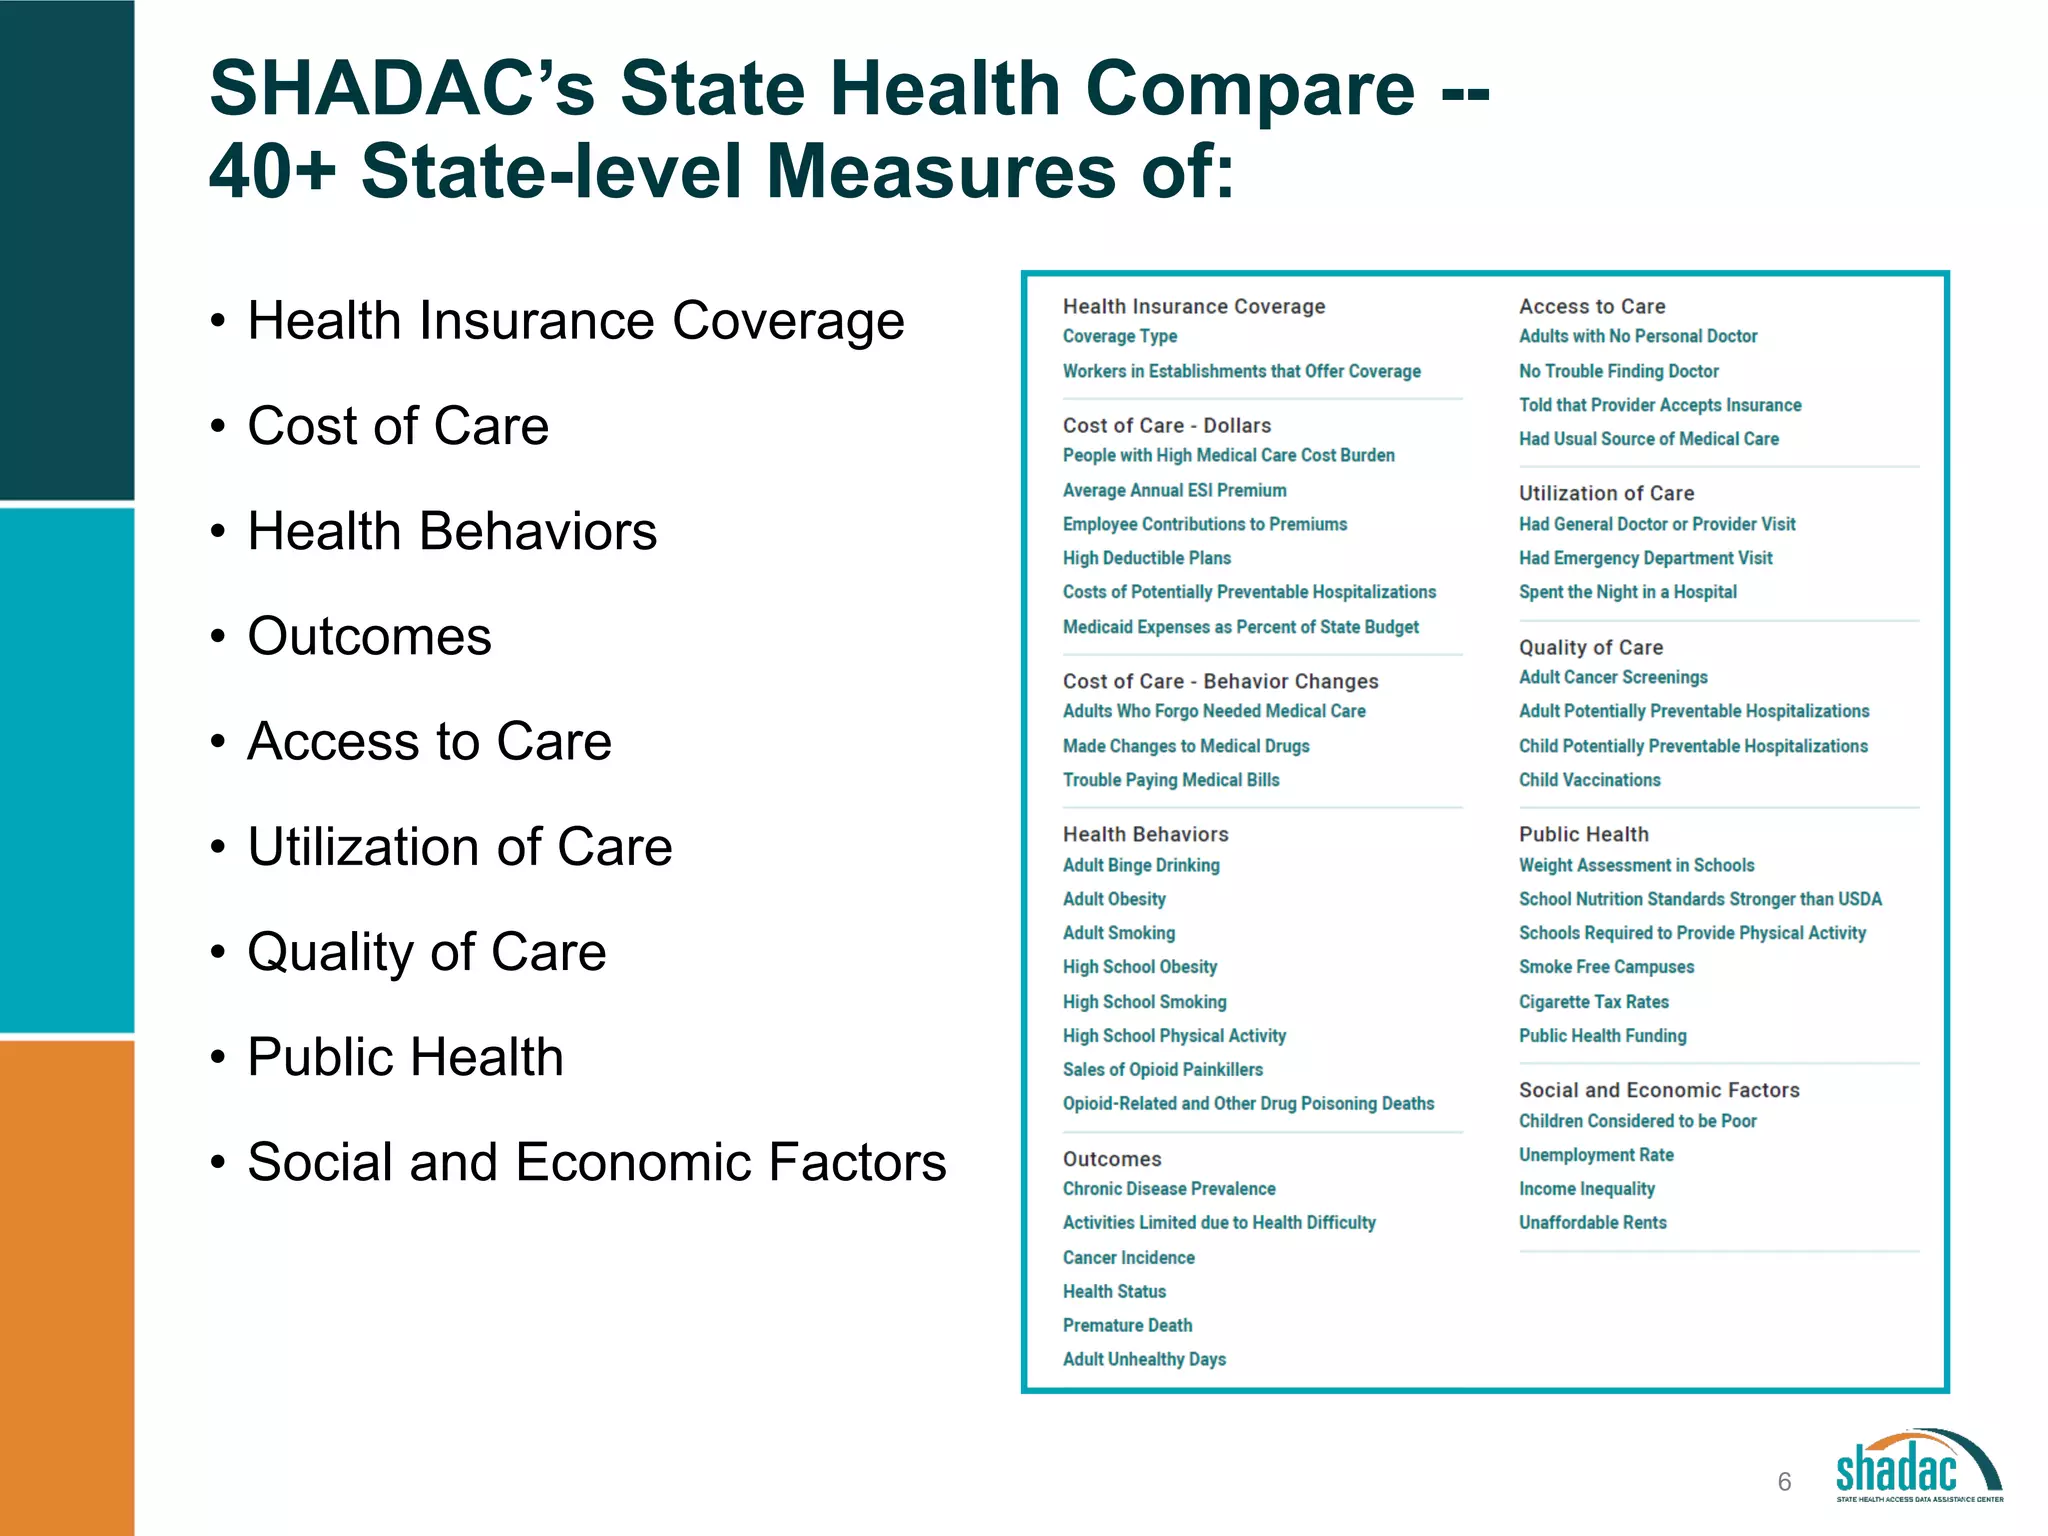
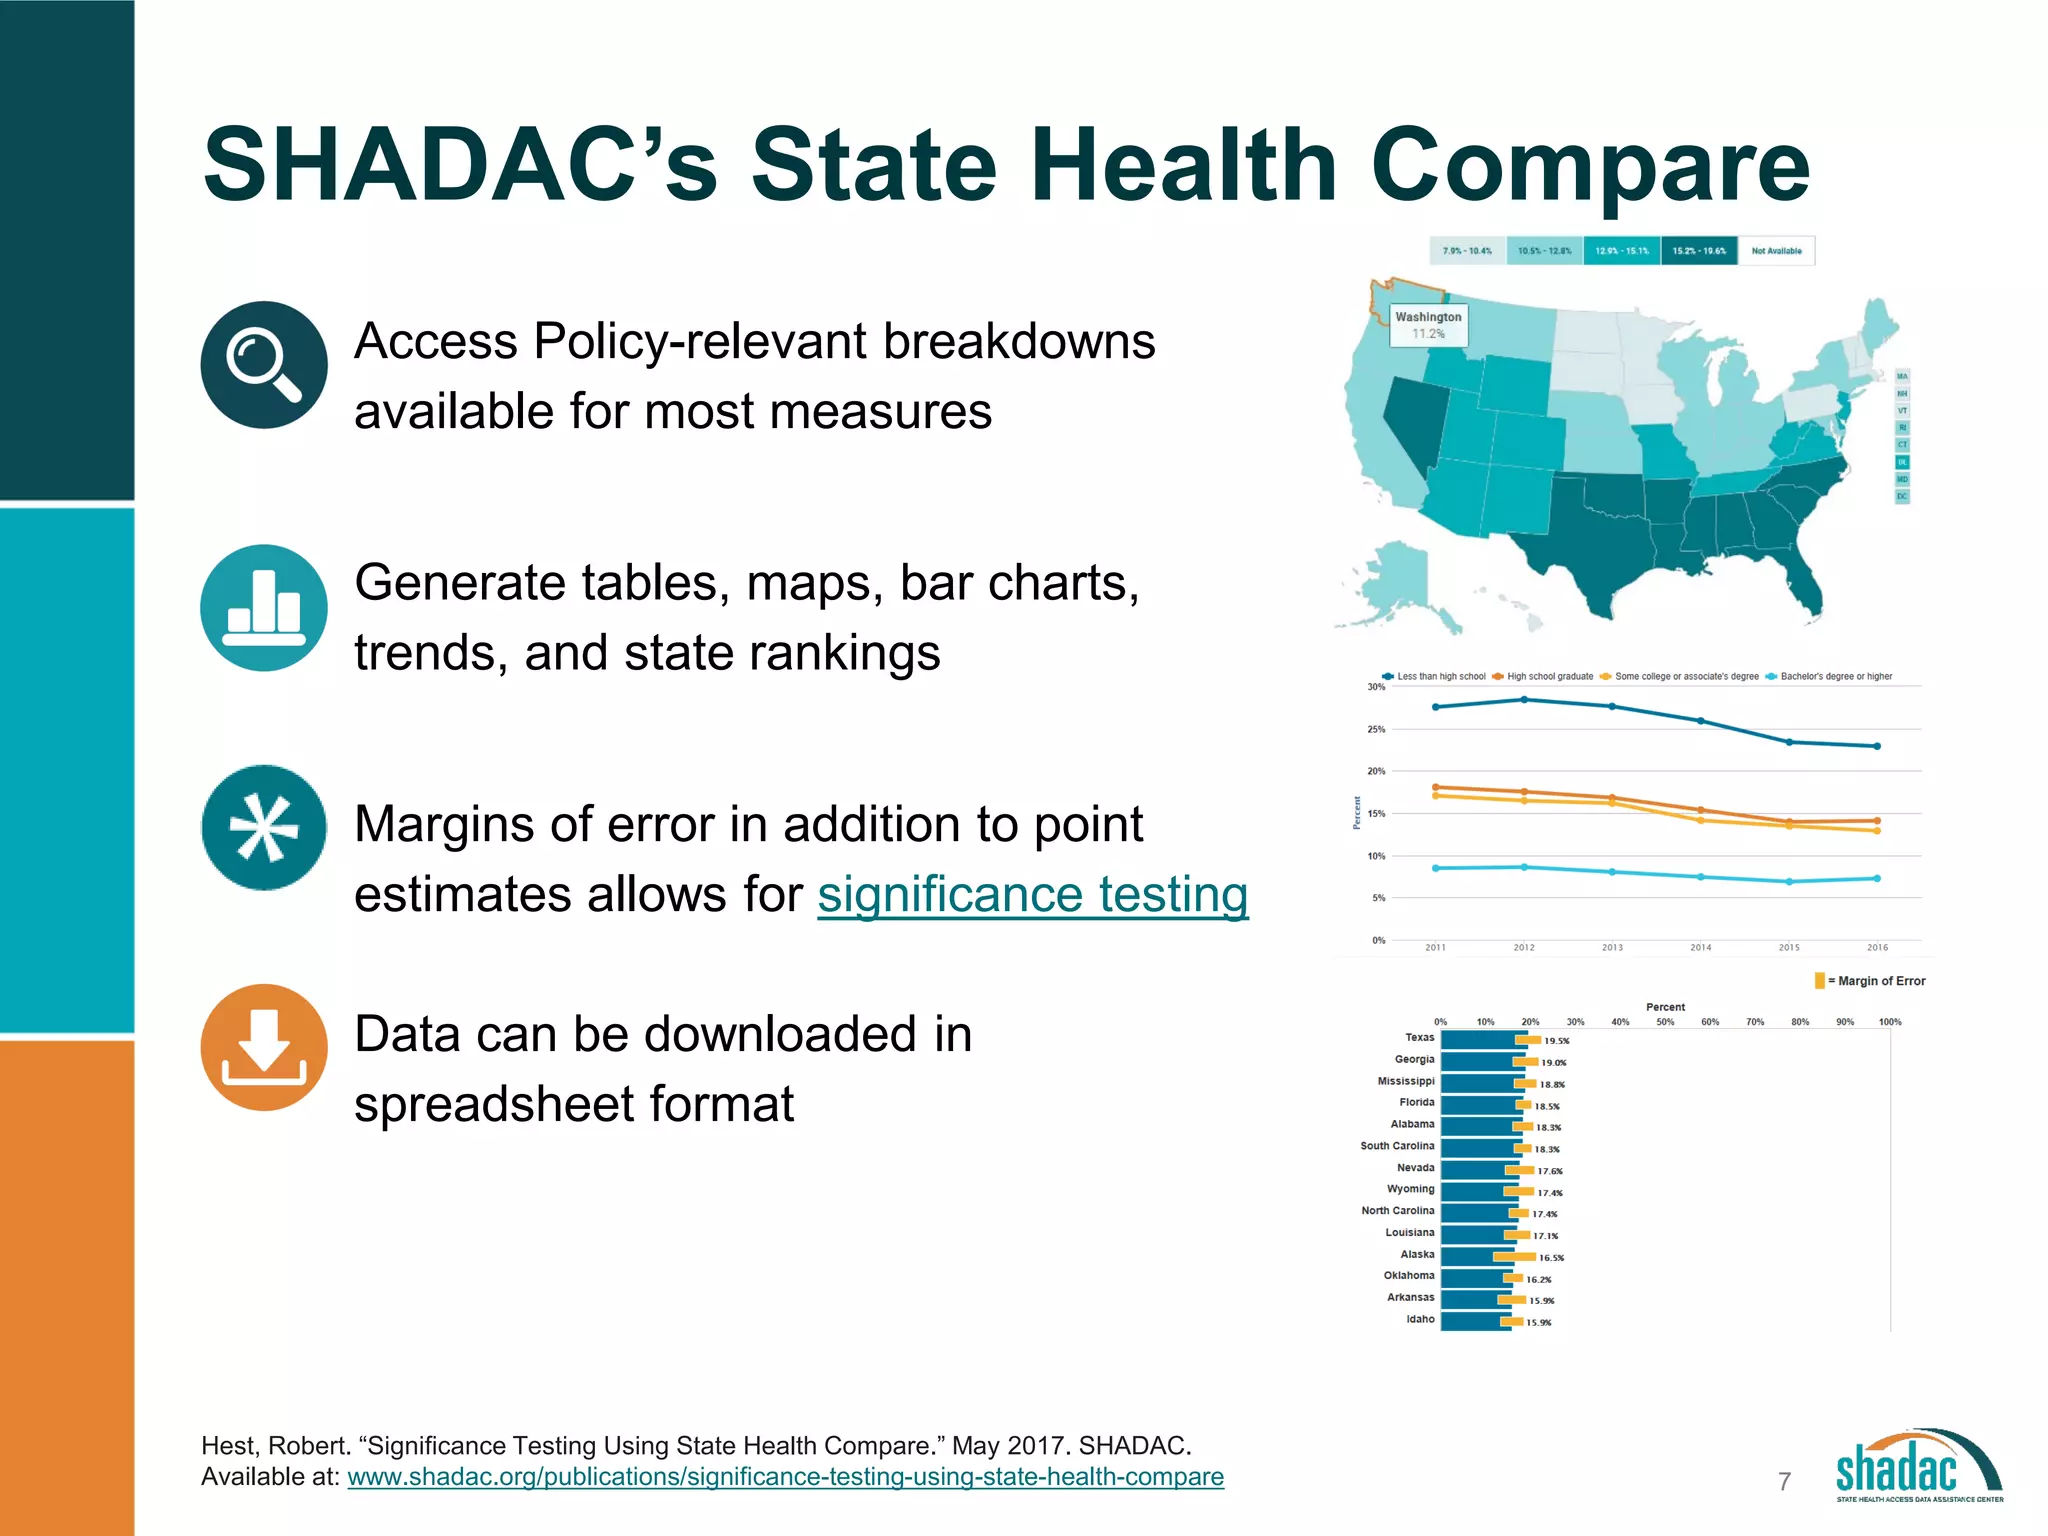
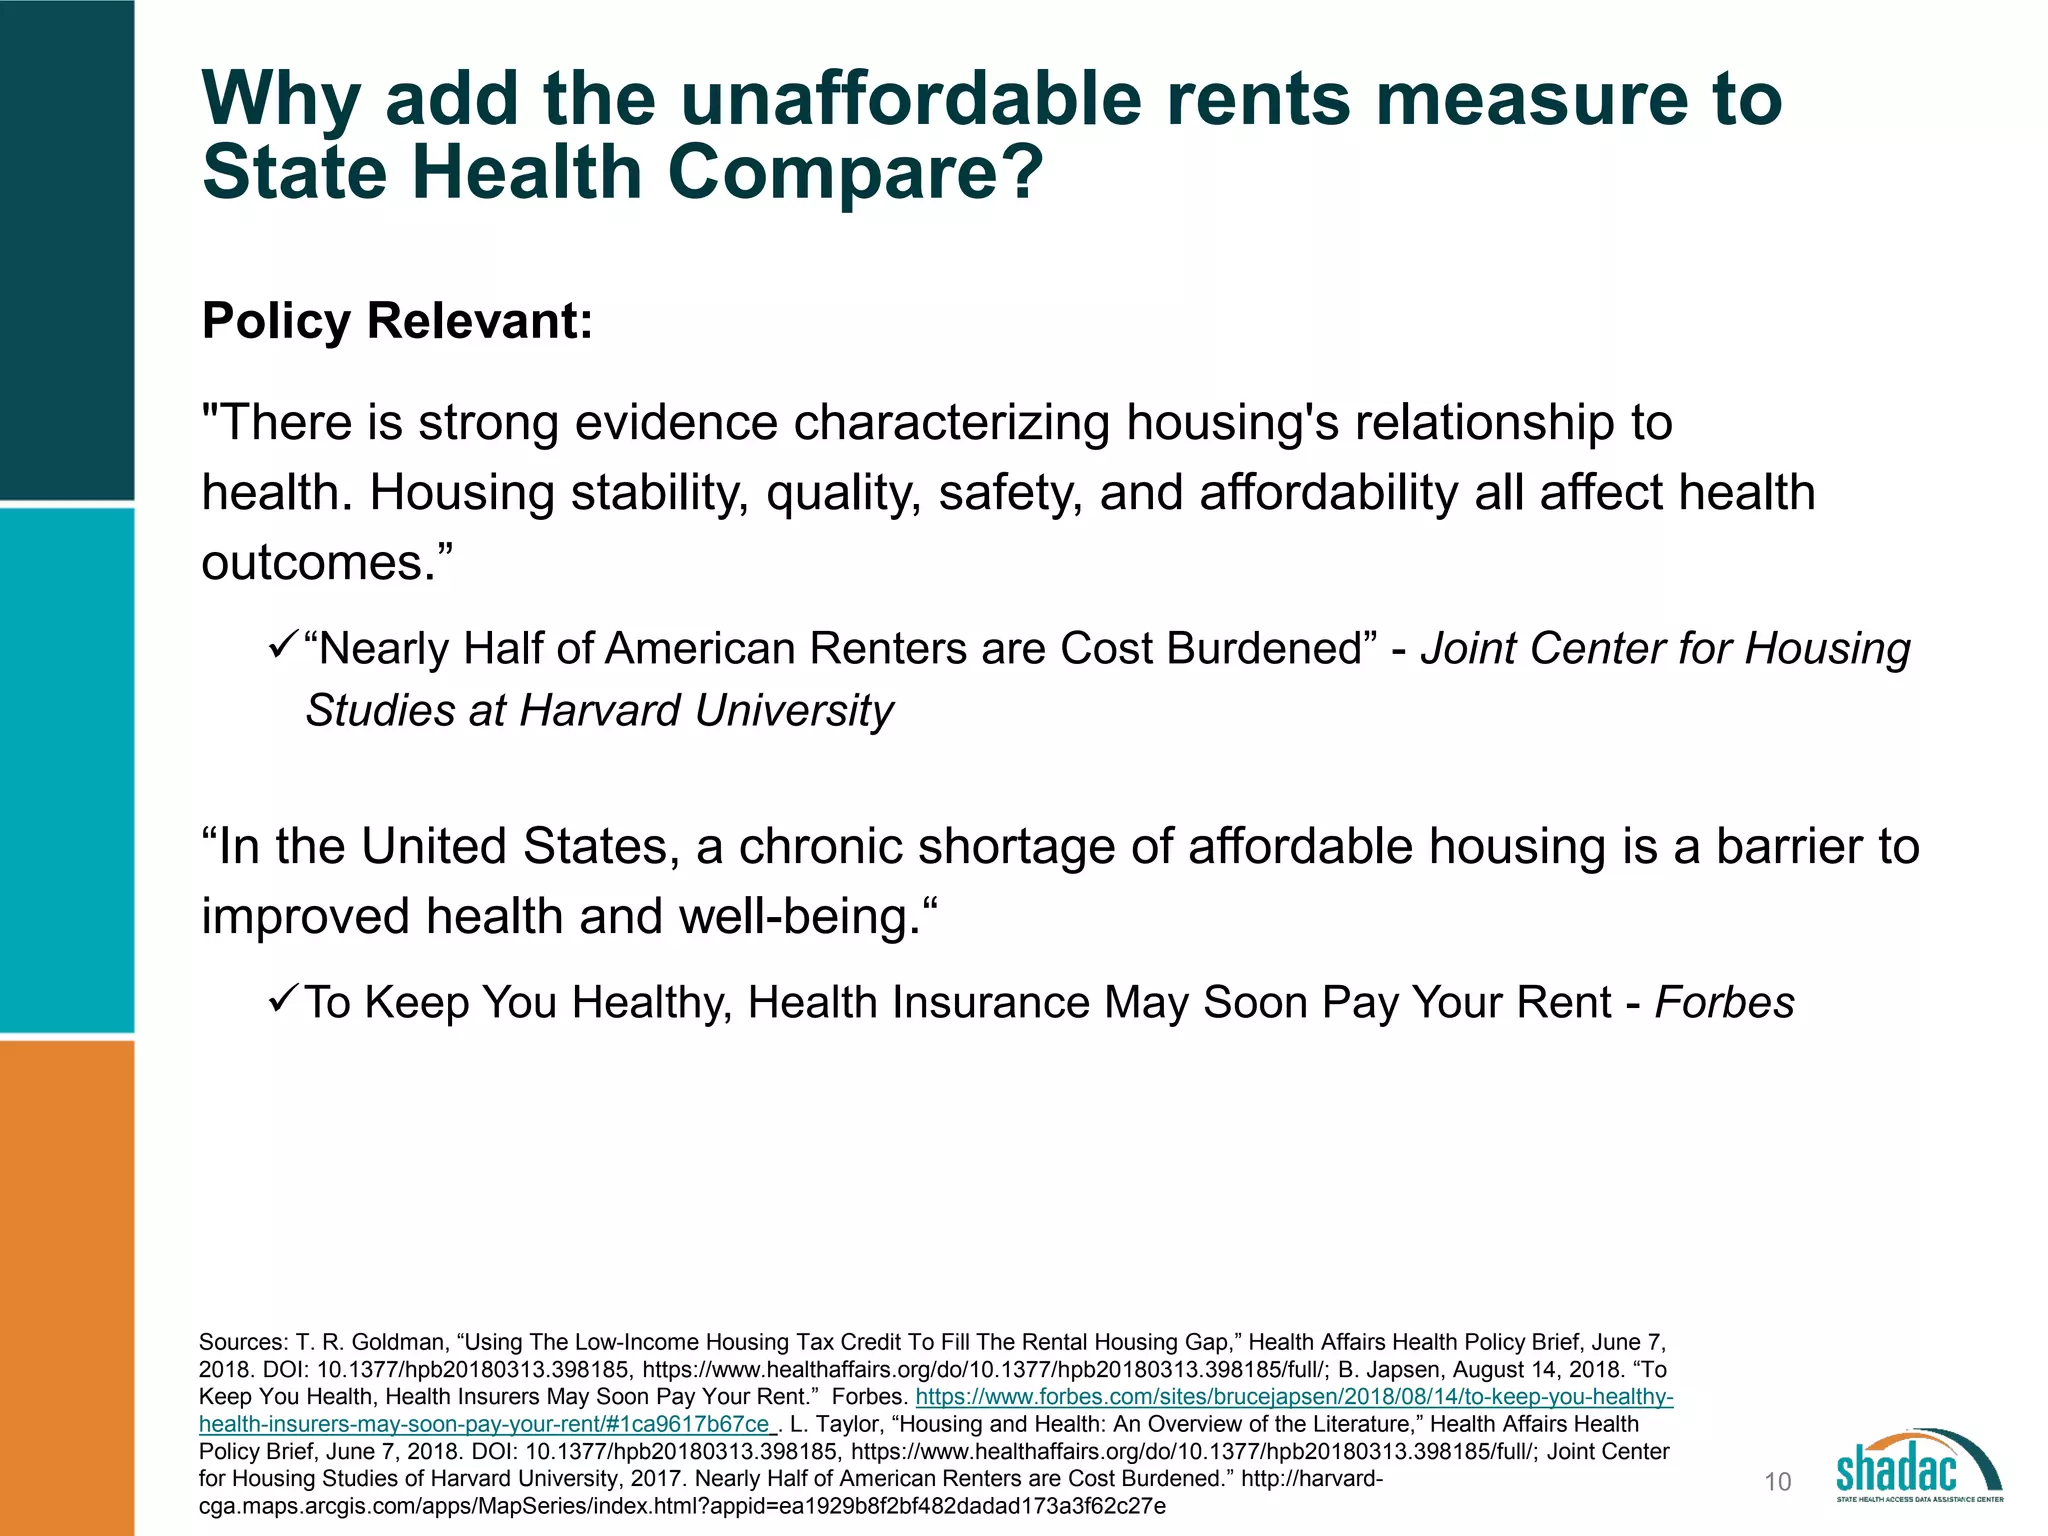
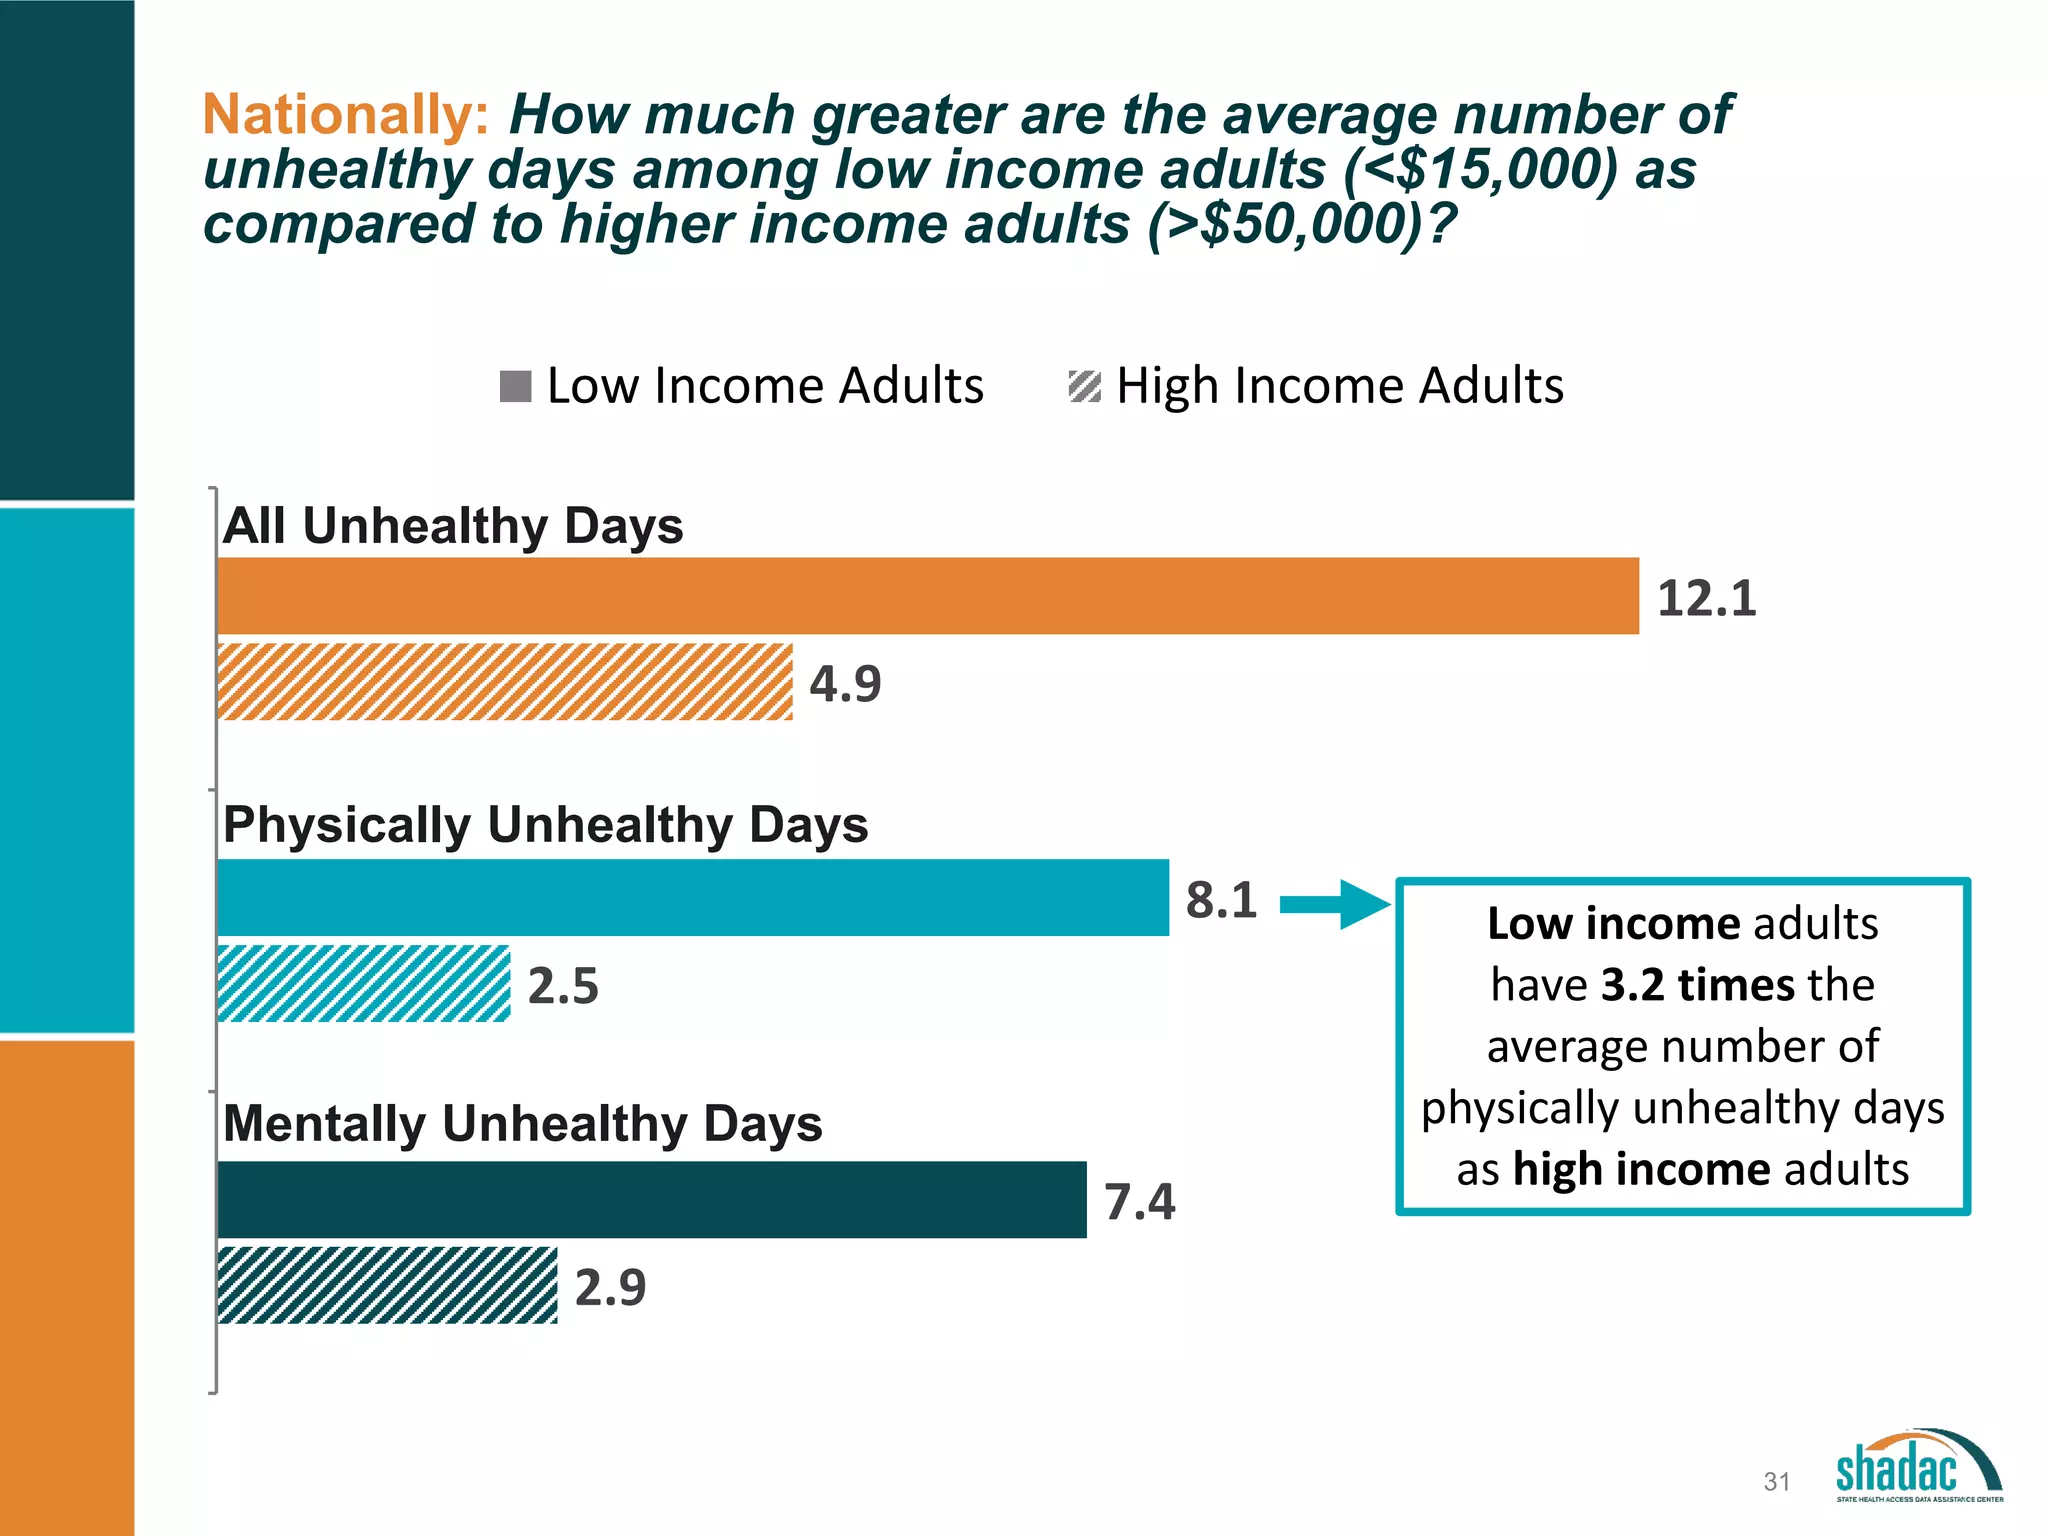
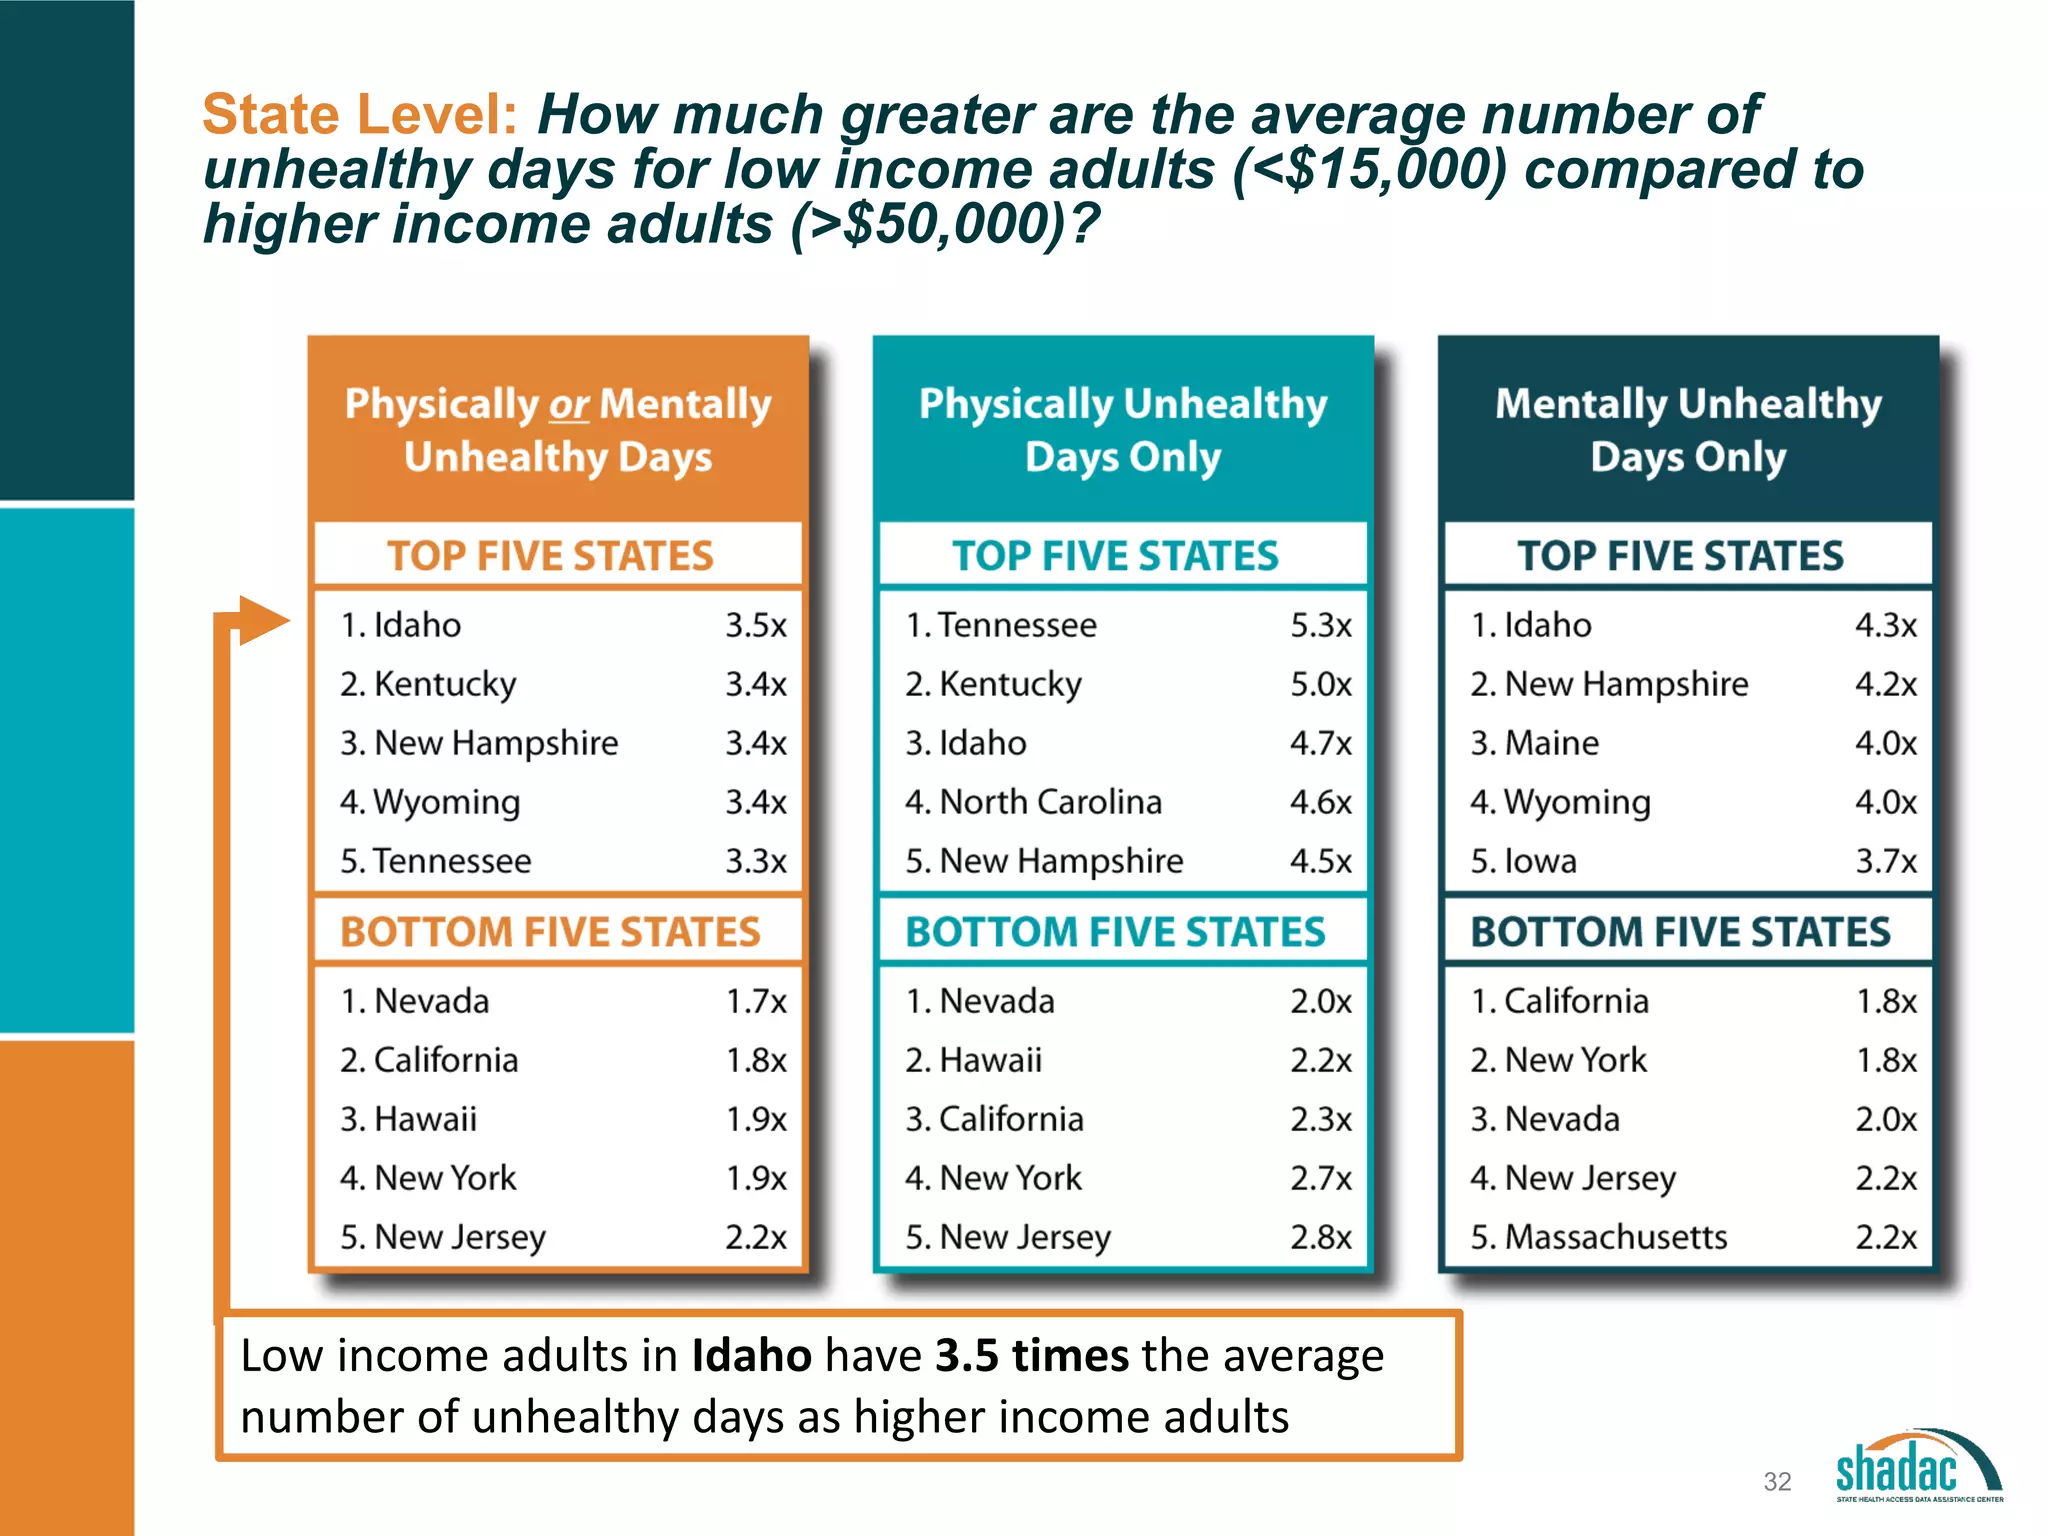
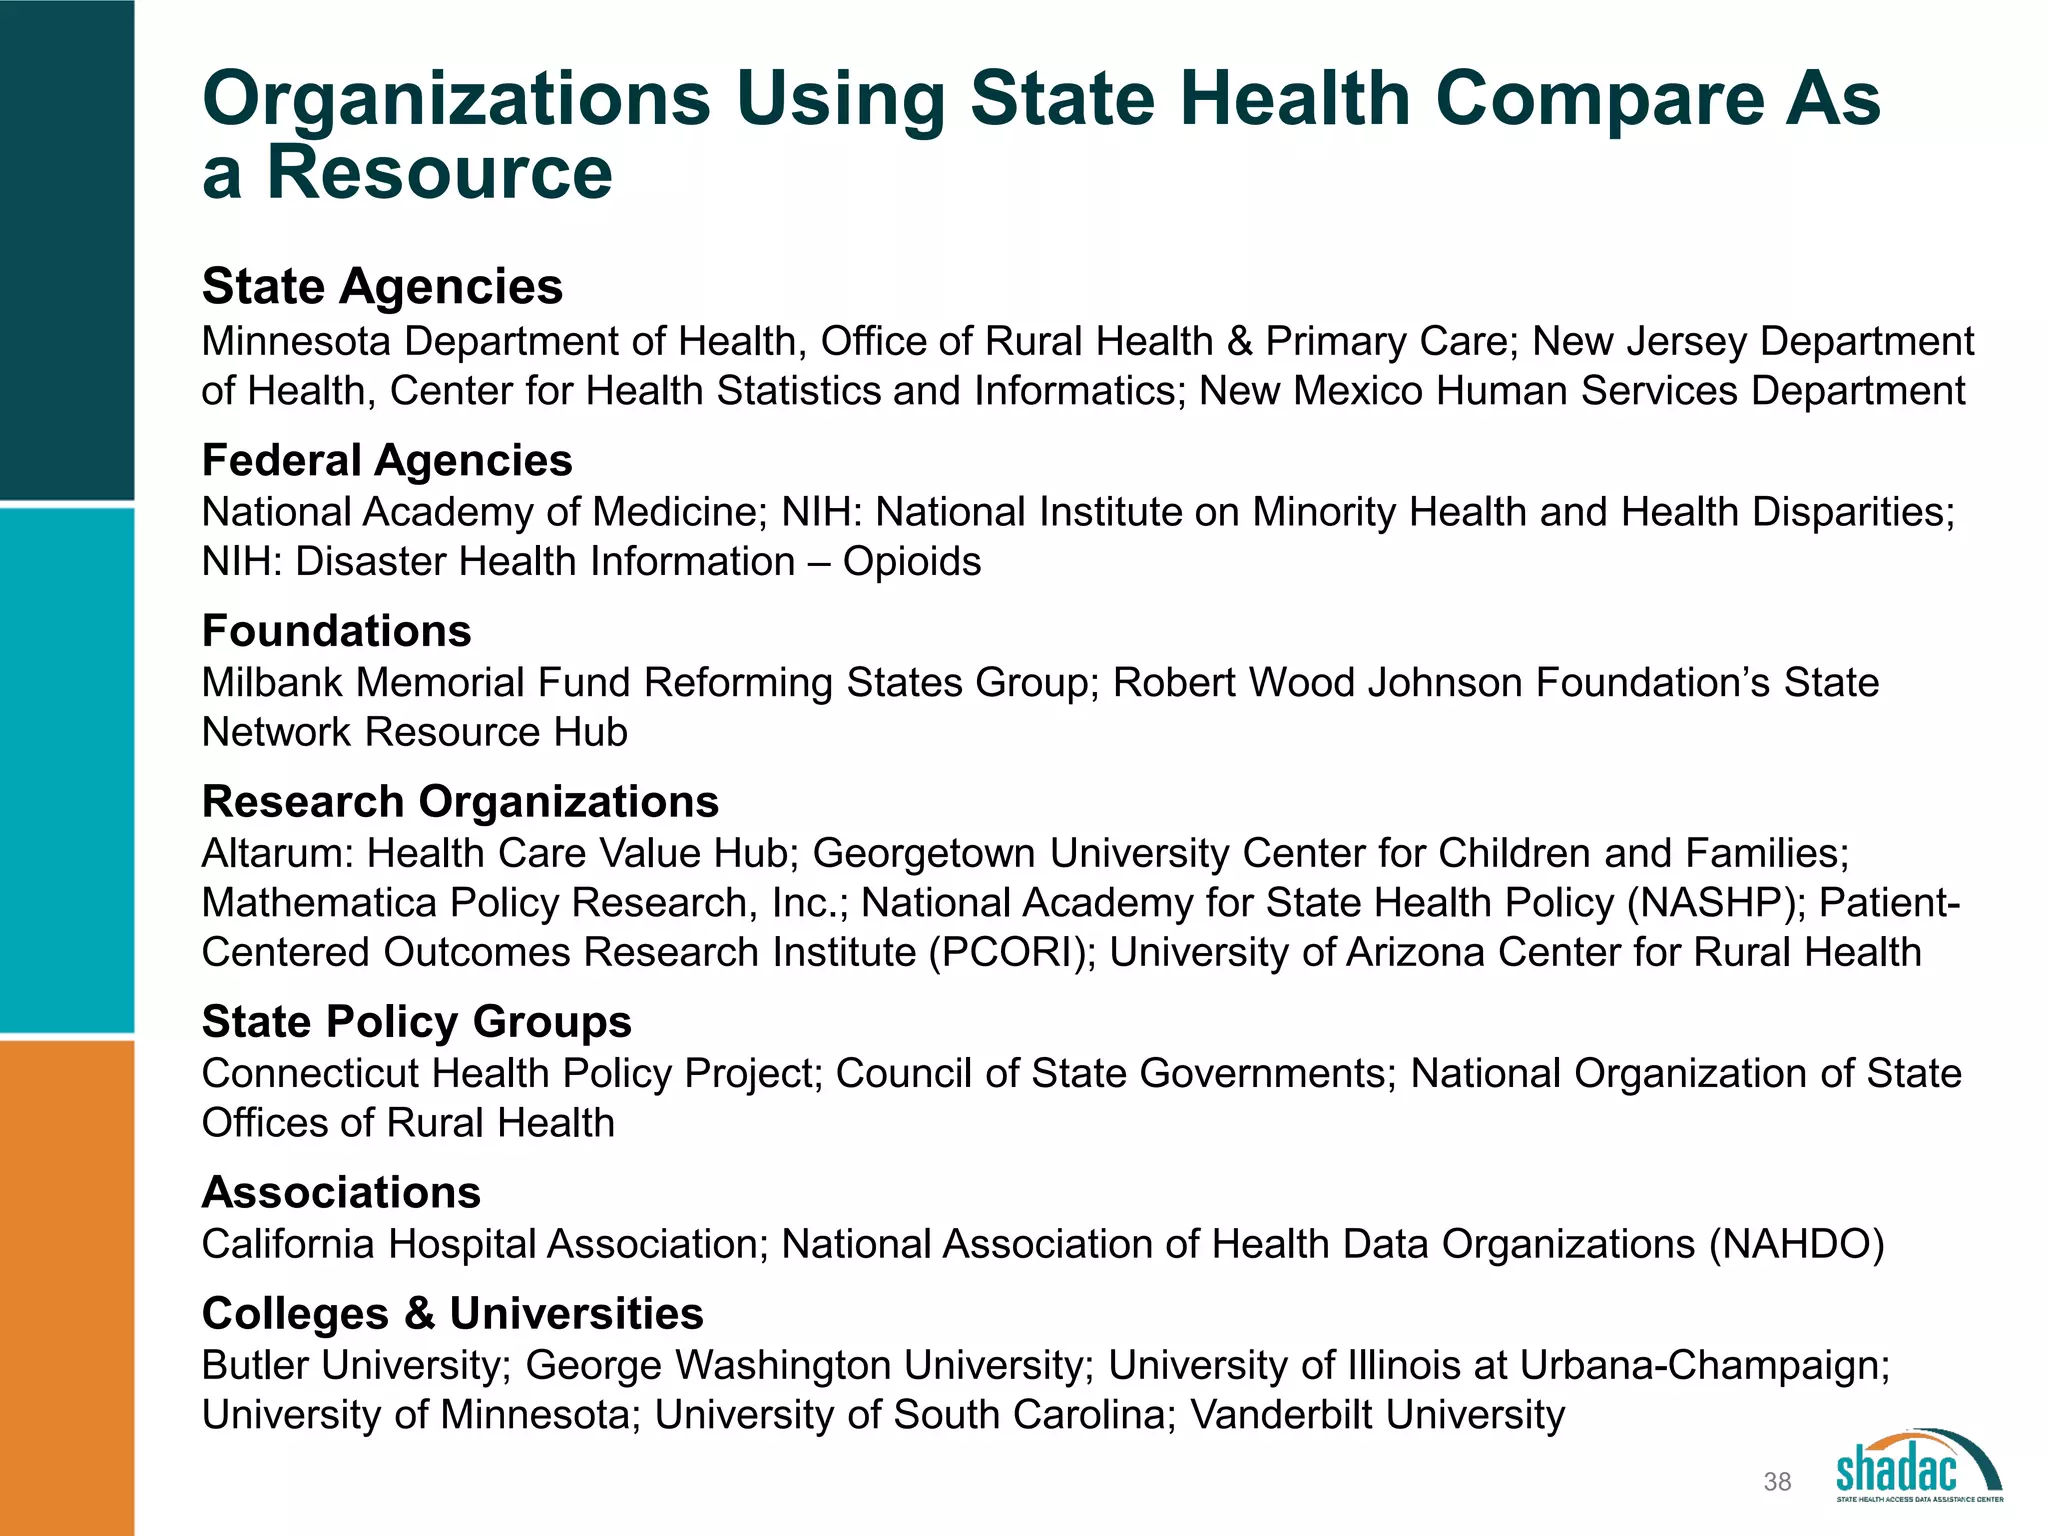
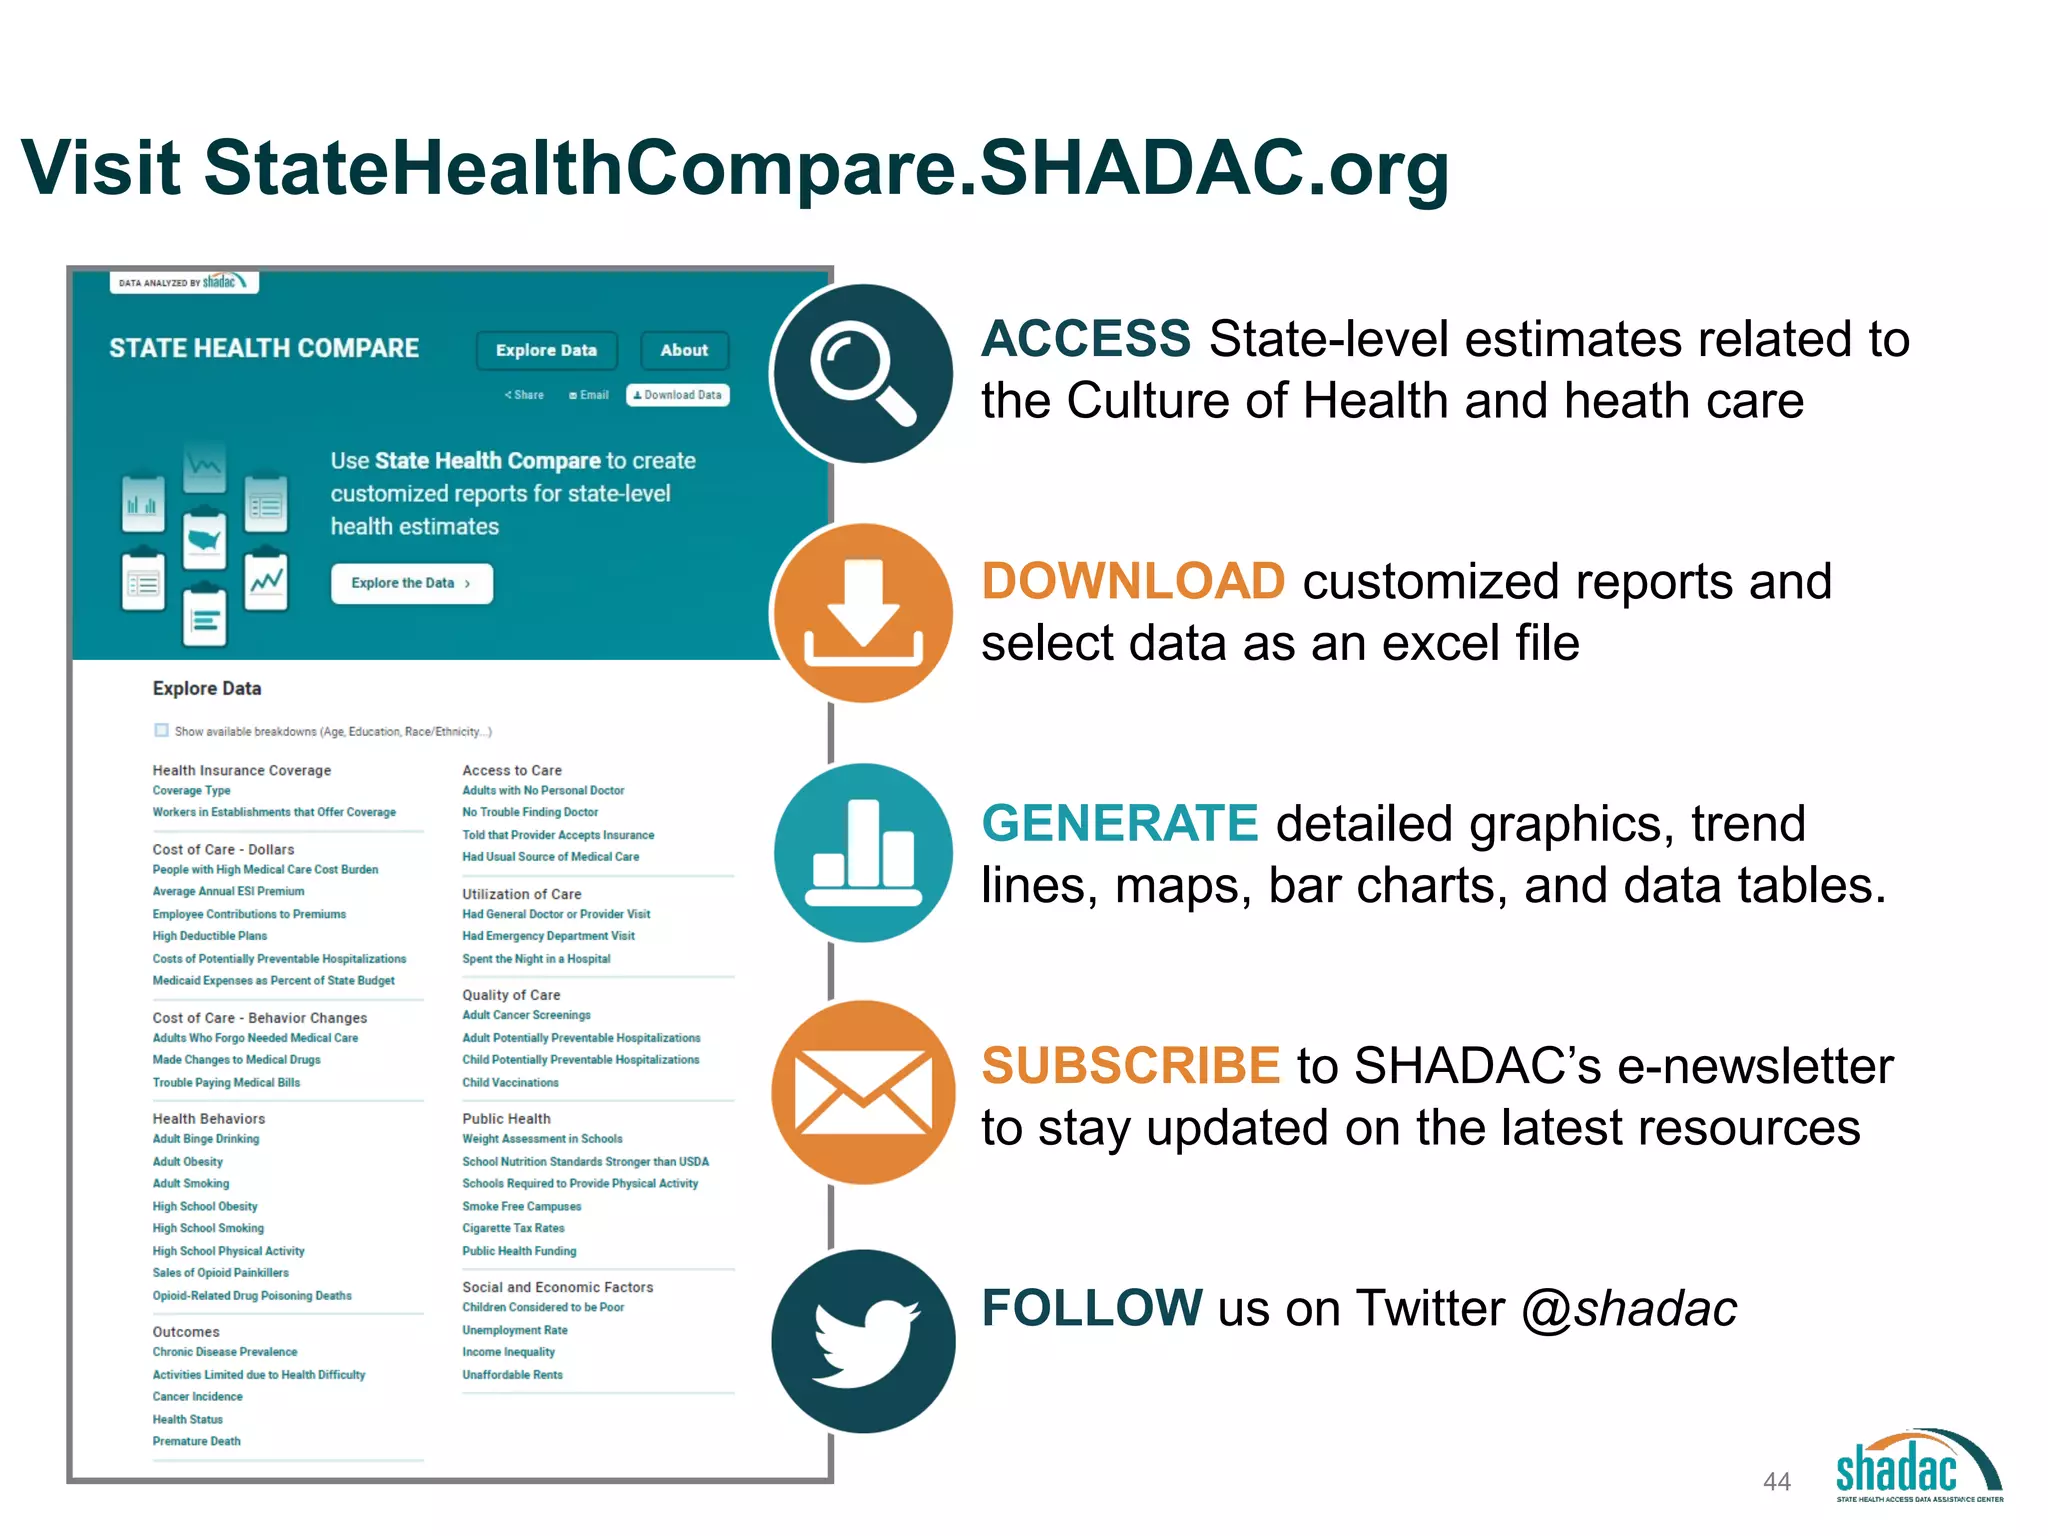
Exploring Disparities Using New
and Updated Measures on
SHADAC’S State Health Compare
February 6, 2019 - 1:00 PM CDT
You will be connected to broadcast audio through your computer.
You can also connect via telephone:
(800) 289-0462, Passcode 657279
Slides and handouts can be found at:
www.shadac.org/ExploringDisparitiesWebinar
Technical Items
2
• For those dialing in: Phones automatically muted
• Submit questions using the chat window at any time during the webinar
• Problems:
• Call Readytalk’s help line: (800) 843-9166
• Ask for help using the chat feature
• Download the slides at www.shadac.org/ExploringDisparitiesWebinar
• Webinar archive will be posted on SHADAC’s website
• E-mail notice will be sent to participants
SHADAC Director
Lynn Blewett, PhD, MPA
3
Presenters
4
Robert Hest, MPP
SHADAC Research Fellow
Brett Fried, MS
SHADAC Senior Research Fellow
State Health Compare Overview
Robert Hest, MPP
Research Fellow, SHADAC
5
SHADAC’s State Health Compare --
40+ State-level Measures of:
• Health Insurance Coverage
• Cost of Care
• Health Behaviors
• Outcomes
• Access to Care
• Utilization of Care
• Quality of Care
• Public Health
• Social and Economic Factors
6
SHADAC’s State Health Compare
Access Policy-relevant breakdowns
available for most measures
Generate tables, maps, bar charts,
trends, and state rankings
Margins of error in addition to point
estimates allows for significance testing
Data can be downloaded in
spreadsheet format
Hest, Robert. “Significance Testing Using State Health Compare.” May 2017. SHADAC.
Available at: www.shadac.org/publications/significance-testing-using-state-health-compare 7
16 Data Sources
• American Community Survey (ACS)
• Current Population Survey (CPS)
• Behavioral Risk Factor Surveillance System (BRFSS)
• National Health Interview Survey (NHIS)
• Healthcare Cost and Utilization Project (HCUP)
• Medical Expenditure Panel Survey (MEPS-IC)
• Other sources
8
Background on New Measures:
UNAFFORDABLE RENTS
9
Why add the unaffordable rents measure to
State Health Compare?
10
Policy Relevant:
"There is strong evidence characterizing housing's relationship to
health. Housing stability, quality, safety, and affordability all affect health
outcomes.”
“Nearly Half of American Renters are Cost Burdened” - Joint Center for Housing
Studies at Harvard University
“In the United States, a chronic shortage of affordable housing is a barrier to
improved health and well-being.“
To Keep You Healthy, Health Insurance May Soon Pay Your Rent - Forbes
Sources: T. R. Goldman, “Using The Low-Income Housing Tax Credit To Fill The Rental Housing Gap,” Health Affairs Health Policy Brief, June 7,
2018. DOI: 10.1377/hpb20180313.398185, https://www.healthaffairs.org/do/10.1377/hpb20180313.398185/full/; B. Japsen, August 14, 2018. “To
Keep You Health, Health Insurers May Soon Pay Your Rent.” Forbes. https://www.forbes.com/sites/brucejapsen/2018/08/14/to-keep-you-healthy-
health-insurers-may-soon-pay-your-rent/#1ca9617b67ce . L. Taylor, “Housing and Health: An Overview of the Literature,” Health Affairs Health
Policy Brief, June 7, 2018. DOI: 10.1377/hpb20180313.398185, https://www.healthaffairs.org/do/10.1377/hpb20180313.398185/full/; Joint Center
for Housing Studies of Harvard University, 2017. Nearly Half of American Renters are Cost Burdened.” http://harvard-
cga.maps.arcgis.com/apps/MapSeries/index.html?appid=ea1929b8f2bf482dadad173a3f62c27e
Why add the unaffordable rents measure to
State Health Compare (cont’d)?
11
Other reasons for adding this measure:
• Available for all states and for key subpopulations
• Allows for statistical testing
• Data comes out annually
• Customizable because it is microdata
• Available over time
Source: T. R. Goldman, “Using The Low-Income Housing Tax Credit To Fill The Rental Housing Gap,” Health Affairs Health Policy
Brief, June 7, 2018. DOI: 10.1377/hpb20180313.398185, https://www.healthaffairs.org/do/10.1377/hpb20180313.398185/full/
Data Source for Unaffordable Rents:
The American Community Survey (ACS)
12
• Primary Focus: General household survey; replaced decennial census
long form
• Administered by the Census Bureau
• Conducted annually in all states and DC
• Target Population for Webinar: Households that rent
• Sample size: 3,200,000 individuals in 2017
Variables/Questions in the ACS for
Unaffordable Rents?
13
• Housing Tenure: Is this house, apartment or mobile home rented?
• Gross Rent: Recoded variable from census that reports the gross rental
costs of the housing unit, including contract rent plus additional costs for
utilities
• Household Income: Recoded and includes the income of the
householder and all other individuals 15 years old and over in the
household.
Why use the 30% affordability rule?
14
• HUD and the USDA use the 30% affordability rule in the rental programs
they administer:
• Section 8 voucher program and project based rental assistance
• Public Housing
• Section 202 Housing for the elderly
• Section 521 Rental Assistance
• It is used by the Census Bureau
and other research organizations
to define housing cost burden
Census map of housing cost burden for renters, 2006
Sources: Brennan, M and M. Galvez. 2017. “Housing as a Platform, Strengthening the Foundation for Well-Being,” Urban Institute,
Washington, D. C. https://www.urban.org/sites/default/files/publication/.../housing-as-platform_1.pdf
Schwartz, M. & Wilson E. 2007. Who Can Afford to Live in a Home?: A look at data from the 2006 American Community Survey.”
Washington D.C, U.S. Census Bureau. https://www.census.gov/housing/census/publications/who-can-afford.pdf
Limitations to the Unaffordable Rents measure?
15
• As a measure of financial burden it doesn’t account for neighborhood
school quality, public safety and access to jobs and amenities.
• Does not take into account family size
• Higher income households can pay more for housing and still have
enough left over for necessities
Source: Herbert, C., Hermann, A., McCue, D. 2018. Joint Center for Housing Studies of Harvard University, Measuring Housing
Affordability: Assessing the 30% of Income Standard http://www.jchs.harvard.edu/research-areas/working-papers/measuring-housing-
affordability-assessing-30-percent-income-standard
Breakdowns available for unaffordable rents
on State Health Compare
16
Medicaid Enrollment
• Rental households with a Medicaid enrollee (Medicaid rental households)
• Rental households without a Medicaid enrollee (Non-Medicaid rental
households)
Household Income
• Rental households with incomes less than $25,000
• Rental households with incomes from $25,000 to $49,999
• Rental households with incomes $50,000 or greater
Disability Status
• Rental households with a person that has a disability
• Rental households without a person that has a disability
Race/Ethnicity
• Rental households with a person of color in the household
• Rental households without a person of color in the household
Variation Between States in Unaffordable Rents
for Rental Households, 2017
17
Among rental
households in Florida:
53.8% have
unaffordable rents
59.7%
39.4%
Medicaid Rental Households
with Unaffordable Rents
Non-Medicaid Rental Households
with Unaffordable Rents
Among Rentals in the United States
Percentage Point Difference: Medicaid Breakdown of
Unaffordable Rents in the U.S, 2017
18
20.3 pp
Difference
Percentage Point Difference: Medicaid Breakdown
of Unaffordable Rents by State, 2017
19
Percentage Point Difference: Household Income
Breakdown of Unaffordable Rents in the U.S, 2017
20
81.4%
12.7%
Low Income (<25,000)
Rental Households with
Unaffordable Rents
Higher Income (>50,000)
Rental Households with
Unaffordable Rents
Among Rentals in the United States
68.7 pp
Difference
Percentage Point Difference: Income Category
Breakdown of Unaffordable Rents by State, 2017
21
Background on New Measures:
UNHEALTHY DAYS
222
Why add the Unhealthy Days Measures to
State Health Compare?
23
Policy Relevant:
"Because Healthy Days captures broad dimensions of health from the
individual's perspective, it is a simple way to holistically measure the health and
well-being of a population and its trend over time."
“The Healthy Days measures have broad applications for federal, state, and
local governments to better understand the needs of their communities and to
identify vulnerable subpopulations.”
“It baffles me that not everyone is using this as a standard tool of measuring
progress within communities.” – Humana CMO, Mary Caffrey
Sources: S. Lane Slabaugh, Mona Shah, Matthew Zack, Laura Happe, Tristan Cordier, Eric Havens, Evan Davidson, Michael Miao,
Todd Prewitt, Haomiao Jia “Leveraging Health-Related Quality of Life in Population Health Management: The Case for Healthy Days.”
Population Health Manag. 20(1): 13–22. doi: 10.1089/pop.2015.0162. https://www.ncbi.nlm.nih.gov/pmc/articles/PMC5278802/;
Caffrey, M. (2018). Humana’s “Bold Goal” update finds more healthy days for Medicare Members in 4 cities. American Journal of
Managed Care, “In Focus” Blog. Available at https://www.ajmc.com/focus-of-the-week/humanas-bold-goal-update-finds-more-healthy-
days-for-medicare-members-in-4-cities
Why add the Unhealthy Days Measures to
State Health Compare (cont’d)?
24
Other reasons for adding this measure:
• Available for all states and for subpopulations
• Allows for statistical testing
• Data comes out annually
• Customizable because it is microdata
• Available over time
Data Source for Unhealthy Days: The Behavioral
Risk Factor Surveillance System (BRFSS)
25
• Primary Focus: Health-related risk behaviors, chronic health conditions
and use of preventive services
• Administered by the Centers for Disease Control and Prevention (CDC)
• Conducted annually in all states and DC
• Target Population: Civilian non-institutionalized population 18 years of age
and over
• Sample size: ~ 450,000 individuals in 2017
Questions on the BRFSS for Unhealthy Days?
26
• Physically Unhealthy Days: “Now thinking about your physical health,
which includes physical illness and injury, for how many days during the
past 30 days was your physical health not good?”
• Mentally Unhealthy Days: “Now thinking about your mental health, which
includes stress, depression, and problems with emotions, for how many
days during the past 30 days was your mental health not good?”
How are estimates for unhealthy days created?
27
Physically or Mentally Unhealthy Days: The number of “physically
unhealthy days” or “mentally healthy days” is summed across all adults in the
state and then divided by the number of adults in the state
All Unhealthy Days:
1) The number of “physically unhealthy days” and “mentally unhealthy days”
is summed to create an “all unhealthy days” total for each adult
2) The number of “all unhealthy days” is then summed across all adults in the
state
3) It is then divided by the number of adults in the state.
Limitations of the “all unhealthy days” measure
28
1) Overlap between the number of “physically unhealthy days” and
“mentally unhealthy days”
2) The “all unhealthy days” measure is truncated at 30 days.
Addressing the limitations
• The CDC has found that the pattern of responses to the unhealthy days
questions supports using the “all unhealthy days” measure.
• SHADAC reports all three types of measures separately so that it is
possible to highlight differences in physical health as well as mental health
Source: Centers for Disease Control and Prevention. Measuring Healthy Days. Atlanta, Georgia: CDC, November 2000.
Breakdowns available for the unhealthy days
measures on State Health Compare
29
• Household Income: <$15,000, $15,000 to $24,999, $25,000 to $49,999,
$50,000+
• Age: 18 to 34, 35 to 54, 55 to 64, 18 to 64, 65+
• Coverage Type: uninsured and insured
• Disability Status: with a disability and no disability
• Education: <HS, HS graduate, some college and BA+
• Race/Ethnicity: Hispanic/Latino, White, Black and Other
Variation Between States for the Unhealthy
Days Measures, BRFSS 2017
30
Nationally: How much greater are the average number of
unhealthy days among low income adults (<$15,000) as
compared to higher income adults (>$50,000)?
31
2.9
2.5
4.9
7.4
8.1
12.1
1
2
3
Low Income Adults High Income Adults
Physically Unhealthy Days
Mentally Unhealthy Days
All Unhealthy Days
Low income adults
have 3.2 times the
average number of
physically unhealthy days
as high income adults
State Level: How much greater are the average number of
unhealthy days for low income adults (<$15,000) compared to
higher income adults (>$50,000)?
32
Low income adults in Idaho have 3.5 times the average
number of unhealthy days as higher income adults
Virtual State Health Compare Tour
Products that use
State Health Compare Data
36
37
Organizations Using State Health Compare As
a Resource
State Agencies
Minnesota Department of Health, Office of Rural Health & Primary Care; New Jersey Department
of Health, Center for Health Statistics and Informatics; New Mexico Human Services Department
Federal Agencies
National Academy of Medicine; NIH: National Institute on Minority Health and Health Disparities;
NIH: Disaster Health Information – Opioids
Foundations
Milbank Memorial Fund Reforming States Group; Robert Wood Johnson Foundation’s State
Network Resource Hub
Research Organizations
Altarum: Health Care Value Hub; Georgetown University Center for Children and Families;
Mathematica Policy Research, Inc.; National Academy for State Health Policy (NASHP); Patient-
Centered Outcomes Research Institute (PCORI); University of Arizona Center for Rural Health
State Policy Groups
Connecticut Health Policy Project; Council of State Governments; National Organization of State
Offices of Rural Health
Associations
California Hospital Association; National Association of Health Data Organizations (NAHDO)
Colleges & Universities
Butler University; George Washington University; University of Illinois at Urbana-Champaign;
University of Minnesota; University of South Carolina; Vanderbilt University
38
Millbank Memorial Fund – State Health Profiles
39
New Mexico Human Services Department
40
41
Minnesota Department of Health
42
Georgetown University Health Policy Institute
Question & Answer
43
Robert Hest, MPP
SHADAC
Brett Fried, MS
SHADAC
Please submit question using the chat box
or Tweet questions to @SHADAC.
Visit StateHealthCompare.SHADAC.org
ACCESS State-level estimates related to
the Culture of Health and heath care
DOWNLOAD customized reports and
select data as an excel file
GENERATE detailed graphics, trend
lines, maps, bar charts, and data tables.
SUBSCRIBE to SHADAC’s e-newsletter
to stay updated on the latest resources
FOLLOW us on Twitter @shadac
44
THANK YOU!
Please send direct inquires to:
Robert Hest, hestx005@umn.edu,
Brett Fried, bfried@umn.edu,
or shadac@umn.edu
statehealthcompare.shadac.org

Exploring Disparities Using New and Updated MEasures on SHADAC's State Health Compare

  • 1.
    Exploring Disparities UsingNew and Updated Measures on SHADAC’S State Health Compare February 6, 2019 - 1:00 PM CDT You will be connected to broadcast audio through your computer. You can also connect via telephone: (800) 289-0462, Passcode 657279 Slides and handouts can be found at: www.shadac.org/ExploringDisparitiesWebinar
  • 2.
    Technical Items 2 • Forthose dialing in: Phones automatically muted • Submit questions using the chat window at any time during the webinar • Problems: • Call Readytalk’s help line: (800) 843-9166 • Ask for help using the chat feature • Download the slides at www.shadac.org/ExploringDisparitiesWebinar • Webinar archive will be posted on SHADAC’s website • E-mail notice will be sent to participants
  • 3.
  • 4.
    Presenters 4 Robert Hest, MPP SHADACResearch Fellow Brett Fried, MS SHADAC Senior Research Fellow
  • 5.
    State Health CompareOverview Robert Hest, MPP Research Fellow, SHADAC 5
  • 6.
    SHADAC’s State HealthCompare -- 40+ State-level Measures of: • Health Insurance Coverage • Cost of Care • Health Behaviors • Outcomes • Access to Care • Utilization of Care • Quality of Care • Public Health • Social and Economic Factors 6
  • 7.
    SHADAC’s State HealthCompare Access Policy-relevant breakdowns available for most measures Generate tables, maps, bar charts, trends, and state rankings Margins of error in addition to point estimates allows for significance testing Data can be downloaded in spreadsheet format Hest, Robert. “Significance Testing Using State Health Compare.” May 2017. SHADAC. Available at: www.shadac.org/publications/significance-testing-using-state-health-compare 7
  • 8.
    16 Data Sources •American Community Survey (ACS) • Current Population Survey (CPS) • Behavioral Risk Factor Surveillance System (BRFSS) • National Health Interview Survey (NHIS) • Healthcare Cost and Utilization Project (HCUP) • Medical Expenditure Panel Survey (MEPS-IC) • Other sources 8
  • 9.
    Background on NewMeasures: UNAFFORDABLE RENTS 9
  • 10.
    Why add theunaffordable rents measure to State Health Compare? 10 Policy Relevant: "There is strong evidence characterizing housing's relationship to health. Housing stability, quality, safety, and affordability all affect health outcomes.” “Nearly Half of American Renters are Cost Burdened” - Joint Center for Housing Studies at Harvard University “In the United States, a chronic shortage of affordable housing is a barrier to improved health and well-being.“ To Keep You Healthy, Health Insurance May Soon Pay Your Rent - Forbes Sources: T. R. Goldman, “Using The Low-Income Housing Tax Credit To Fill The Rental Housing Gap,” Health Affairs Health Policy Brief, June 7, 2018. DOI: 10.1377/hpb20180313.398185, https://www.healthaffairs.org/do/10.1377/hpb20180313.398185/full/; B. Japsen, August 14, 2018. “To Keep You Health, Health Insurers May Soon Pay Your Rent.” Forbes. https://www.forbes.com/sites/brucejapsen/2018/08/14/to-keep-you-healthy- health-insurers-may-soon-pay-your-rent/#1ca9617b67ce . L. Taylor, “Housing and Health: An Overview of the Literature,” Health Affairs Health Policy Brief, June 7, 2018. DOI: 10.1377/hpb20180313.398185, https://www.healthaffairs.org/do/10.1377/hpb20180313.398185/full/; Joint Center for Housing Studies of Harvard University, 2017. Nearly Half of American Renters are Cost Burdened.” http://harvard- cga.maps.arcgis.com/apps/MapSeries/index.html?appid=ea1929b8f2bf482dadad173a3f62c27e
  • 11.
    Why add theunaffordable rents measure to State Health Compare (cont’d)? 11 Other reasons for adding this measure: • Available for all states and for key subpopulations • Allows for statistical testing • Data comes out annually • Customizable because it is microdata • Available over time Source: T. R. Goldman, “Using The Low-Income Housing Tax Credit To Fill The Rental Housing Gap,” Health Affairs Health Policy Brief, June 7, 2018. DOI: 10.1377/hpb20180313.398185, https://www.healthaffairs.org/do/10.1377/hpb20180313.398185/full/
  • 12.
    Data Source forUnaffordable Rents: The American Community Survey (ACS) 12 • Primary Focus: General household survey; replaced decennial census long form • Administered by the Census Bureau • Conducted annually in all states and DC • Target Population for Webinar: Households that rent • Sample size: 3,200,000 individuals in 2017
  • 13.
    Variables/Questions in theACS for Unaffordable Rents? 13 • Housing Tenure: Is this house, apartment or mobile home rented? • Gross Rent: Recoded variable from census that reports the gross rental costs of the housing unit, including contract rent plus additional costs for utilities • Household Income: Recoded and includes the income of the householder and all other individuals 15 years old and over in the household.
  • 14.
    Why use the30% affordability rule? 14 • HUD and the USDA use the 30% affordability rule in the rental programs they administer: • Section 8 voucher program and project based rental assistance • Public Housing • Section 202 Housing for the elderly • Section 521 Rental Assistance • It is used by the Census Bureau and other research organizations to define housing cost burden Census map of housing cost burden for renters, 2006 Sources: Brennan, M and M. Galvez. 2017. “Housing as a Platform, Strengthening the Foundation for Well-Being,” Urban Institute, Washington, D. C. https://www.urban.org/sites/default/files/publication/.../housing-as-platform_1.pdf Schwartz, M. & Wilson E. 2007. Who Can Afford to Live in a Home?: A look at data from the 2006 American Community Survey.” Washington D.C, U.S. Census Bureau. https://www.census.gov/housing/census/publications/who-can-afford.pdf
  • 15.
    Limitations to theUnaffordable Rents measure? 15 • As a measure of financial burden it doesn’t account for neighborhood school quality, public safety and access to jobs and amenities. • Does not take into account family size • Higher income households can pay more for housing and still have enough left over for necessities Source: Herbert, C., Hermann, A., McCue, D. 2018. Joint Center for Housing Studies of Harvard University, Measuring Housing Affordability: Assessing the 30% of Income Standard http://www.jchs.harvard.edu/research-areas/working-papers/measuring-housing- affordability-assessing-30-percent-income-standard
  • 16.
    Breakdowns available forunaffordable rents on State Health Compare 16 Medicaid Enrollment • Rental households with a Medicaid enrollee (Medicaid rental households) • Rental households without a Medicaid enrollee (Non-Medicaid rental households) Household Income • Rental households with incomes less than $25,000 • Rental households with incomes from $25,000 to $49,999 • Rental households with incomes $50,000 or greater Disability Status • Rental households with a person that has a disability • Rental households without a person that has a disability Race/Ethnicity • Rental households with a person of color in the household • Rental households without a person of color in the household
  • 17.
    Variation Between Statesin Unaffordable Rents for Rental Households, 2017 17 Among rental households in Florida: 53.8% have unaffordable rents
  • 18.
    59.7% 39.4% Medicaid Rental Households withUnaffordable Rents Non-Medicaid Rental Households with Unaffordable Rents Among Rentals in the United States Percentage Point Difference: Medicaid Breakdown of Unaffordable Rents in the U.S, 2017 18 20.3 pp Difference
  • 19.
    Percentage Point Difference:Medicaid Breakdown of Unaffordable Rents by State, 2017 19
  • 20.
    Percentage Point Difference:Household Income Breakdown of Unaffordable Rents in the U.S, 2017 20 81.4% 12.7% Low Income (<25,000) Rental Households with Unaffordable Rents Higher Income (>50,000) Rental Households with Unaffordable Rents Among Rentals in the United States 68.7 pp Difference
  • 21.
    Percentage Point Difference:Income Category Breakdown of Unaffordable Rents by State, 2017 21
  • 22.
    Background on NewMeasures: UNHEALTHY DAYS 222
  • 23.
    Why add theUnhealthy Days Measures to State Health Compare? 23 Policy Relevant: "Because Healthy Days captures broad dimensions of health from the individual's perspective, it is a simple way to holistically measure the health and well-being of a population and its trend over time." “The Healthy Days measures have broad applications for federal, state, and local governments to better understand the needs of their communities and to identify vulnerable subpopulations.” “It baffles me that not everyone is using this as a standard tool of measuring progress within communities.” – Humana CMO, Mary Caffrey Sources: S. Lane Slabaugh, Mona Shah, Matthew Zack, Laura Happe, Tristan Cordier, Eric Havens, Evan Davidson, Michael Miao, Todd Prewitt, Haomiao Jia “Leveraging Health-Related Quality of Life in Population Health Management: The Case for Healthy Days.” Population Health Manag. 20(1): 13–22. doi: 10.1089/pop.2015.0162. https://www.ncbi.nlm.nih.gov/pmc/articles/PMC5278802/; Caffrey, M. (2018). Humana’s “Bold Goal” update finds more healthy days for Medicare Members in 4 cities. American Journal of Managed Care, “In Focus” Blog. Available at https://www.ajmc.com/focus-of-the-week/humanas-bold-goal-update-finds-more-healthy- days-for-medicare-members-in-4-cities
  • 24.
    Why add theUnhealthy Days Measures to State Health Compare (cont’d)? 24 Other reasons for adding this measure: • Available for all states and for subpopulations • Allows for statistical testing • Data comes out annually • Customizable because it is microdata • Available over time
  • 25.
    Data Source forUnhealthy Days: The Behavioral Risk Factor Surveillance System (BRFSS) 25 • Primary Focus: Health-related risk behaviors, chronic health conditions and use of preventive services • Administered by the Centers for Disease Control and Prevention (CDC) • Conducted annually in all states and DC • Target Population: Civilian non-institutionalized population 18 years of age and over • Sample size: ~ 450,000 individuals in 2017
  • 26.
    Questions on theBRFSS for Unhealthy Days? 26 • Physically Unhealthy Days: “Now thinking about your physical health, which includes physical illness and injury, for how many days during the past 30 days was your physical health not good?” • Mentally Unhealthy Days: “Now thinking about your mental health, which includes stress, depression, and problems with emotions, for how many days during the past 30 days was your mental health not good?”
  • 27.
    How are estimatesfor unhealthy days created? 27 Physically or Mentally Unhealthy Days: The number of “physically unhealthy days” or “mentally healthy days” is summed across all adults in the state and then divided by the number of adults in the state All Unhealthy Days: 1) The number of “physically unhealthy days” and “mentally unhealthy days” is summed to create an “all unhealthy days” total for each adult 2) The number of “all unhealthy days” is then summed across all adults in the state 3) It is then divided by the number of adults in the state.
  • 28.
    Limitations of the“all unhealthy days” measure 28 1) Overlap between the number of “physically unhealthy days” and “mentally unhealthy days” 2) The “all unhealthy days” measure is truncated at 30 days. Addressing the limitations • The CDC has found that the pattern of responses to the unhealthy days questions supports using the “all unhealthy days” measure. • SHADAC reports all three types of measures separately so that it is possible to highlight differences in physical health as well as mental health Source: Centers for Disease Control and Prevention. Measuring Healthy Days. Atlanta, Georgia: CDC, November 2000.
  • 29.
    Breakdowns available forthe unhealthy days measures on State Health Compare 29 • Household Income: <$15,000, $15,000 to $24,999, $25,000 to $49,999, $50,000+ • Age: 18 to 34, 35 to 54, 55 to 64, 18 to 64, 65+ • Coverage Type: uninsured and insured • Disability Status: with a disability and no disability • Education: <HS, HS graduate, some college and BA+ • Race/Ethnicity: Hispanic/Latino, White, Black and Other
  • 30.
    Variation Between Statesfor the Unhealthy Days Measures, BRFSS 2017 30
  • 31.
    Nationally: How muchgreater are the average number of unhealthy days among low income adults (<$15,000) as compared to higher income adults (>$50,000)? 31 2.9 2.5 4.9 7.4 8.1 12.1 1 2 3 Low Income Adults High Income Adults Physically Unhealthy Days Mentally Unhealthy Days All Unhealthy Days Low income adults have 3.2 times the average number of physically unhealthy days as high income adults
  • 32.
    State Level: Howmuch greater are the average number of unhealthy days for low income adults (<$15,000) compared to higher income adults (>$50,000)? 32 Low income adults in Idaho have 3.5 times the average number of unhealthy days as higher income adults
  • 33.
  • 34.
    Products that use StateHealth Compare Data
  • 36.
  • 37.
  • 38.
    Organizations Using StateHealth Compare As a Resource State Agencies Minnesota Department of Health, Office of Rural Health & Primary Care; New Jersey Department of Health, Center for Health Statistics and Informatics; New Mexico Human Services Department Federal Agencies National Academy of Medicine; NIH: National Institute on Minority Health and Health Disparities; NIH: Disaster Health Information – Opioids Foundations Milbank Memorial Fund Reforming States Group; Robert Wood Johnson Foundation’s State Network Resource Hub Research Organizations Altarum: Health Care Value Hub; Georgetown University Center for Children and Families; Mathematica Policy Research, Inc.; National Academy for State Health Policy (NASHP); Patient- Centered Outcomes Research Institute (PCORI); University of Arizona Center for Rural Health State Policy Groups Connecticut Health Policy Project; Council of State Governments; National Organization of State Offices of Rural Health Associations California Hospital Association; National Association of Health Data Organizations (NAHDO) Colleges & Universities Butler University; George Washington University; University of Illinois at Urbana-Champaign; University of Minnesota; University of South Carolina; Vanderbilt University 38
  • 39.
    Millbank Memorial Fund– State Health Profiles 39
  • 40.
    New Mexico HumanServices Department 40
  • 41.
  • 42.
  • 43.
    Question & Answer 43 RobertHest, MPP SHADAC Brett Fried, MS SHADAC Please submit question using the chat box or Tweet questions to @SHADAC.
  • 44.
    Visit StateHealthCompare.SHADAC.org ACCESS State-levelestimates related to the Culture of Health and heath care DOWNLOAD customized reports and select data as an excel file GENERATE detailed graphics, trend lines, maps, bar charts, and data tables. SUBSCRIBE to SHADAC’s e-newsletter to stay updated on the latest resources FOLLOW us on Twitter @shadac 44
  • 45.
    THANK YOU! Please senddirect inquires to: Robert Hest, hestx005@umn.edu, Brett Fried, bfried@umn.edu, or shadac@umn.edu statehealthcompare.shadac.org