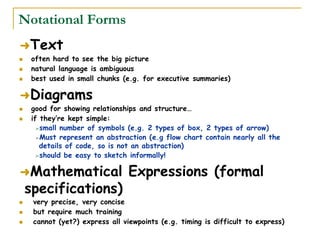
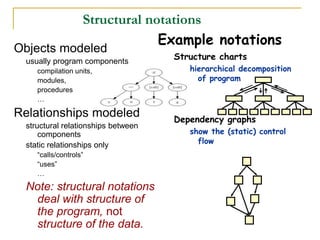
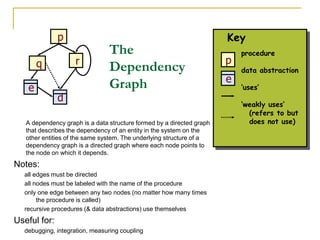
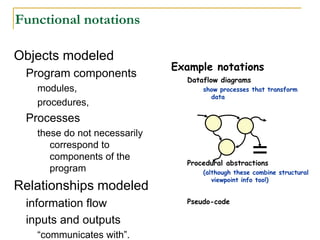
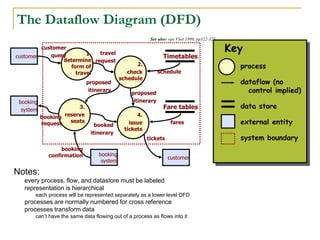
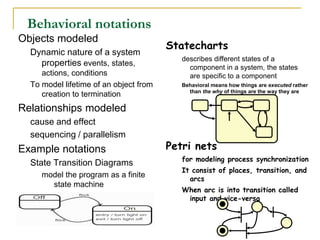
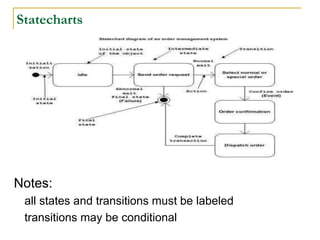
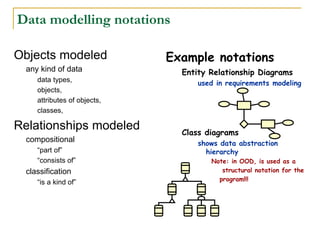
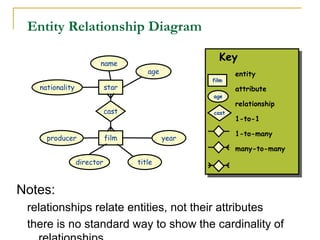
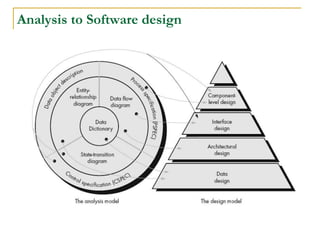
3. Software Design
A software design is a meaningful engineering representation of
some software product that is to be built.
The process of applying various techniques and principles for the purpose of defining a device,
a process or a system in sufficient detail to permit its physical realization” [TAY59]
A design can be traced to the customer's requirements and can
be assessed for quality against predefined criteria.
It lays down the groundwork for achieving non-functional
requirements (performance, maintainability, reusability, etc.)
It takes target technology into account (e.g., kind of middleware,
database design, etc.)
4. Questions to Answer…
What are the main functional elements of your
architecture?
How will these elements interact with one another and
with the outside world?
What information will be managed, stored, and
presented?
What physical hardware and software elements will be
required to support these functional and information
elements?
What operational features and capabilities will be
provided?
What development, test, support, and training
environments will be provided?
5. Possible Solutions
Try to answer all of these questions by means of a single,
heavily overloaded, all-encompassing model
Use a mixture of formal and informal notations to describe
a number of aspects of the system on one huge sheet of
paper
The functional structure, software layering, concurrency,
intercomponent communication, physical deployment environment,
and so on
This sort of AD is really the worst of all worlds?
Isn’t possible to describe a software architecture by using
a single model (Reported in many studies)
Hard to understand and is unlikely to clearly identify the
architecture’s most important features
Because of its complexity, a monolithic AD is often
incomplete, incorrect, or out-of-date?
6. Software Design …
Manageable and comprehensible by a range
of business and technical stakeholders
An approach is to attack the problem from
different directions simultaneously.
From abstractions to systems
abstractions allow us to ignore implementation
details of procedures and data structures
for large systems, we need to abstract away even
more detail
we need to represent higher level abstractions
7. Design Representations
Help us to see the big picture
allow us to communicate our designs with others
customers, managers, other developers,
people with varying technical expertise
These representations may not be correct/complete
allow us to measure various quality attributes
completeness, consistency, complexity
Help in documenting the design for future
reference
Must be complete and correct
8. Viewpoints/Representations
Viewpoints help in creating abstractions
A view is a representation of one or more structural aspects of an
architecture/design that illustrates how the architecture/design
addresses one or more concerns held by one or more of its
stakeholders.
A viewpoint is a collection of patterns, templates, and
conventions for constructing one type of view. It defines the
stakeholders whose concerns are reflected in the viewpoint and
the guidelines, principles, and template models for constructing
its views.
A viewpoint tells you which details you can ignore when
forming an abstraction
It defines which details are relevant and which are not
Viewpoints can overlap
Some aspects of a design are common to several viewpoints
9. Viewpoints/Representations..
Example: Building a house
Useful viewpoints:
The architect’s viewpoint (plan views, elevations,
etc)
The plumber’s viewpoint (routing diagrams for
pipework, fittings layouts, etc)
The electrician’s viewpoint (wiring diagrams, etc)
The buyer’s viewpoint (artist’s impression, floorplans,
etc)
10. Viewpoints
Context viewpoint: addresses overall relationships and dependencies
between the components of the project and the way the system interacts
with its environment
Functional viewpoint: describes the system’s runtime functional elements,
their responsibilities, interfaces, and interactions between them
Information viewpoint: is intended to address the ways data is collected,
stored, and managed to make the system work
Concurrency viewpoint: includes aspects of how concurrent units of the
program are handled and what parts specifically can execute concurrently
Development viewpoint: is made for use of technical staff, which build and
test this software. It includes design specifications of software and is used
as a guideline when preparing the product
Deployment viewpoint: describes where and how the system will be
deployed and includes technical details for dependencies and other
requirements
Operational viewpoint: handles the part that comes in a production
environment, which includes how the software will be operated,
administered, and supported
11. Software Design Representations/Viewpoints
Structural
Domain: Static properties (structure) of the software
Representation: Dependency graphs, structure charts, etc
Functional
Domain: Tasks performed by the software, information flow
Representation: Dataflow diagrams, procedure abstraction, etc.
Behavioural
Domain: Cause and effect within the program, system behaviour
Representation: state transition diagrams, statecharts, petri nets,
etc.
Data Modeling
Domain: Data objects and relationships between them
Representation: Entity relationship diagrams
12. Notational Forms
➜Text
often hard to see the big picture
natural language is ambiguous
best used in small chunks (e.g. for executive summaries)
➜Diagrams
good for showing relationships and structure…
if they’re kept simple:
➢small number of symbols (e.g. 2 types of box, 2 types of arrow)
➢Must represent an abstraction (e.g flow chart contain nearly all the
details of code, so is not an abstraction)
➢should be easy to sketch informally!
➜Mathematical Expressions (formal
specifications)
very precise, very concise
but require much training
cannot (yet?) express all viewpoints (e.g. timing is difficult to express)
13. Example notations
Structure charts
hierarchical decomposition
of program
Dependency graphs
show the (static) control
flow
Structural notations
Objects modeled
usually program components
compilation units,
modules,
procedures
…
Relationships modeled
structural relationships between
components
static relationships only
“calls/controls”
“uses”
…
Note: structural notations
deal with structure of
the program, not
structure of the data.
14. The
Dependency
Graph
A dependency graph is a data structure formed by a directed graph
that describes the dependency of an entity in the system on the
other entities of the same system. The underlying structure of a
dependency graph is a directed graph where each node points to
the node on which it depends.
Notes:
all edges must be directed
all nodes must be labeled with the name of the procedure
only one edge between any two nodes (no matter how many times
the procedure is called)
recursive procedures (& data abstractions) use themselves
Useful for:
debugging, integration, measuring coupling
p
q r
e
d
Key
procedure
data abstraction
‘uses’
‘weakly uses’
(refers to but
does not use)
p
e
15. Example notations
Dataflow diagrams
show processes that transform
data
Procedural abstractions
(although these combine structural
viewpoint info too!)
Pseudo-code
Functional notations
Objects modeled
Program components
modules,
procedures,
Processes
these do not necessarily
correspond to
components of the
program
Relationships modeled
information flow
inputs and outputs
“communicates with”.
16. The Dataflow Diagram (DFD)
Notes:
every process, flow, and datastore must be labeled
representation is hierarchical
each process will be represented separately as a lower level DFD
processes are normally numbered for cross reference
processes transform data
can’t have the same data flowing out of a process as flows into it
Key
process
dataflow (no
control implied)
data store
external entity
system boundary
1.
determine
form of
travel
2.
check
schedule
3.
reserve
seats
4.
issue
tickets
Timetables
Fare tables
customer
booking
system
booking
system
customer
travel
request
customer
query
schedule
proposed
itinerary
proposed
itinerary
booked
itinerary
fares
tickets
booking
confirmation
booking
request
See also: van Vliet 1999, pp322-325
17. Statecharts
describes different states of a
component in a system, the states
are specific to a component
Behavioral means how things are executed rather
than the why of things are the way they are
Petri nets
for modeling process synchronization
It consist of places, transition, and
arcs
When arc is into transition called
input and vice-versa
Behavioral notations
Objects modeled
Dynamic nature of a system
properties events, states,
actions, conditions
To model lifetime of an object from
creation to termination
Relationships modeled
cause and effect
sequencing / parallelism
Example notations
State Transition Diagrams
model the program as a finite
state machine
19. Data modelling notations
Objects modeled
any kind of data
data types,
objects,
attributes of objects,
classes,
Relationships modeled
compositional
“part of”
“consists of”
classification
“is a kind of”
Example notations
Entity Relationship Diagrams
used in requirements modeling
Class diagrams
shows data abstraction
hierarchy
Note: in OOD, is used as a
structural notation for the
program!!!
20. Entity Relationship Diagram
Notes:
relationships relate entities, not their attributes
there is no standard way to show the cardinality of
Key
entity
attribute
relationship
1-to-1
1-to-many
many-to-many
star
film
cast
producer
director title
year
name
age
nationality
cast
film
age
21. Software Design in SDLC
In SDLC (Software Development Life Cycle),
Design phase is one of the most important
phases.
In the software engineering context, design
focuses on four major areas of concern: data,
architecture, interfaces and
procedures/components.
22. Software Design in SDLC
In SDLC (Software Development Life Cycle),
Design phase is one of the most important
phases.
In the software engineering context, design
focuses on four major areas of concern: data,
architecture, interfaces and
procedures/components.
23. Design Process
During the design process, the software
specifications are transformed into design
models that describe the details of the data
structures, system architecture, interface, and
components.
The emphasis in design phase/process is on
quality.
This phase provides us with representation of
software that can be assessed for quality.
25. Design Process Activities
Architectural design
Interface design
Component design
Data structure design
Algorithm design
26. Levels of Software Design
Architectural design (high-level design)
architecture - the overall structure, main
modules and their connections
addresses the main non-functional
requirements (e.g., reliability, performance)
hard to change
Detailed design (low-level design)
the inner structure of the main modules
detailed enough to be implemented in the
programming language
27. Software Design should be:
Simple
Correct & Complete
Software design should be correct as per requirement.
The design should have all components like data structures, modules,
and external interfaces, etc.
Loosely coupled
Loose coupling is an approach to interconnecting the components in a system
or network so that those components, also called elements, depend on each
other to the least extent practicable
Understandable
Flexibility: Able to modify on changing needs.
Maintainable
The design should be so simple so that it can be easily maintainable
by other designers.
28. Software Design Methods
Structured Methods
Process functions are identified
Object-Oriented
develop an object model of a system
Data-Oriented
Entities are determined for each sub-system, then
entity inter-relationships are examined to develop the
additional entities needed to support the relationships.
Component-based
Divide the system into components
Formal Methods
Requirements and programs are translated into
mathematical notation
29. Which method to choose?
Data oriented design is useful for systems that process lots of
data, e.g. database and banking applications
Structured design is useful for process intensive systems that
will be programmed using a procedural language such as
FORTRAN.
OO methods are useful for any system that will be programmed
using an object oriented language such as C++.
Component-based Methods are used for the large systems that
can be modularized.
Formal methods are considered to be an alternative to OO and
classical design methods, but their use is expensive and claims
of reduced errors remain unproven. However, the ability to
formally validate the correctness of a software artifact is
appealing and research on formal methods is ongoing.
30. Software Design Strategies
Divide-and-conquer/stepwise refinement
Top-down vs. bottom-up
Data abstraction and information hiding
Use of heuristics
Use of patterns and pattern languages
Iterative and incremental approach
31. Reading for Next Week
Chapter 5 of “Software Engineering” 9th Ed,
by Sommerville
Rest of the reading material for Week 2 will
be available from
http://learn.mcs.edu.pk
Look for Software Design & Architecture course in
Fall 2012 category of MS Software Engineering
category.
Login as guest.
Editor's Notes
A capability is defined as a set of tasks that a system is potentially able to perform (acquired skills) at a certain performance level (available capacity). Often only with the use of external resources.
This sort of model (and we’ve all seen them) will probably use a mixture of formal and informal notations to describe a number of aspects of the system on one huge sheet of paper: the functional structure, software layering, concurrency, intercomponent communication, physical deployment environment, and so on.
Worst of all, because of its complexity, a monolithic AD is often incomplete, incorrect, or out-of-date.
https://www.viewpoints-and-perspectives.info/home/viewpoints/
When you start the daunting task of designing the architecture of your system, you will find that you have some difficult architectural questions to answer.
What are the main functional elements of your architecture?
How will these elements interact with one another and with the outside world?
What information will be managed, stored, and presented?
What physical hardware and software elements will be required to support these functional and information elements?
What operational features and capabilities will be provided?
What development, test, support, and training environments will be provided?
A common temptation – one you should strongly avoid – is to try to answer all of these questions by means of a single, heavily overloaded, all-encompassing model. This sort of model (and we’ve all seen them) will probably use a mixture of formal and informal notations to describe a number of aspects of the system on one huge sheet of paper: the functional structure, software layering, concurrency, intercomponent communication, physical deployment environment, and so on.
A dependency graph is a data structure formed by a directed graph that describes the dependency of an entity in the system on the other entities of the same system. https://alemba.help/help/content/topics/requests_and_templates/dependency_diagrams.htm#:~:text=A%20dependency%20diagram%20is%20a,before%20others%20can%20be%20released.
https://pediaa.com/what-is-the-difference-between-dfd-and-flowchart/
The main difference between DFD and Flowchart is that DFD is a graphical diagram that represents the data flow of a system while flowchart is a graphical diagram that represents the sequence of steps to solve a problem.
DFD can be used for complex systems. Although a flowchart is not very suitable for a complex system, it is applicable for small to medium programs.
DFDs help to understand the overview of the system without going into more details while flowcharts help to analyze, design and manage a program.
https://www.tutorialspoint.com/uml/uml_statechart_diagram.htm
A Statechart diagram describes a state machine. State machine can be defined as a machine which defines different states of an object and these states are controlled by external or internal events.