Download to read offline


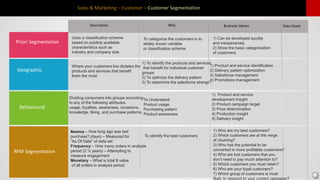

The document discusses various types of customer segmentation used in sales and marketing including: 1) Geographic segmentation which divides customers based on where they live to identify best products and optimize delivery. 2) Behavioral segmentation which divides customers based on attributes like usage, loyalty, awareness to gain insights for product development, targeting, pricing, and delivery. 3) RFM segmentation which analyzes customers based on Recency, Frequency, and Monetary value of purchases to identify best, at-risk, potential, and low-value customers to focus retention and campaign efforts.


![20260201 [FOSDEM] gomodjail - library sandboxing for Go modules.pdf](https://cdn.slidesharecdn.com/ss_thumbnails/20260201fosdemgomodjail-librarysandboxingforgomodules-260201225659-76609ec4-thumbnail.jpg?width=640&height=640&fit=bounds)

![谷歌留痕技术教程[ 𝙩𝙤𝙥 𝟮𝟯𝟯. 𝙘 𝙤𝙢 ]](https://cdn.slidesharecdn.com/ss_thumbnails/top233-260130173900-2eb784f9-thumbnail.jpg?width=640&height=640&fit=bounds)


