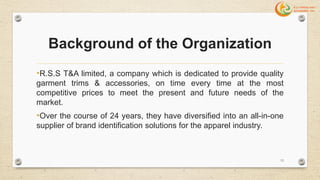
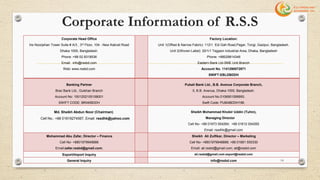
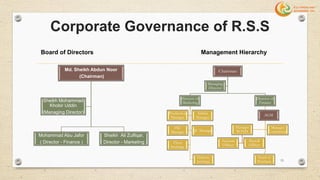
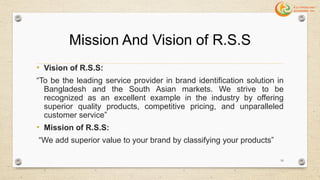
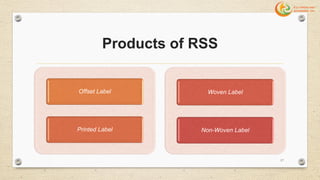
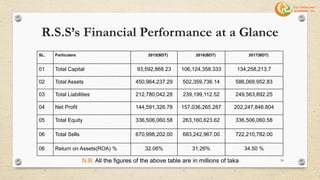
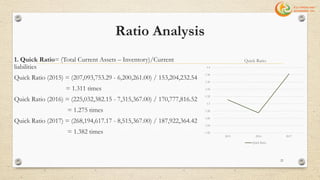
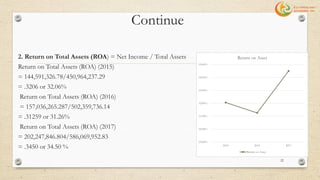
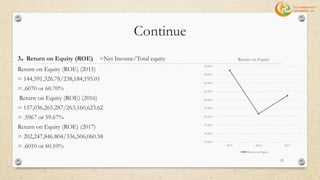
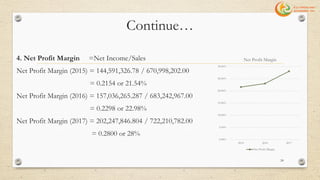
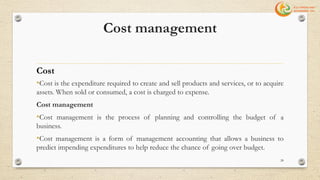
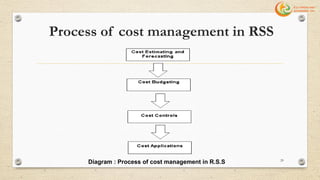
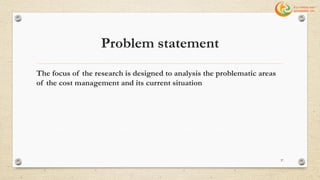
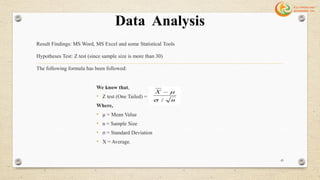
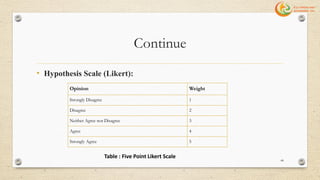
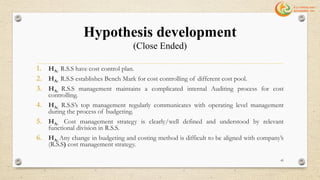
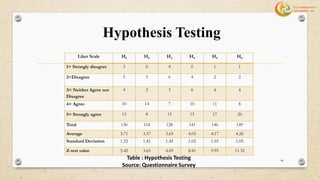
Welcome
1
Prepared by
Istiak Ahmed Abir
Id#14102322
Major: Finance and Banking
Program: BBA
International University of Business Agriculture and Technology
Dhaka,Bangladesh
2
Topic Name:
“An Analysis on Cost Management
of
R.S.S Thread and Accessories Limited”
3
Sequence of my presentation
Introductory
Part
Organization
Part
Topic Part
Actual Task
Part
Research Part
4
Concluding
Part
Introductory Part
5
Introduction
Cost management means a lot for a company. It represents how a
company maintain resources and control the expenditure in order to
create a product or produce a service, deliver it to the customer and
receive a sale. But these costs involve much more than simply the
price of raw materials or the monthly rent for store. So I develop a
report on “An Analysis on Cost Management of R.S.S Thread and
Accessories Limited”
6
Objectives
• Broad Objectives
The broad objective of this report is ensuring true and fair
presentation on “An analysis on Cost Management of RSS Thread
and Accessories Limited”
7
Continue…
Specific Objectives
• To present an overview of R.S.S Thread and Accessories Limited.
• To discuss about the cost management of R.S.S Thread and Accessories Limited.
• To identify the existence of cost plan in R.S.S Thread and Accessories Limited.
• To know if R.S.S Thread and Accessories Limited stablished benchmark or not.
• To justify if the internal auditing process R.S.S Thread and Accessories Limited is
complicated or not.
• To know if the top management of R.S.S Thread and Accessories Limited
communicate with operating level while budgeting or not.
• To identify if the functional division of R.S.S Thread and Accessories Limited
understand the cost management strategy or not.
• To identify cost management problem and to give some recommendation.
8
Scope of the report
The report and its analysis is based on the Cost Management of
R.S.S thread and accessories.
As an intern, overall I have mentioned about commercial and financial
activities of a company (R.S.S). Information included in this report,
will help the management to identify various scopes and limitations of
the Cost management.
9
Limitations of the Report
• R.S.S’s website was not that much rich to collect data largely.
• Unfortunately due to the company’s limitations (business secrecy
and confidentiality), unable to acquire sufficient information.
• Lack of previous experience in preparing such formal report.
• Load at the work place in R.S.S was also a barrier to prepare this
report.
• Non-availability of some preceding and latest data.
10
Ethical Consideration
To complete research with appropriate research guidelines research
ethics is very important. Considering ethical aspect of research, I
have given enough time to the top level and operating level workers
and managers (respondents) of R.S.S for my study so that they can
give fair view on my research questions. The information of the report
is being used only for the practicum purpose by the consent of the
related parties.
11
Organizational Part
12
Background of the Organization
•R.S.S T&A limited, a company which is dedicated to provide quality
garment trims & accessories, on time every time at the most
competitive prices to meet the present and future needs of the
market.
•Over the course of 24 years, they have diversified into an all-in-one
supplier of brand identification solutions for the apparel industry.
13
Corporate Information of R.S.S
Corporate Head Office
Iris Noorjehan Tower Suite # A/3 , 3rd Floor, 104 - New Kakrail Road
Dhaka 1000, Bangladesh.
Phone :+88 02 8318536
Email: info@rssbd.com
Web: www.rssbd.com
Factory Location:
Unit 1(Offset & Narrow Fabric): 1121 Eid Gah Road,Pagar, Tongi, Gazipur, Bangladesh.
Unit 2(Woven Label): 20/1/1 Tejgaon Industrial Area, Dhaka, Bangladesh
Phone: +88029814346
Eastern Bank Ltd-SME Unit Branch
Account No. 1141290072871
SWIFT:EBLDBDDH
Banking Partner
Brac Bank Ltd., Gulshan Branch
Account No: 1501202105158001
SWIFT CODE: BRAKBDDH
Pubali Bank Ltd., B.B. Avenue Corporate Branch,
5, B.B. Avenue, Dhaka-1000, Bangladesh.
Account No.0106901099950.
Swift Code: PUBABDDH196.
Md. Sheikh Abdun Noor (Chairman)
Cell No.: +88 01819274567, Email: rssdhk@yahoo.com
Sheikh Mohammad Khobir Uddin (Tuhin),
Managing Director
Cell No- +88 01973 004264; +88 01612 004265
Email: rssdhk@gmail.com
Mohammad Abu Zafar, Director – Finance
Cell No- +8801979948888
Email:zafar.rssbd@gmail.com;
Sheikh Ali Zulfikar, Director – Marketing
Cell No- +8801979948888; +88 01681 550330
Email: ali.rssbd@gmail.com; ali@rssbd.com
Export/Import Inquiry ali.rssbd@gmail.com export@rssbd.com
General Inquiry info@rssbd.com 14
Corporate Governance of R.S.S
Md. Sheikh Abdun Noor
(Chairman)
Mohammad Abu Jafor
( Director - Finance )
Sheikh Ali Zulfiqar,
( Director - Marketing )
Sheikh Mohammad
Khobir Uddin
(Managing Director)
Board of Directors
Chairman
Director of
Marketing
Delivery
Incharge
Production
Manager
Admin
Manager
FSC
Manager QC Manager
Floor
Incharge
Director of
Finance
Head of
Purchase
Manager
BOND
Account
Officer
Payroll
Officer
Manager
Commercial
Managing
Director
AGM
Management Hierarchy
15
Mission And Vision of R.S.S
• Vision of R.S.S:
“To be the leading service provider in brand identification solution in
Bangladesh and the South Asian markets. We strive to be
recognized as an excellent example in the industry by offering
superior quality products, competitive pricing, and unparalleled
customer service”
• Mission of R.S.S:
“We add superior value to your brand by classifying your products”
16
Products of RSS
Offset Label
Printed Label
Woven Label
Non-Woven Label
17
Continue with Products
Image 1: Paper Tag Image 2: Leather Label
Image 3: Synthetic Leather Label Image 4: Rubber Label
18
Continue with Products
Image 5: Printed Labels
Image 6: Weave and Knitted Fabrics
19
R.S.S’s Financial Performance at a Glance
SL. Particulars 2015(BDT) 2016(BDT) 2017(BDT)
01 Total Capital 93,592,868.23 106,124,358.333 134,258,213.7
02 Total Assets 450,964,237.29 502,359,736.14 586,069,952.83
03 Total Liabilities 212,780,042.28 239,199,112.52 249,563,892.25
04 Net Profit 144,591,326.78 157,036,265.287 202,247,846.804
05 Total Equity 336,506,060.58 263,160,623.62 336,506,060.58
06 Total Sells 670,998,202.00 683,242,967.00 722,210,782.00
06 Return on Assets(ROA) % 32.06% 31.26% 34.50 %
N.B: All the figures of the above table are in millions of taka 20
Ratio Analysis
1. Quick Ratio= (Total Current Assets – Inventory)/Current
liabilities
Quick Ratio (2015) = (207,093,753.29 - 6,200,261.00) / 153,204,232.54
= 1.311 times
Quick Ratio (2016) = (225,032,382.15 - 7,315,367.00) / 170,777,816.52
= 1.275 times
Quick Ratio (2017) = (268,194,617.17 - 8,515,367.00) / 187,922,364.42
= 1.382 times 1.22
1.24
1.26
1.28
1.3
1.32
1.34
1.36
1.38
1.4
2015 2016 2017
Quick Ratio
Quick Ratio
21
Continue
2. Return on Total Assets (ROA) = Net Income / Total Assets
Return on Total Assets (ROA) (2015)
= 144,591,326.78/450,964,237.29
= .3206 or 32.06%
Return on Total Assets (ROA) (2016)
= 157,036,265.287/502,359,736.14
= .31259 or 31.26%
Return on Total Assets (ROA) (2017)
= 202,247,846.804/586,069,952.83
= .3450 or 34.50 %
29.00%
30.00%
31.00%
32.00%
33.00%
34.00%
35.00%
2015 2016 2017
Return on Asset
Return on Asset
22
Continue
3. Return on Equity (ROE) =Net Income/Total equity
Return on Equity (ROE) (2015)
= 144,591,326.78/238,184,195.01
= .6070 or 60.70%
Return on Equity (ROE) (2016)
= 157,036,265.287/263,160,623.62
= .5967 or 59.67%
Return on Equity (ROE) (2017)
= 202,247,846.804/336,506,060.58
= .6010 or 60.10%
59.00%
59.20%
59.40%
59.60%
59.80%
60.00%
60.20%
60.40%
60.60%
60.80%
2015 2016 2017
Return on Equity
Return on Equity
23
Continue…
4. Net Profit Margin =Net Income/Sales
Net Profit Margin (2015) = 144,591,326.78 / 670,998,202.00
= 0.2154 or 21.54%
Net Profit Margin (2016) = 157,036,265.287 / 683,242,967.00
= 0.2298 or 22.98%
Net Profit Margin (2017) = 202,247,846.804 / 722,210,782.00
= 0.2800 or 28%
0.00%
5.00%
10.00%
15.00%
20.00%
25.00%
30.00%
2015 2016 2017
Net Profit Margin
Net Profit Margin
24
Continue…
5. Assets Turnover=Sales/Total assets
Assets Turnover (2015) = 670,998,202.00/450,964,237.29
=1.49 Times
Assets Turnover (2016) = 683,242,967.00/502,359,736.14
=1.36 Times
Assets Turnover (2017) = 722,210,782.00/ 586,069,952.83
=1.23 Times 0
0.2
0.4
0.6
0.8
1
1.2
1.4
1.6
Category 1 Category 2 Category 3
Total Assets Turnover
25
Continue…
6. Debt to Total Assets Ratio =Total debt (Non CL+CL)/Total
Assets
Debt to Total Assets Ratio (2015) = (59,575,809.45 + 153,204,232.54)
/ 450,964,237.29
= 0.4718 or 47.18 %
Debt to Total Assets Ratio (2016) = (68,421,296.82 + 170,777,816.52)
/ 502,359,736.14
= 0.4762 or 47.62 %
Debt to Total Assets Ratio (2017) = (61,641,527.83 + 187,922,364.42)
/ 586,069,952.83
= 0.4261 or 42.61 % 40.00%
41.00%
42.00%
43.00%
44.00%
45.00%
46.00%
47.00%
48.00%
2015 2016 2017
Debt to Total Assets
26
Topic part
27
Cost management
•Cost is the expenditure required to create and sell products and services, or to acquire
assets. When sold or consumed, a cost is charged to expense.
Cost management
•Cost management is the process of planning and controlling the budget of a
business.
•Cost management is a form of management accounting that allows a business to
predict impending expenditures to help reduce the chance of going over budget.
Cost
28
Process of cost management in RSS
Diagram : Process of cost management in R.S.S 29
Objective and key areas of cost
management in R.S.S
Objective of cost management in R.S.S
• To increase total sales.
• To increase profits.
• To meet increasing Competition
Cost management –the key areas R.S.S always consider
• Analyzing the Current Situation Using Financial Analysis.
• Maintain Different types of cost pool.
• Monitoring Actual cost and budgeted/normal cost.
30
Actual Task Part
31
Internship Experience
I joined in R.S.S Thread and Accessories Limited on 5th September 2017 to work for three months as an
intern (from 5th September, 2017 to 10th December, 2017). First day I reached there at 8.30’O clock and
reported to manager who introduced about the functioning of the office and all staff.
Most importantly, in R.S.S I was attached with the following two amazing people especially Abul Kalam
Azad (Sir); who had good command on this commercial and Finance department:
Image 7: Abul Kalam Azad (Manager-
Commercial & Finance Dept.) 32
Image 8: while working
Continue
Therefore in commercial department, I observed the following things by
working as an intern in R.S.S Thread and Accessories Ltd.
Indirect Learning
• Organizational Culture
• How to behave with colleagues
• How to behave with client
• How to behave with clients
in a challenging situation
• Time Management
Image 10: In front of organization
33Image 9: Md Muzahid-ul-Islam (tareq) (Sr.
Executive HR & Admin)
• I learned about R.S.S cost management.
• I learned about the BSCI Audit.
• I learned about the salary sheet making process.
• I learned about LC process used for import and export purpose in RSS.
• I worked to know SWIFT fields.
• I learned about the UCP, Incoterms.
• I worked with PI (Pro forma Invoice)
• I learned about the CI (Commercial Invoice)
• I learned about how to handle Amendment.
• I worked to know CHALAN making for Documentation.
• I worked to know some statement making like consumption sheet and checking TTI.
Continue
Direct Learning:
34
Continue
Other Jobs
Presentation on Offset Printing & Packaging
35
Research Part
36
Problem statement
The focus of the research is designed to analysis the problematic areas
of the cost management and its current situation
37
Project Timeline and Budget Information
Description of Activities Week -
1
Week-
2
Week -3 Week-
4
Develop the Research Plan
Developed the Hypothesis
Conduct Survey Research
Data Analysis and Interpretation
Name Taka
Transportation Cost (2) Monthly 900 (30tk * 30days) 1,800
Lunch (2) Monthly 2400 (80tk * 30days) 4,800
Printing (2 )Times (One for Study and Another for
Submission Purpose)
500
Others 200
Total 7,300
Gantt chart for Project Timeline Budget Information
38
Research Methodology
Data Sources
• Primary Data
• Secondary Data
Research Approach
• Research Approach : Quantitative (Statistical Test Base)
(I have used quantitative research approach because it is most commonly used by the students like me
where I have conducted my research by questionnaire survey, observation).
Research Philosophy
The research philosophy is very important part of research which refers to the belief about the way in
which data about the research should be gathered. This research is based on positivism philosophy.
39
Continue…
Type of Research:
• Type of research: Descriptive
Method of Data Collection
• Data Collection Method: Questionnaire Survey.
(It’s a set of question presented to the top level managers, employee and
operating level managers, workers of R.S.S for their responses besides it is best
suited for descriptive research).
40
Continue…
Population and Sampling Method
• Population: Population of my study is the existing and active Top level
managers, employee and operating level managers, workers, of R.S.S Thread
and Accessories Ltd. Total population is 160.
• Sampling Method: Probability Sampling (Simple Random Sampling). A
total of 35 Top level managers, employee and operating level managers,
workers, have been selected randomly.
41
Research Limitations
The main limitations of this research are:
• Time limitation.
• The data obtained in some cases may be biased.
• The information obtained from the top level managers, employees and
operating level managers, workers of R.S.S based on questionnaire survey
was assumed to be factual.
• Since the survey is based on probability sampling method, it does not
disclose the opinion of the entire top level managers, employee and
operating level managers, workers of R.S.S.
42
Data Analysis
Result Findings: MS Word, MS Excel and some Statistical Tools
Hypotheses Test: Z test (since sample size is more than 30)
The following formula has been followed:
We know that,
• Z test (One Tailed) =
Where,
• µ = Mean Value
• n = Sample Size
• σ = Standard Deviation
• X = Average.
43
Continue
• Hypothesis Scale (Likert):
Opinion Weight
Strongly Disagree 1
Disagree 2
Neither Agree nor Disagree 3
Agree 4
Strongly Agree 5
Table : Five Point Likert Scale
44
Hypothesis development
(Close Ended)
1. HA: R.S.S have cost control plan.
2. HA: R.S.S establishes Bench Mark for cost controlling of different cost pool.
3. HA: R.S.S management maintains a complicated internal Auditing process for cost
controlling.
4. HA: R.S.S’s top management regularly communicates with operating level management
during the process of budgeting.
5. HA: Cost management strategy is clearly/well defined and understood by relevant
functional division in R.S.S.
6. HA: Any change in budgeting and costing method is difficult to be aligned with company’s
(R.S.S) cost management strategy.
45
Hypothesis Testing
Liker Scale H1 H2 H3 H4 H5 H6
1= Strongly disagree 3 6 4 0 1 1
2=Disagree 5 5 6 4 2 2
3= Neither Agree nor
Disagree
4 2 3 6 4 4
4= Agree 10 14 7 10 11 8
5= Strongly agree 13 8 15 15 17 20
Total 130 118 128 141 146 149
Average 3.71 3.37 3.65 4.03 4.17 4.26
Standard Deviation 1.32 1.41 1.45 1.02 1.03 1.05
Z-test value 5.42 3.65 4.69 8.81 9.95 11.32
Table : Hypothesis Testing
Source: Questionnaire Survey
46
Hypothesis- 1
Ho: R.S.S does not have cost control plan.
HA: R.S.S have cost control plan.
HO: μ = 2.5
HA: μ > 2.5
n = 35
Here X = 3.71
σ = 1.32
Z Cal = (X – μ)/ (σ/√n) = 5.42
At 5% level of significance, follows Z distribution
Z 0.05 = 1.645
9%
14%
11%
29%
37%
Hypothesis:1
Strongly Disagree
Disgree
Neither Agree nor Disagree
Agree
Strongly Agree
Since Z Cal > Z Tab, the null hypothesis is rejected. So at 5% level of significance, it can be said that R.S.S have cost
control plan.
In 5 point scale the mean value is 2.5
Exploded 3D Pie Chart 1: Respondents view towards R.S.S have cost control
plan.
47
Hypothesis- 2
HO: R.S.S does not establish Bench Mark for cost controlling of different cost pool.
HA: R.S.S establishes Bench Mark for cost controlling of different cost pool.
HO: μ = 2.5
HA: μ > 2.5
n = 35
Here X = 3.37
σ = 1.41
Z Cal = (X – μ)/ (σ/√n) = 3.65
At 5% level of significance, follows Z distribution
Z 0.05 = 1.645
Since Z Cal > Z Tab, the null hypothesis is not acceptable. So at 5% level of significance, it can be said that R.S.S establishes Bench
Mark for cost controlling of different cost pool.
In 5 point scale the mean value is 2.5
17%
14%
6%
40%
23%
Hypothesis: 2
Strongly Disagree
Disgree
Neither Agree nor Disagree
Agree
Strongly Agree
Exploded 3D Pie Chart 2: Respondents view towards R.S.S establishes Bench
Mark for cost controlling of different cost pool
48
Hypothesis- 3
Ho: R.S.S management does not maintain a complicated internal Auditing process for cost
controlling.
HA: R.S.S management maintains a complicated internal Auditing process for cost controlling.
HO: μ = 2.5
HA: μ > 2.5
n = 35
Here X = 3.65
σ = 1.45
Z Cal = (X – μ)/ (σ/√n) = 4.69
At 5% level of significance, follows Z distribution
Z 0.05 = 1.645
Since Z Cal > Z Tab, the null hypothesis is rejected. So at 5% level of significance, it can be said that R.S.S
management maintains a complicated internal Auditing process for cost controlling.
In 5 point scale the mean value is 2.5
11%
17%
9%
20%
43%
Hypothesis: 3
Strongly Disagree
Disgree
Neither Agree nor Disagree
Agree
Strongly Agree
Exploded 3D Pie Chart 3: Respondents view towards R.S.S management
maintains a complicated internal Auditing process for cost controlling.
49
Hypothesis- 4
Ho: R.S.S’s top management does not regularly communicate with operating level management during the
process of budgeting.
HA: R.S.S’s top management regularly communicates with operating level management during the process
of budgeting.
HO: μ = 2.5
HA: μ > 2.5
n = 35
Here X = 4.03
σ = 1.02
Z Cal = (X – μ)/ (σ/√n) = 8.81
At 5% level of significance, follows Z distribution
Z 0.05 = 1.645
Since Z Cal > Z Tab, the null hypothesis is not acceptable. So at 5% level of significance, it can be said that
R.S.S’s top management regularly communicates with operating level management during the process of
budgeting.
In 5 point scale the mean value is 2.5
0%
11%
17%
29%
43%
Hypothesis: 4
Strongly Disagree
Disgree
Neither Agree nor Disagree
Agree
Strongly Agree
Exploded 3D Pie Chart 4: Respondents view towards R.S.S’s top management
regularly communicates with operating level management during the process of
budgeting.
50
Hypothesis- 5
Ho: Cost management strategy is not clearly/well defined and understood by relevant functional division in
R.S.S.
HA: Cost management strategy is clearly/well defined and understood by relevant functional division in
R.S.S
HO: μ = 2.5
HA: μ > 2.5
n = 35
Here X = 4.17
σ = 1.03
Z Cal = (X – μ)/ (σ/√n) = 9.59
At 5% level of significance, follows Z distribution
Z 0.05 = 1.645
Since Z Cal > Z Tab, the null hypothesis is rejected. So at 5% level of significance, it can be said that Cost
management strategy is clearly/well defined and understood by relevant functional division R.S.S.
In 5 point scale the mean value is 2.5
3% 6%
11%
31%
49%
Hypothesis: 5
Strongly Disagree
Disgree
Neither Agree nor Disagree
Agree
Strongly Agree
Exploded 3D Pie Chart 5: Respondents view towards Cost management strategy
is clearly/well defined and understood by relevant functional division in R.S.S
51
Hypothesis- 6
Ho: Any change in budgeting and costing method is not difficult to be aligned with company’s (R.S.S) cost
management strategy.
HA: Any change in budgeting and costing method is difficult to be aligned with company’s (R.S.S) cost
management strategy.
HO: μ = 2.5
HA: μ > 2.5
n = 35
Here X = 4.26
σ = 1.05
Z Cal = (X – μ)/ (σ/√n) = 11.32
At 5% level of significance, follows Z distribution
Z 0.05 = 1.645
Since Z Cal > Z Tab, the null hypothesis is not acceptable. So at 5% level of significance, it can be said that any
change in budgeting and costing method is difficult to be aligned with company’s (R.S.S) cost management
strategy.
In 5 point scale the mean value is 2.5
3%
6%
11%
23%57%
Hypothesis: 6
Strongly Disagree
Disgree
Neither Agree nor Disagree
Agree
Strongly Agree
Exploded 3D Pie Chart 6: Respondents view towards any change in budgeting
and costing method is difficult to be aligned with company’s (R.S.S) cost
management strategy.
52
Findings
• R.S.S have cost control plan. In this hypothesis 37% of respondent are strongly agreed, 29%
are agreed, 11% respondents are neither agreed nor disagreed and 14% respondents are disagreed
and 9% respondents are strongly disagreed.(Hypothesis no.01)
• R.S.S stablishes Bench Mark for cost controlling of different cost pool. In this
hypothesis 23% of respondent are strongly agreed, 40% are agreed, 6% respondents are neither
agreed nor disagreed and 14% respondents are disagreed and 17% respondents are strongly
disagreed. (Hypothesis no.02)
• R.S.S’s management maintains a complicated internal Auditing process for cost
controlling. In this hypothesis 43% of respondent are strongly agreed, 20% are agreed, 9%
respondents are neither agreed nor disagreed and 17% respondents are disagreed and 11%
respondents are strongly disagreed.(Hypothesis no.03)
53
Continue…
• R.S.S’s top management regularly communicates with operating level management
during the process of budgeting. In this hypothesis 43% of respondent are strongly agreed,
29% are agreed, 17% respondents are neither agreed nor disagreed and 11% respondents are
disagreed and 0% respondents are strongly disagreed.( Hypothesis no.04)
• Cost management strategy is clearly/well defined and understood by relevant
functional division in R.S.S.In this hypothesis 49% of respondent are strongly agreed, 31%
are agreed, 11% respondents are neither agreed nor disagreed and 6% respondents are disagreed
and 3% respondents are strongly disagreed.( Hypothesis no.05)
• Any change in budgeting and costing method is difficult to be aligned with
company’s (R.S.S) cost management strategy. In this hypothesis 57% of respondent are
strongly agreed, 23% are agreed, 11% respondents are neither agreed nor disagreed and 6%
respondents are disagreed and 3% respondents are strongly disagreed.( Hypothesis no.06)
54
Recommendation
• It is good for the company that cost control plan is existing. But they should consider a
regular update of cost control plan.
• R.S.S should keep in mind that bench mark can be changed based on time and situation.
So it has to be revised every year and update accordingly.
• In here almost 63% respondents are agreed to their complicated internal auditing system.
R.S.S should make a digital inventory tracking system to make easier auditing and can
resolve this issue.
55
Continue…
• As the operating level management influence the budget through the top
management, so operation level management should train regarding the operation
management and strategies.
• R.S.S uses a simple cost management so it is easier for them to make everyone
understand about it. They should use simple strategy in future too and an updated
cost management training should be arranged for the functional division.
• R.S.S mainly follows international business, and in here cost is fixed from the very
beginning. Sometimes they need to change some issues for client requirement. So
they should develop a contingency cost plan to fulfill the sudden client need.
56
Question answer session
57
Concluding Part
58
Conclusion
R.S.S Thread and Accessories Limited established to become a leading company in
Bangladesh. It is a new generation organization with latest machinery. It is committed to
provide high quality products to contribute to the growth of GDP of the industrialization,
boosting up export, creating employment opportunity for the educated youth, rising standard
of living of limited income group and overall sustainable socio-economic development of
Bangladesh. Though R.S.S is a very good company but In my internship period, I have found
some problem to cost management in R.S.S and I have done the research and I have given
some recommendations to recover few problems.
59
References (Format: Harvard Referencing)
• R.S.S Thread & Accessories Ltd., about, http://www.rssbd.com/, Retrieved October 18th, 2017.
• Brigham Eugene F & Houston Joel F, (2004), Fundamental of financial management, 10th edition,Thomson learning.
• Horngren Charles T & others, (2009), Cost accounting-A managerial emphasis, 13th edition,Pearson education inc.
• Ivancevich, John M., and Steven J. Skinner, (2003), “Business for the 21st Century”, 12th edition, Richard D. Irwin.
• Zikmund, G. William, (2010), Business Research Methods, 8th edition, Cengage Learning, Chicago: Dryden Press.
• Gupta.D.S.P., Gupta.D.M.P,(2008),”Business Statistics”,8th edition, Educational publishers New Delhi.
• Kieso Donald E & others, (2009), Accounting Principles, 9th edition, George Hoffman.
• Madhura Jeff, (2010), International financial management, 11th edition, Cengage Learning.
• Investopidia,cost, https://strategiccfo.com/job-costing/, Retrieved November 25th 2017.
• Business dictionary, http://www.businessdictionary.com/definition/benchmark.html, benchmark, Retrieved November 25th
2017
60
Appendix A:
Abbreviations
• SWIFT – Society for Worldwide Interbank Financial Telecommunication.
• BSCI- Business Social Compliance Initiative
• PI – Pro forma Invoice
• CI - Commercial Invoice
• COC - Chain-of-Custody
• PO- Pro forma Order
• L/C- Letter of Credit
• TTI- Total Tax Incidence
• ROA- Return on Asset
• ROE- Return on Equity
61
Thank You
62

Practicum Defense (presentation) IUBAT.(RSS Thread & Accessories Ltd)

  • 1.
  • 2.
    Prepared by Istiak AhmedAbir Id#14102322 Major: Finance and Banking Program: BBA International University of Business Agriculture and Technology Dhaka,Bangladesh 2
  • 3.
    Topic Name: “An Analysison Cost Management of R.S.S Thread and Accessories Limited” 3
  • 4.
    Sequence of mypresentation Introductory Part Organization Part Topic Part Actual Task Part Research Part 4 Concluding Part
  • 5.
  • 6.
    Introduction Cost management meansa lot for a company. It represents how a company maintain resources and control the expenditure in order to create a product or produce a service, deliver it to the customer and receive a sale. But these costs involve much more than simply the price of raw materials or the monthly rent for store. So I develop a report on “An Analysis on Cost Management of R.S.S Thread and Accessories Limited” 6
  • 7.
    Objectives • Broad Objectives Thebroad objective of this report is ensuring true and fair presentation on “An analysis on Cost Management of RSS Thread and Accessories Limited” 7
  • 8.
    Continue… Specific Objectives • Topresent an overview of R.S.S Thread and Accessories Limited. • To discuss about the cost management of R.S.S Thread and Accessories Limited. • To identify the existence of cost plan in R.S.S Thread and Accessories Limited. • To know if R.S.S Thread and Accessories Limited stablished benchmark or not. • To justify if the internal auditing process R.S.S Thread and Accessories Limited is complicated or not. • To know if the top management of R.S.S Thread and Accessories Limited communicate with operating level while budgeting or not. • To identify if the functional division of R.S.S Thread and Accessories Limited understand the cost management strategy or not. • To identify cost management problem and to give some recommendation. 8
  • 9.
    Scope of thereport The report and its analysis is based on the Cost Management of R.S.S thread and accessories. As an intern, overall I have mentioned about commercial and financial activities of a company (R.S.S). Information included in this report, will help the management to identify various scopes and limitations of the Cost management. 9
  • 10.
    Limitations of theReport • R.S.S’s website was not that much rich to collect data largely. • Unfortunately due to the company’s limitations (business secrecy and confidentiality), unable to acquire sufficient information. • Lack of previous experience in preparing such formal report. • Load at the work place in R.S.S was also a barrier to prepare this report. • Non-availability of some preceding and latest data. 10
  • 11.
    Ethical Consideration To completeresearch with appropriate research guidelines research ethics is very important. Considering ethical aspect of research, I have given enough time to the top level and operating level workers and managers (respondents) of R.S.S for my study so that they can give fair view on my research questions. The information of the report is being used only for the practicum purpose by the consent of the related parties. 11
  • 12.
  • 13.
    Background of theOrganization •R.S.S T&A limited, a company which is dedicated to provide quality garment trims & accessories, on time every time at the most competitive prices to meet the present and future needs of the market. •Over the course of 24 years, they have diversified into an all-in-one supplier of brand identification solutions for the apparel industry. 13
  • 14.
    Corporate Information ofR.S.S Corporate Head Office Iris Noorjehan Tower Suite # A/3 , 3rd Floor, 104 - New Kakrail Road Dhaka 1000, Bangladesh. Phone :+88 02 8318536 Email: info@rssbd.com Web: www.rssbd.com Factory Location: Unit 1(Offset & Narrow Fabric): 1121 Eid Gah Road,Pagar, Tongi, Gazipur, Bangladesh. Unit 2(Woven Label): 20/1/1 Tejgaon Industrial Area, Dhaka, Bangladesh Phone: +88029814346 Eastern Bank Ltd-SME Unit Branch Account No. 1141290072871 SWIFT:EBLDBDDH Banking Partner Brac Bank Ltd., Gulshan Branch Account No: 1501202105158001 SWIFT CODE: BRAKBDDH Pubali Bank Ltd., B.B. Avenue Corporate Branch, 5, B.B. Avenue, Dhaka-1000, Bangladesh. Account No.0106901099950. Swift Code: PUBABDDH196. Md. Sheikh Abdun Noor (Chairman) Cell No.: +88 01819274567, Email: rssdhk@yahoo.com Sheikh Mohammad Khobir Uddin (Tuhin), Managing Director Cell No- +88 01973 004264; +88 01612 004265 Email: rssdhk@gmail.com Mohammad Abu Zafar, Director – Finance Cell No- +8801979948888 Email:zafar.rssbd@gmail.com; Sheikh Ali Zulfikar, Director – Marketing Cell No- +8801979948888; +88 01681 550330 Email: ali.rssbd@gmail.com; ali@rssbd.com Export/Import Inquiry ali.rssbd@gmail.com export@rssbd.com General Inquiry info@rssbd.com 14
  • 15.
    Corporate Governance ofR.S.S Md. Sheikh Abdun Noor (Chairman) Mohammad Abu Jafor ( Director - Finance ) Sheikh Ali Zulfiqar, ( Director - Marketing ) Sheikh Mohammad Khobir Uddin (Managing Director) Board of Directors Chairman Director of Marketing Delivery Incharge Production Manager Admin Manager FSC Manager QC Manager Floor Incharge Director of Finance Head of Purchase Manager BOND Account Officer Payroll Officer Manager Commercial Managing Director AGM Management Hierarchy 15
  • 16.
    Mission And Visionof R.S.S • Vision of R.S.S: “To be the leading service provider in brand identification solution in Bangladesh and the South Asian markets. We strive to be recognized as an excellent example in the industry by offering superior quality products, competitive pricing, and unparalleled customer service” • Mission of R.S.S: “We add superior value to your brand by classifying your products” 16
  • 17.
    Products of RSS OffsetLabel Printed Label Woven Label Non-Woven Label 17
  • 18.
    Continue with Products Image1: Paper Tag Image 2: Leather Label Image 3: Synthetic Leather Label Image 4: Rubber Label 18
  • 19.
    Continue with Products Image5: Printed Labels Image 6: Weave and Knitted Fabrics 19
  • 20.
    R.S.S’s Financial Performanceat a Glance SL. Particulars 2015(BDT) 2016(BDT) 2017(BDT) 01 Total Capital 93,592,868.23 106,124,358.333 134,258,213.7 02 Total Assets 450,964,237.29 502,359,736.14 586,069,952.83 03 Total Liabilities 212,780,042.28 239,199,112.52 249,563,892.25 04 Net Profit 144,591,326.78 157,036,265.287 202,247,846.804 05 Total Equity 336,506,060.58 263,160,623.62 336,506,060.58 06 Total Sells 670,998,202.00 683,242,967.00 722,210,782.00 06 Return on Assets(ROA) % 32.06% 31.26% 34.50 % N.B: All the figures of the above table are in millions of taka 20
  • 21.
    Ratio Analysis 1. QuickRatio= (Total Current Assets – Inventory)/Current liabilities Quick Ratio (2015) = (207,093,753.29 - 6,200,261.00) / 153,204,232.54 = 1.311 times Quick Ratio (2016) = (225,032,382.15 - 7,315,367.00) / 170,777,816.52 = 1.275 times Quick Ratio (2017) = (268,194,617.17 - 8,515,367.00) / 187,922,364.42 = 1.382 times 1.22 1.24 1.26 1.28 1.3 1.32 1.34 1.36 1.38 1.4 2015 2016 2017 Quick Ratio Quick Ratio 21
  • 22.
    Continue 2. Return onTotal Assets (ROA) = Net Income / Total Assets Return on Total Assets (ROA) (2015) = 144,591,326.78/450,964,237.29 = .3206 or 32.06% Return on Total Assets (ROA) (2016) = 157,036,265.287/502,359,736.14 = .31259 or 31.26% Return on Total Assets (ROA) (2017) = 202,247,846.804/586,069,952.83 = .3450 or 34.50 % 29.00% 30.00% 31.00% 32.00% 33.00% 34.00% 35.00% 2015 2016 2017 Return on Asset Return on Asset 22
  • 23.
    Continue 3. Return onEquity (ROE) =Net Income/Total equity Return on Equity (ROE) (2015) = 144,591,326.78/238,184,195.01 = .6070 or 60.70% Return on Equity (ROE) (2016) = 157,036,265.287/263,160,623.62 = .5967 or 59.67% Return on Equity (ROE) (2017) = 202,247,846.804/336,506,060.58 = .6010 or 60.10% 59.00% 59.20% 59.40% 59.60% 59.80% 60.00% 60.20% 60.40% 60.60% 60.80% 2015 2016 2017 Return on Equity Return on Equity 23
  • 24.
    Continue… 4. Net ProfitMargin =Net Income/Sales Net Profit Margin (2015) = 144,591,326.78 / 670,998,202.00 = 0.2154 or 21.54% Net Profit Margin (2016) = 157,036,265.287 / 683,242,967.00 = 0.2298 or 22.98% Net Profit Margin (2017) = 202,247,846.804 / 722,210,782.00 = 0.2800 or 28% 0.00% 5.00% 10.00% 15.00% 20.00% 25.00% 30.00% 2015 2016 2017 Net Profit Margin Net Profit Margin 24
  • 25.
    Continue… 5. Assets Turnover=Sales/Totalassets Assets Turnover (2015) = 670,998,202.00/450,964,237.29 =1.49 Times Assets Turnover (2016) = 683,242,967.00/502,359,736.14 =1.36 Times Assets Turnover (2017) = 722,210,782.00/ 586,069,952.83 =1.23 Times 0 0.2 0.4 0.6 0.8 1 1.2 1.4 1.6 Category 1 Category 2 Category 3 Total Assets Turnover Total Assets Turnover 25
  • 26.
    Continue… 6. Debt toTotal Assets Ratio =Total debt (Non CL+CL)/Total Assets Debt to Total Assets Ratio (2015) = (59,575,809.45 + 153,204,232.54) / 450,964,237.29 = 0.4718 or 47.18 % Debt to Total Assets Ratio (2016) = (68,421,296.82 + 170,777,816.52) / 502,359,736.14 = 0.4762 or 47.62 % Debt to Total Assets Ratio (2017) = (61,641,527.83 + 187,922,364.42) / 586,069,952.83 = 0.4261 or 42.61 % 40.00% 41.00% 42.00% 43.00% 44.00% 45.00% 46.00% 47.00% 48.00% 2015 2016 2017 Debt to Total Assets Debt to Total Assets 26
  • 27.
  • 28.
    Cost management •Cost isthe expenditure required to create and sell products and services, or to acquire assets. When sold or consumed, a cost is charged to expense. Cost management •Cost management is the process of planning and controlling the budget of a business. •Cost management is a form of management accounting that allows a business to predict impending expenditures to help reduce the chance of going over budget. Cost 28
  • 29.
    Process of costmanagement in RSS Diagram : Process of cost management in R.S.S 29
  • 30.
    Objective and keyareas of cost management in R.S.S Objective of cost management in R.S.S • To increase total sales. • To increase profits. • To meet increasing Competition Cost management –the key areas R.S.S always consider • Analyzing the Current Situation Using Financial Analysis. • Maintain Different types of cost pool. • Monitoring Actual cost and budgeted/normal cost. 30
  • 31.
  • 32.
    Internship Experience I joinedin R.S.S Thread and Accessories Limited on 5th September 2017 to work for three months as an intern (from 5th September, 2017 to 10th December, 2017). First day I reached there at 8.30’O clock and reported to manager who introduced about the functioning of the office and all staff. Most importantly, in R.S.S I was attached with the following two amazing people especially Abul Kalam Azad (Sir); who had good command on this commercial and Finance department: Image 7: Abul Kalam Azad (Manager- Commercial & Finance Dept.) 32 Image 8: while working
  • 33.
    Continue Therefore in commercialdepartment, I observed the following things by working as an intern in R.S.S Thread and Accessories Ltd. Indirect Learning • Organizational Culture • How to behave with colleagues • How to behave with client • How to behave with clients in a challenging situation • Time Management Image 10: In front of organization 33Image 9: Md Muzahid-ul-Islam (tareq) (Sr. Executive HR & Admin)
  • 34.
    • I learnedabout R.S.S cost management. • I learned about the BSCI Audit. • I learned about the salary sheet making process. • I learned about LC process used for import and export purpose in RSS. • I worked to know SWIFT fields. • I learned about the UCP, Incoterms. • I worked with PI (Pro forma Invoice) • I learned about the CI (Commercial Invoice) • I learned about how to handle Amendment. • I worked to know CHALAN making for Documentation. • I worked to know some statement making like consumption sheet and checking TTI. Continue Direct Learning: 34
  • 35.
    Continue Other Jobs Presentation onOffset Printing & Packaging 35
  • 36.
  • 37.
    Problem statement The focusof the research is designed to analysis the problematic areas of the cost management and its current situation 37
  • 38.
    Project Timeline andBudget Information Description of Activities Week - 1 Week- 2 Week -3 Week- 4 Develop the Research Plan Developed the Hypothesis Conduct Survey Research Data Analysis and Interpretation Name Taka Transportation Cost (2) Monthly 900 (30tk * 30days) 1,800 Lunch (2) Monthly 2400 (80tk * 30days) 4,800 Printing (2 )Times (One for Study and Another for Submission Purpose) 500 Others 200 Total 7,300 Gantt chart for Project Timeline Budget Information 38
  • 39.
    Research Methodology Data Sources •Primary Data • Secondary Data Research Approach • Research Approach : Quantitative (Statistical Test Base) (I have used quantitative research approach because it is most commonly used by the students like me where I have conducted my research by questionnaire survey, observation). Research Philosophy The research philosophy is very important part of research which refers to the belief about the way in which data about the research should be gathered. This research is based on positivism philosophy. 39
  • 40.
    Continue… Type of Research: •Type of research: Descriptive Method of Data Collection • Data Collection Method: Questionnaire Survey. (It’s a set of question presented to the top level managers, employee and operating level managers, workers of R.S.S for their responses besides it is best suited for descriptive research). 40
  • 41.
    Continue… Population and SamplingMethod • Population: Population of my study is the existing and active Top level managers, employee and operating level managers, workers, of R.S.S Thread and Accessories Ltd. Total population is 160. • Sampling Method: Probability Sampling (Simple Random Sampling). A total of 35 Top level managers, employee and operating level managers, workers, have been selected randomly. 41
  • 42.
    Research Limitations The mainlimitations of this research are: • Time limitation. • The data obtained in some cases may be biased. • The information obtained from the top level managers, employees and operating level managers, workers of R.S.S based on questionnaire survey was assumed to be factual. • Since the survey is based on probability sampling method, it does not disclose the opinion of the entire top level managers, employee and operating level managers, workers of R.S.S. 42
  • 43.
    Data Analysis Result Findings:MS Word, MS Excel and some Statistical Tools Hypotheses Test: Z test (since sample size is more than 30) The following formula has been followed: We know that, • Z test (One Tailed) = Where, • µ = Mean Value • n = Sample Size • σ = Standard Deviation • X = Average. 43
  • 44.
    Continue • Hypothesis Scale(Likert): Opinion Weight Strongly Disagree 1 Disagree 2 Neither Agree nor Disagree 3 Agree 4 Strongly Agree 5 Table : Five Point Likert Scale 44
  • 45.
    Hypothesis development (Close Ended) 1.HA: R.S.S have cost control plan. 2. HA: R.S.S establishes Bench Mark for cost controlling of different cost pool. 3. HA: R.S.S management maintains a complicated internal Auditing process for cost controlling. 4. HA: R.S.S’s top management regularly communicates with operating level management during the process of budgeting. 5. HA: Cost management strategy is clearly/well defined and understood by relevant functional division in R.S.S. 6. HA: Any change in budgeting and costing method is difficult to be aligned with company’s (R.S.S) cost management strategy. 45
  • 46.
    Hypothesis Testing Liker ScaleH1 H2 H3 H4 H5 H6 1= Strongly disagree 3 6 4 0 1 1 2=Disagree 5 5 6 4 2 2 3= Neither Agree nor Disagree 4 2 3 6 4 4 4= Agree 10 14 7 10 11 8 5= Strongly agree 13 8 15 15 17 20 Total 130 118 128 141 146 149 Average 3.71 3.37 3.65 4.03 4.17 4.26 Standard Deviation 1.32 1.41 1.45 1.02 1.03 1.05 Z-test value 5.42 3.65 4.69 8.81 9.95 11.32 Table : Hypothesis Testing Source: Questionnaire Survey 46
  • 47.
    Hypothesis- 1 Ho: R.S.Sdoes not have cost control plan. HA: R.S.S have cost control plan. HO: μ = 2.5 HA: μ > 2.5 n = 35 Here X = 3.71 σ = 1.32 Z Cal = (X – μ)/ (σ/√n) = 5.42 At 5% level of significance, follows Z distribution Z 0.05 = 1.645 9% 14% 11% 29% 37% Hypothesis:1 Strongly Disagree Disgree Neither Agree nor Disagree Agree Strongly Agree Since Z Cal > Z Tab, the null hypothesis is rejected. So at 5% level of significance, it can be said that R.S.S have cost control plan. In 5 point scale the mean value is 2.5 Exploded 3D Pie Chart 1: Respondents view towards R.S.S have cost control plan. 47
  • 48.
    Hypothesis- 2 HO: R.S.Sdoes not establish Bench Mark for cost controlling of different cost pool. HA: R.S.S establishes Bench Mark for cost controlling of different cost pool. HO: μ = 2.5 HA: μ > 2.5 n = 35 Here X = 3.37 σ = 1.41 Z Cal = (X – μ)/ (σ/√n) = 3.65 At 5% level of significance, follows Z distribution Z 0.05 = 1.645 Since Z Cal > Z Tab, the null hypothesis is not acceptable. So at 5% level of significance, it can be said that R.S.S establishes Bench Mark for cost controlling of different cost pool. In 5 point scale the mean value is 2.5 17% 14% 6% 40% 23% Hypothesis: 2 Strongly Disagree Disgree Neither Agree nor Disagree Agree Strongly Agree Exploded 3D Pie Chart 2: Respondents view towards R.S.S establishes Bench Mark for cost controlling of different cost pool 48
  • 49.
    Hypothesis- 3 Ho: R.S.Smanagement does not maintain a complicated internal Auditing process for cost controlling. HA: R.S.S management maintains a complicated internal Auditing process for cost controlling. HO: μ = 2.5 HA: μ > 2.5 n = 35 Here X = 3.65 σ = 1.45 Z Cal = (X – μ)/ (σ/√n) = 4.69 At 5% level of significance, follows Z distribution Z 0.05 = 1.645 Since Z Cal > Z Tab, the null hypothesis is rejected. So at 5% level of significance, it can be said that R.S.S management maintains a complicated internal Auditing process for cost controlling. In 5 point scale the mean value is 2.5 11% 17% 9% 20% 43% Hypothesis: 3 Strongly Disagree Disgree Neither Agree nor Disagree Agree Strongly Agree Exploded 3D Pie Chart 3: Respondents view towards R.S.S management maintains a complicated internal Auditing process for cost controlling. 49
  • 50.
    Hypothesis- 4 Ho: R.S.S’stop management does not regularly communicate with operating level management during the process of budgeting. HA: R.S.S’s top management regularly communicates with operating level management during the process of budgeting. HO: μ = 2.5 HA: μ > 2.5 n = 35 Here X = 4.03 σ = 1.02 Z Cal = (X – μ)/ (σ/√n) = 8.81 At 5% level of significance, follows Z distribution Z 0.05 = 1.645 Since Z Cal > Z Tab, the null hypothesis is not acceptable. So at 5% level of significance, it can be said that R.S.S’s top management regularly communicates with operating level management during the process of budgeting. In 5 point scale the mean value is 2.5 0% 11% 17% 29% 43% Hypothesis: 4 Strongly Disagree Disgree Neither Agree nor Disagree Agree Strongly Agree Exploded 3D Pie Chart 4: Respondents view towards R.S.S’s top management regularly communicates with operating level management during the process of budgeting. 50
  • 51.
    Hypothesis- 5 Ho: Costmanagement strategy is not clearly/well defined and understood by relevant functional division in R.S.S. HA: Cost management strategy is clearly/well defined and understood by relevant functional division in R.S.S HO: μ = 2.5 HA: μ > 2.5 n = 35 Here X = 4.17 σ = 1.03 Z Cal = (X – μ)/ (σ/√n) = 9.59 At 5% level of significance, follows Z distribution Z 0.05 = 1.645 Since Z Cal > Z Tab, the null hypothesis is rejected. So at 5% level of significance, it can be said that Cost management strategy is clearly/well defined and understood by relevant functional division R.S.S. In 5 point scale the mean value is 2.5 3% 6% 11% 31% 49% Hypothesis: 5 Strongly Disagree Disgree Neither Agree nor Disagree Agree Strongly Agree Exploded 3D Pie Chart 5: Respondents view towards Cost management strategy is clearly/well defined and understood by relevant functional division in R.S.S 51
  • 52.
    Hypothesis- 6 Ho: Anychange in budgeting and costing method is not difficult to be aligned with company’s (R.S.S) cost management strategy. HA: Any change in budgeting and costing method is difficult to be aligned with company’s (R.S.S) cost management strategy. HO: μ = 2.5 HA: μ > 2.5 n = 35 Here X = 4.26 σ = 1.05 Z Cal = (X – μ)/ (σ/√n) = 11.32 At 5% level of significance, follows Z distribution Z 0.05 = 1.645 Since Z Cal > Z Tab, the null hypothesis is not acceptable. So at 5% level of significance, it can be said that any change in budgeting and costing method is difficult to be aligned with company’s (R.S.S) cost management strategy. In 5 point scale the mean value is 2.5 3% 6% 11% 23%57% Hypothesis: 6 Strongly Disagree Disgree Neither Agree nor Disagree Agree Strongly Agree Exploded 3D Pie Chart 6: Respondents view towards any change in budgeting and costing method is difficult to be aligned with company’s (R.S.S) cost management strategy. 52
  • 53.
    Findings • R.S.S havecost control plan. In this hypothesis 37% of respondent are strongly agreed, 29% are agreed, 11% respondents are neither agreed nor disagreed and 14% respondents are disagreed and 9% respondents are strongly disagreed.(Hypothesis no.01) • R.S.S stablishes Bench Mark for cost controlling of different cost pool. In this hypothesis 23% of respondent are strongly agreed, 40% are agreed, 6% respondents are neither agreed nor disagreed and 14% respondents are disagreed and 17% respondents are strongly disagreed. (Hypothesis no.02) • R.S.S’s management maintains a complicated internal Auditing process for cost controlling. In this hypothesis 43% of respondent are strongly agreed, 20% are agreed, 9% respondents are neither agreed nor disagreed and 17% respondents are disagreed and 11% respondents are strongly disagreed.(Hypothesis no.03) 53
  • 54.
    Continue… • R.S.S’s topmanagement regularly communicates with operating level management during the process of budgeting. In this hypothesis 43% of respondent are strongly agreed, 29% are agreed, 17% respondents are neither agreed nor disagreed and 11% respondents are disagreed and 0% respondents are strongly disagreed.( Hypothesis no.04) • Cost management strategy is clearly/well defined and understood by relevant functional division in R.S.S.In this hypothesis 49% of respondent are strongly agreed, 31% are agreed, 11% respondents are neither agreed nor disagreed and 6% respondents are disagreed and 3% respondents are strongly disagreed.( Hypothesis no.05) • Any change in budgeting and costing method is difficult to be aligned with company’s (R.S.S) cost management strategy. In this hypothesis 57% of respondent are strongly agreed, 23% are agreed, 11% respondents are neither agreed nor disagreed and 6% respondents are disagreed and 3% respondents are strongly disagreed.( Hypothesis no.06) 54
  • 55.
    Recommendation • It isgood for the company that cost control plan is existing. But they should consider a regular update of cost control plan. • R.S.S should keep in mind that bench mark can be changed based on time and situation. So it has to be revised every year and update accordingly. • In here almost 63% respondents are agreed to their complicated internal auditing system. R.S.S should make a digital inventory tracking system to make easier auditing and can resolve this issue. 55
  • 56.
    Continue… • As theoperating level management influence the budget through the top management, so operation level management should train regarding the operation management and strategies. • R.S.S uses a simple cost management so it is easier for them to make everyone understand about it. They should use simple strategy in future too and an updated cost management training should be arranged for the functional division. • R.S.S mainly follows international business, and in here cost is fixed from the very beginning. Sometimes they need to change some issues for client requirement. So they should develop a contingency cost plan to fulfill the sudden client need. 56
  • 57.
  • 58.
  • 59.
    Conclusion R.S.S Thread andAccessories Limited established to become a leading company in Bangladesh. It is a new generation organization with latest machinery. It is committed to provide high quality products to contribute to the growth of GDP of the industrialization, boosting up export, creating employment opportunity for the educated youth, rising standard of living of limited income group and overall sustainable socio-economic development of Bangladesh. Though R.S.S is a very good company but In my internship period, I have found some problem to cost management in R.S.S and I have done the research and I have given some recommendations to recover few problems. 59
  • 60.
    References (Format: HarvardReferencing) • R.S.S Thread & Accessories Ltd., about, http://www.rssbd.com/, Retrieved October 18th, 2017. • Brigham Eugene F & Houston Joel F, (2004), Fundamental of financial management, 10th edition,Thomson learning. • Horngren Charles T & others, (2009), Cost accounting-A managerial emphasis, 13th edition,Pearson education inc. • Ivancevich, John M., and Steven J. Skinner, (2003), “Business for the 21st Century”, 12th edition, Richard D. Irwin. • Zikmund, G. William, (2010), Business Research Methods, 8th edition, Cengage Learning, Chicago: Dryden Press. • Gupta.D.S.P., Gupta.D.M.P,(2008),”Business Statistics”,8th edition, Educational publishers New Delhi. • Kieso Donald E & others, (2009), Accounting Principles, 9th edition, George Hoffman. • Madhura Jeff, (2010), International financial management, 11th edition, Cengage Learning. • Investopidia,cost, https://strategiccfo.com/job-costing/, Retrieved November 25th 2017. • Business dictionary, http://www.businessdictionary.com/definition/benchmark.html, benchmark, Retrieved November 25th 2017 60
  • 61.
    Appendix A: Abbreviations • SWIFT– Society for Worldwide Interbank Financial Telecommunication. • BSCI- Business Social Compliance Initiative • PI – Pro forma Invoice • CI - Commercial Invoice • COC - Chain-of-Custody • PO- Pro forma Order • L/C- Letter of Credit • TTI- Total Tax Incidence • ROA- Return on Asset • ROE- Return on Equity 61
  • 62.