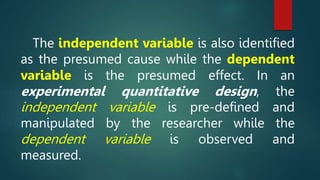
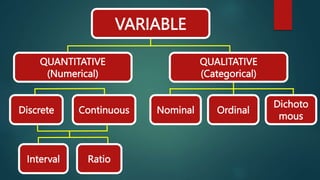
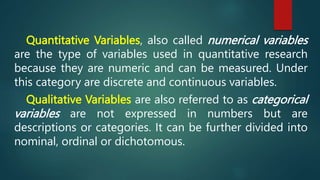
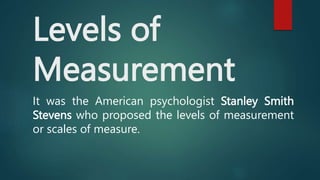
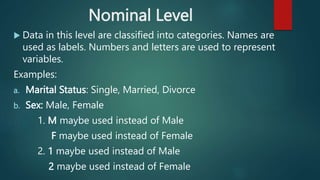
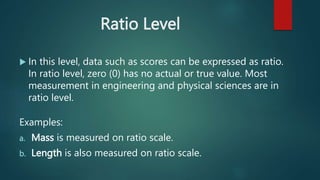
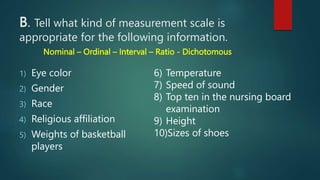
SlideShare a Scribd company logo
1 of 19
VARIABLES IN
QUANTITATIVE
RESEARCH
LESSON 3
A VARIABLE is anything that has a quantity or
quality that varies.
For instance, during the quarantine period, your
mother planted tomato seedlings in pots. Now
common understanding from science tells you
that several factors are affecting the growth of
tomatoes: sunlight, water, kind of soil, and
nutrients in soil.
The growth of tomatoes and the number of
fruits produced are examples of the
Dependent Variables. The amount of
water, and nutrients in the soil are the
Independent Variables.
The independent variable is also identified
as the presumed cause while the dependent
variable is the presumed effect. In an
experimental quantitative design, the
independent variable is pre-defined and
manipulated by the researcher while the
dependent variable is observed and
measured.
It is important to note other factors that may
influence the outcome (dependent variable)
which are not manipulated or pre-defined by the
researcher. These factors are called Extraneous
Variables. In our example , the presence of pests
and environmental stressors (e.g. pets, extreme
weather) are the extraneous variables.
When the researcher fails to control the
extraneous variable that it caused
considerable effect to the outcome, the
extraneous variable becomes a Confounding
Variable.
VARIABLE
QUANTITATIVE
(Numerical)
QUALITATIVE
(Categorical)
Discrete Continuous Nominal Ordinal
Dichoto
mous
Interval Ratio
Quantitative Variables, also called numerical variables
are the type of variables used in quantitative research
because they are numeric and can be measured. Under
this category are discrete and continuous variables.
Qualitative Variables are also referred to as categorical
variables are not expressed in numbers but are
descriptions or categories. It can be further divided into
nominal, ordinal or dichotomous.
 A discrete variable can assume a countable number of
values or whole numbers. It does not take negative values or
values between fixed points.
o Number of steps to the top of the Eiffel Tower*
 A continuous variable can assume any value along a given
interval of a number line. It takes fractional (non-whole
number) values that can either be a positive or a negative.
o The time a tourist stays at the top
once s/he gets there
 Discrete variables
o Number of sales
o Number of calls
o Shares of stock
o People in line
o Mistakes per page
 Continuous variables
o Length
o Depth
o Volume
o Time
o Weight
Levels of
Measurement
It was the American psychologist Stanley Smith
Stevens who proposed the levels of measurement
or scales of measure.
Nominal Level
 Data in this level are classified into categories. Names are
used as labels. Numbers and letters are used to represent
variables.
Examples:
a. Marital Status: Single, Married, Divorce
b. Sex: Male, Female
1. M maybe used instead of Male
F maybe used instead of Female
2. 1 maybe used instead of Male
2 maybe used instead of Female
Ordinal Level
 Data in this level are ranked but the degree of difference
between them are not determined. Items are ordered when
sorted out.
Example:
a. Size – small, medium, large, extra large
b. Rank – 1st, 2nd, 3rd, etc.
Interval Level
 The degree of difference between the data can be
specified but not the ratio between them. In this
level, zero (0) does not mean total absence of what
being measured.
Example:
a. Temperature in Celsius Scale
Ratio Level
 In this level, data such as scores can be expressed as ratio.
In ratio level, zero (0) has no actual or true value. Most
measurement in engineering and physical sciences are in
ratio level.
Examples:
a. Mass is measured on ratio scale.
b. Length is also measured on ratio scale.
Dichotomous
Dichotomous are consisting of only two
distinct categories or values.
For example, a response to a question either
be a yes or no.
B. Tell what kind of measurement scale is
appropriate for the following information.
Nominal – Ordinal – Interval – Ratio - Dichotomous
1) Eye color
2) Gender
3) Race
4) Religious affiliation
5) Weights of basketball
players
6) Temperature
7) Speed of sound
8) Top ten in the nursing board
examination
9) Height
10)Sizes of shoes

More Related Content

What's hot

Research title & knowing the problem
Research title & knowing the problemResearch title & knowing the problem
Research title & knowing the problem
Bean Malicse
 
DISTIGUISHING FEATURES OF ACADEMIC WRITING - Copy.pptx
DISTIGUISHING FEATURES OF ACADEMIC WRITING - Copy.pptxDISTIGUISHING FEATURES OF ACADEMIC WRITING - Copy.pptx
DISTIGUISHING FEATURES OF ACADEMIC WRITING - Copy.pptx
SupahPapah
 
Practical Research 1 Module 1 - REVISED.pdf
Practical Research 1 Module 1 - REVISED.pdfPractical Research 1 Module 1 - REVISED.pdf
Practical Research 1 Module 1 - REVISED.pdf
AlwinSostino2
 

What's hot (20)

Writing A Research Title
Writing A Research TitleWriting A Research Title
Writing A Research Title
 
EAPP-Q2-Report (1).pdf
EAPP-Q2-Report (1).pdfEAPP-Q2-Report (1).pdf
EAPP-Q2-Report (1).pdf
 
Characteristics of Quantitative Research
Characteristics of Quantitative ResearchCharacteristics of Quantitative Research
Characteristics of Quantitative Research
 
Position paper
Position paperPosition paper
Position paper
 
EAPP-WEEK-4-thesis-statements.pptx
EAPP-WEEK-4-thesis-statements.pptxEAPP-WEEK-4-thesis-statements.pptx
EAPP-WEEK-4-thesis-statements.pptx
 
Basics of Summarizing
Basics of SummarizingBasics of Summarizing
Basics of Summarizing
 
Research title & knowing the problem
Research title & knowing the problemResearch title & knowing the problem
Research title & knowing the problem
 
Summarizing a Variety of Academic Texts.pptx
Summarizing a Variety of Academic Texts.pptxSummarizing a Variety of Academic Texts.pptx
Summarizing a Variety of Academic Texts.pptx
 
DISTIGUISHING FEATURES OF ACADEMIC WRITING - Copy.pptx
DISTIGUISHING FEATURES OF ACADEMIC WRITING - Copy.pptxDISTIGUISHING FEATURES OF ACADEMIC WRITING - Copy.pptx
DISTIGUISHING FEATURES OF ACADEMIC WRITING - Copy.pptx
 
Structure of Academic Text/ Before, During and After Reading
Structure of Academic Text/ Before, During and After ReadingStructure of Academic Text/ Before, During and After Reading
Structure of Academic Text/ Before, During and After Reading
 
Mapanuring Mambabasa
Mapanuring MambabasaMapanuring Mambabasa
Mapanuring Mambabasa
 
Language Mechanics
Language MechanicsLanguage Mechanics
Language Mechanics
 
Lesson 3 Text and Context Connections.pptx
Lesson 3 Text and Context Connections.pptxLesson 3 Text and Context Connections.pptx
Lesson 3 Text and Context Connections.pptx
 
Chapter 1 presentation
Chapter 1 presentationChapter 1 presentation
Chapter 1 presentation
 
Critical Reading as Reasoning
Critical Reading as ReasoningCritical Reading as Reasoning
Critical Reading as Reasoning
 
ARALIN 8 MGA KATANGIAN AT URI NG PANANALIKSIK.pptx
ARALIN 8 MGA KATANGIAN AT URI NG PANANALIKSIK.pptxARALIN 8 MGA KATANGIAN AT URI NG PANANALIKSIK.pptx
ARALIN 8 MGA KATANGIAN AT URI NG PANANALIKSIK.pptx
 
Practical Research 1 Module 1 - REVISED.pdf
Practical Research 1 Module 1 - REVISED.pdfPractical Research 1 Module 1 - REVISED.pdf
Practical Research 1 Module 1 - REVISED.pdf
 
Sources
SourcesSources
Sources
 
Importance across fields
Importance across fieldsImportance across fields
Importance across fields
 
Mga bahagi ng Teksto.pptx
Mga bahagi ng Teksto.pptxMga bahagi ng Teksto.pptx
Mga bahagi ng Teksto.pptx
 

Similar to PR2-Module-1-Lesson-3.pptx

Ebd1 lecture 3 2010
Ebd1 lecture 3  2010Ebd1 lecture 3  2010
Ebd1 lecture 3 2010
Reko Kemo
 
Ebd1 lecture 3 2010
Ebd1 lecture 3  2010Ebd1 lecture 3  2010
Ebd1 lecture 3 2010
Reko Kemo
 
Ebd1 lecture 3 2010
Ebd1 lecture 3  2010Ebd1 lecture 3  2010
Ebd1 lecture 3 2010
Reko Kemo
 
Probability and statistics(exercise answers)
Probability and statistics(exercise answers)Probability and statistics(exercise answers)
Probability and statistics(exercise answers)
Fatima Bianca Gueco
 
Probability and statistics
Probability and statisticsProbability and statistics
Probability and statistics
trixiacruz
 
measurementofscales-140430001245-phpapp02.pptx
measurementofscales-140430001245-phpapp02.pptxmeasurementofscales-140430001245-phpapp02.pptx
measurementofscales-140430001245-phpapp02.pptx
anitha764188
 

Similar to PR2-Module-1-Lesson-3.pptx (20)

Ebd1 lecture 3 2010
Ebd1 lecture 3  2010Ebd1 lecture 3  2010
Ebd1 lecture 3 2010
 
Ebd1 lecture 3 2010
Ebd1 lecture 3  2010Ebd1 lecture 3  2010
Ebd1 lecture 3 2010
 
Ebd1 lecture 3 2010
Ebd1 lecture 3  2010Ebd1 lecture 3  2010
Ebd1 lecture 3 2010
 
Advantages of Quantitative Research.pptx
Advantages of Quantitative Research.pptxAdvantages of Quantitative Research.pptx
Advantages of Quantitative Research.pptx
 
Practical Research 2 - Lesson Plan on Research Variables.docx
Practical Research 2 - Lesson Plan on Research Variables.docxPractical Research 2 - Lesson Plan on Research Variables.docx
Practical Research 2 - Lesson Plan on Research Variables.docx
 
Sta301 lec01
Sta301 lec01Sta301 lec01
Sta301 lec01
 
Probability and statistics(assign 7 and 8)
Probability and statistics(assign 7 and 8)Probability and statistics(assign 7 and 8)
Probability and statistics(assign 7 and 8)
 
New statistics
New statisticsNew statistics
New statistics
 
Probability and statistics
Probability and statisticsProbability and statistics
Probability and statistics
 
Probability and statistics(exercise answers)
Probability and statistics(exercise answers)Probability and statistics(exercise answers)
Probability and statistics(exercise answers)
 
Probability and statistics
Probability and statisticsProbability and statistics
Probability and statistics
 
Statistics1(finals)
Statistics1(finals)Statistics1(finals)
Statistics1(finals)
 
Probability and statistics
Probability and statisticsProbability and statistics
Probability and statistics
 
Finals Stat 1
Finals Stat 1Finals Stat 1
Finals Stat 1
 
Statistics and probability lecture 01
Statistics and probability  lecture 01Statistics and probability  lecture 01
Statistics and probability lecture 01
 
Statistics and probability
Statistics and probability   Statistics and probability
Statistics and probability
 
VARIABLES PR2.pptx
VARIABLES PR2.pptxVARIABLES PR2.pptx
VARIABLES PR2.pptx
 
Mr 4. quantitative research design and methods
Mr 4. quantitative research design and methodsMr 4. quantitative research design and methods
Mr 4. quantitative research design and methods
 
measurementofscales-140430001245-phpapp02.pptx
measurementofscales-140430001245-phpapp02.pptxmeasurementofscales-140430001245-phpapp02.pptx
measurementofscales-140430001245-phpapp02.pptx
 
Measurment scales
Measurment scalesMeasurment scales
Measurment scales
 

Recently uploaded

Gardella_Mateo_IntellectualProperty.pdf.
Gardella_Mateo_IntellectualProperty.pdf.Gardella_Mateo_IntellectualProperty.pdf.
Gardella_Mateo_IntellectualProperty.pdf.
MateoGardella
 

Recently uploaded (20)

Explore beautiful and ugly buildings. Mathematics helps us create beautiful d...
Explore beautiful and ugly buildings. Mathematics helps us create beautiful d...Explore beautiful and ugly buildings. Mathematics helps us create beautiful d...
Explore beautiful and ugly buildings. Mathematics helps us create beautiful d...
 
Gardella_Mateo_IntellectualProperty.pdf.
Gardella_Mateo_IntellectualProperty.pdf.Gardella_Mateo_IntellectualProperty.pdf.
Gardella_Mateo_IntellectualProperty.pdf.
 
Advance Mobile Application Development class 07
Advance Mobile Application Development class 07Advance Mobile Application Development class 07
Advance Mobile Application Development class 07
 
SECOND SEMESTER TOPIC COVERAGE SY 2023-2024 Trends, Networks, and Critical Th...
SECOND SEMESTER TOPIC COVERAGE SY 2023-2024 Trends, Networks, and Critical Th...SECOND SEMESTER TOPIC COVERAGE SY 2023-2024 Trends, Networks, and Critical Th...
SECOND SEMESTER TOPIC COVERAGE SY 2023-2024 Trends, Networks, and Critical Th...
 
Ecological Succession. ( ECOSYSTEM, B. Pharmacy, 1st Year, Sem-II, Environmen...
Ecological Succession. ( ECOSYSTEM, B. Pharmacy, 1st Year, Sem-II, Environmen...Ecological Succession. ( ECOSYSTEM, B. Pharmacy, 1st Year, Sem-II, Environmen...
Ecological Succession. ( ECOSYSTEM, B. Pharmacy, 1st Year, Sem-II, Environmen...
 
This PowerPoint helps students to consider the concept of infinity.
This PowerPoint helps students to consider the concept of infinity.This PowerPoint helps students to consider the concept of infinity.
This PowerPoint helps students to consider the concept of infinity.
 
SOCIAL AND HISTORICAL CONTEXT - LFTVD.pptx
SOCIAL AND HISTORICAL CONTEXT - LFTVD.pptxSOCIAL AND HISTORICAL CONTEXT - LFTVD.pptx
SOCIAL AND HISTORICAL CONTEXT - LFTVD.pptx
 
PROCESS RECORDING FORMAT.docx
PROCESS      RECORDING        FORMAT.docxPROCESS      RECORDING        FORMAT.docx
PROCESS RECORDING FORMAT.docx
 
How to Give a Domain for a Field in Odoo 17
How to Give a Domain for a Field in Odoo 17How to Give a Domain for a Field in Odoo 17
How to Give a Domain for a Field in Odoo 17
 
Advanced Views - Calendar View in Odoo 17
Advanced Views - Calendar View in Odoo 17Advanced Views - Calendar View in Odoo 17
Advanced Views - Calendar View in Odoo 17
 
Accessible design: Minimum effort, maximum impact
Accessible design: Minimum effort, maximum impactAccessible design: Minimum effort, maximum impact
Accessible design: Minimum effort, maximum impact
 
Paris 2024 Olympic Geographies - an activity
Paris 2024 Olympic Geographies - an activityParis 2024 Olympic Geographies - an activity
Paris 2024 Olympic Geographies - an activity
 
Unit-V; Pricing (Pharma Marketing Management).pptx
Unit-V; Pricing (Pharma Marketing Management).pptxUnit-V; Pricing (Pharma Marketing Management).pptx
Unit-V; Pricing (Pharma Marketing Management).pptx
 
Basic Civil Engineering first year Notes- Chapter 4 Building.pptx
Basic Civil Engineering first year Notes- Chapter 4 Building.pptxBasic Civil Engineering first year Notes- Chapter 4 Building.pptx
Basic Civil Engineering first year Notes- Chapter 4 Building.pptx
 
Grant Readiness 101 TechSoup and Remy Consulting
Grant Readiness 101 TechSoup and Remy ConsultingGrant Readiness 101 TechSoup and Remy Consulting
Grant Readiness 101 TechSoup and Remy Consulting
 
Mattingly "AI & Prompt Design: The Basics of Prompt Design"
Mattingly "AI & Prompt Design: The Basics of Prompt Design"Mattingly "AI & Prompt Design: The Basics of Prompt Design"
Mattingly "AI & Prompt Design: The Basics of Prompt Design"
 
microwave assisted reaction. General introduction
microwave assisted reaction. General introductionmicrowave assisted reaction. General introduction
microwave assisted reaction. General introduction
 
fourth grading exam for kindergarten in writing
fourth grading exam for kindergarten in writingfourth grading exam for kindergarten in writing
fourth grading exam for kindergarten in writing
 
Nutritional Needs Presentation - HLTH 104
Nutritional Needs Presentation - HLTH 104Nutritional Needs Presentation - HLTH 104
Nutritional Needs Presentation - HLTH 104
 
Web & Social Media Analytics Previous Year Question Paper.pdf
Web & Social Media Analytics Previous Year Question Paper.pdfWeb & Social Media Analytics Previous Year Question Paper.pdf
Web & Social Media Analytics Previous Year Question Paper.pdf
 

PR2-Module-1-Lesson-3.pptx

  • 2. A VARIABLE is anything that has a quantity or quality that varies. For instance, during the quarantine period, your mother planted tomato seedlings in pots. Now common understanding from science tells you that several factors are affecting the growth of tomatoes: sunlight, water, kind of soil, and nutrients in soil.
  • 3. The growth of tomatoes and the number of fruits produced are examples of the Dependent Variables. The amount of water, and nutrients in the soil are the Independent Variables.
  • 4. The independent variable is also identified as the presumed cause while the dependent variable is the presumed effect. In an experimental quantitative design, the independent variable is pre-defined and manipulated by the researcher while the dependent variable is observed and measured.
  • 5. It is important to note other factors that may influence the outcome (dependent variable) which are not manipulated or pre-defined by the researcher. These factors are called Extraneous Variables. In our example , the presence of pests and environmental stressors (e.g. pets, extreme weather) are the extraneous variables.
  • 6. When the researcher fails to control the extraneous variable that it caused considerable effect to the outcome, the extraneous variable becomes a Confounding Variable.
  • 8. Quantitative Variables, also called numerical variables are the type of variables used in quantitative research because they are numeric and can be measured. Under this category are discrete and continuous variables. Qualitative Variables are also referred to as categorical variables are not expressed in numbers but are descriptions or categories. It can be further divided into nominal, ordinal or dichotomous.
  • 9.  A discrete variable can assume a countable number of values or whole numbers. It does not take negative values or values between fixed points. o Number of steps to the top of the Eiffel Tower*  A continuous variable can assume any value along a given interval of a number line. It takes fractional (non-whole number) values that can either be a positive or a negative. o The time a tourist stays at the top once s/he gets there
  • 10.  Discrete variables o Number of sales o Number of calls o Shares of stock o People in line o Mistakes per page  Continuous variables o Length o Depth o Volume o Time o Weight
  • 11. Levels of Measurement It was the American psychologist Stanley Smith Stevens who proposed the levels of measurement or scales of measure.
  • 12. Nominal Level  Data in this level are classified into categories. Names are used as labels. Numbers and letters are used to represent variables. Examples: a. Marital Status: Single, Married, Divorce b. Sex: Male, Female 1. M maybe used instead of Male F maybe used instead of Female 2. 1 maybe used instead of Male 2 maybe used instead of Female
  • 13. Ordinal Level  Data in this level are ranked but the degree of difference between them are not determined. Items are ordered when sorted out. Example: a. Size – small, medium, large, extra large b. Rank – 1st, 2nd, 3rd, etc.
  • 14. Interval Level  The degree of difference between the data can be specified but not the ratio between them. In this level, zero (0) does not mean total absence of what being measured. Example: a. Temperature in Celsius Scale
  • 15. Ratio Level  In this level, data such as scores can be expressed as ratio. In ratio level, zero (0) has no actual or true value. Most measurement in engineering and physical sciences are in ratio level. Examples: a. Mass is measured on ratio scale. b. Length is also measured on ratio scale.
  • 16. Dichotomous Dichotomous are consisting of only two distinct categories or values. For example, a response to a question either be a yes or no.
  • 17.
  • 18.
  • 19. B. Tell what kind of measurement scale is appropriate for the following information. Nominal – Ordinal – Interval – Ratio - Dichotomous 1) Eye color 2) Gender 3) Race 4) Religious affiliation 5) Weights of basketball players 6) Temperature 7) Speed of sound 8) Top ten in the nursing board examination 9) Height 10)Sizes of shoes