Download to read offline
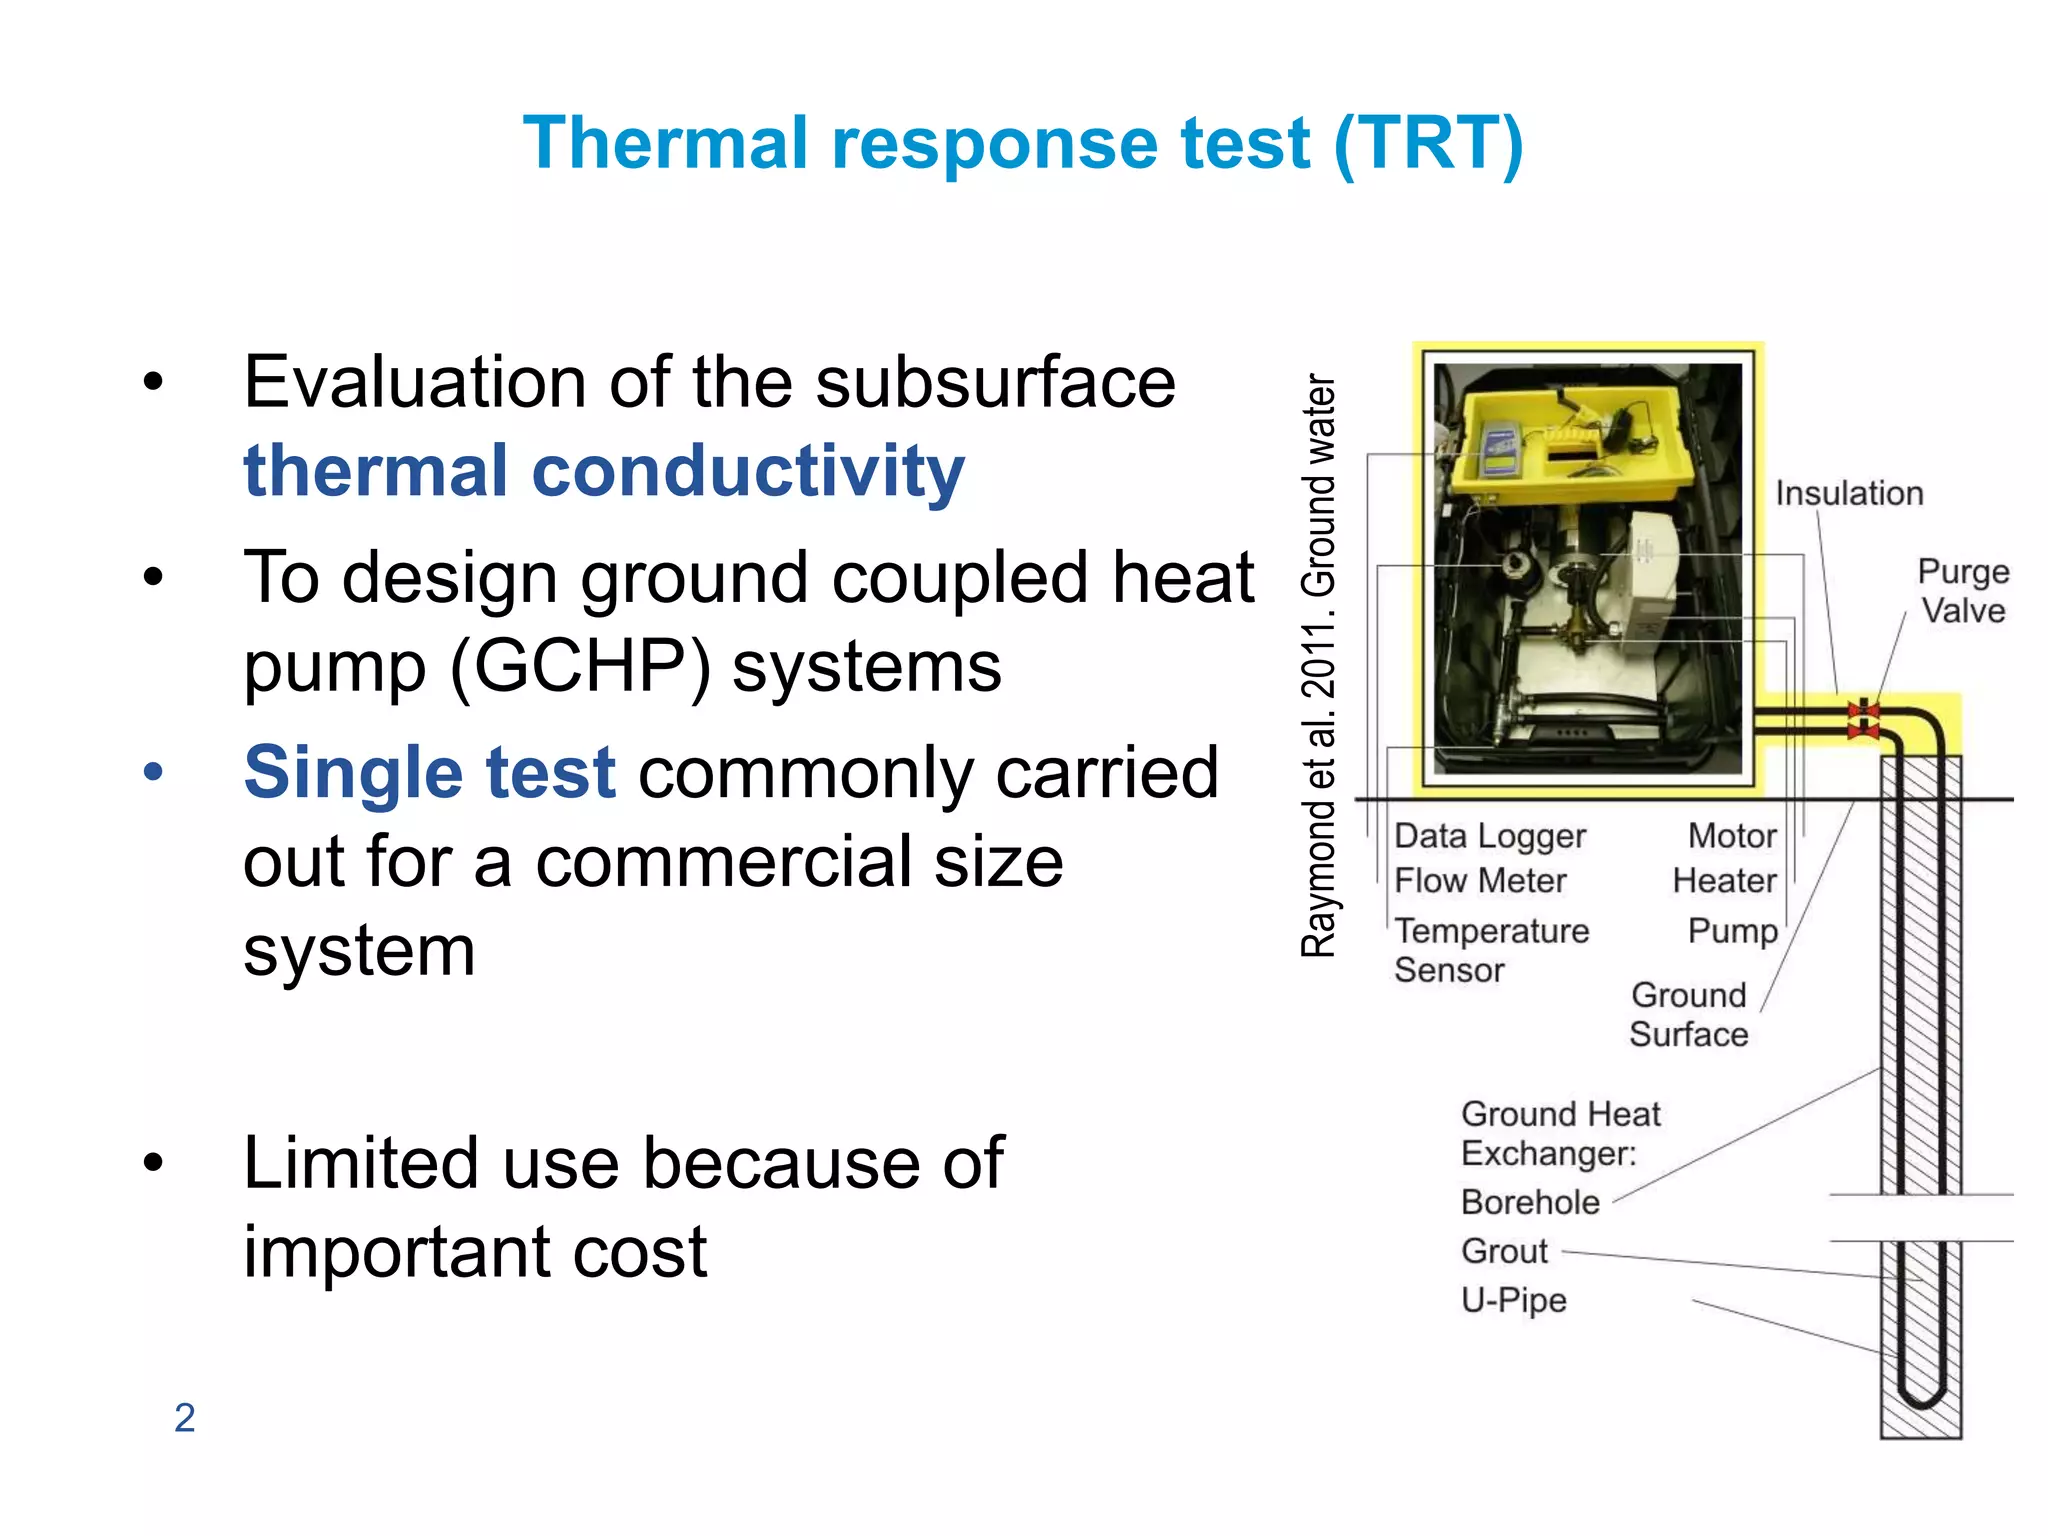
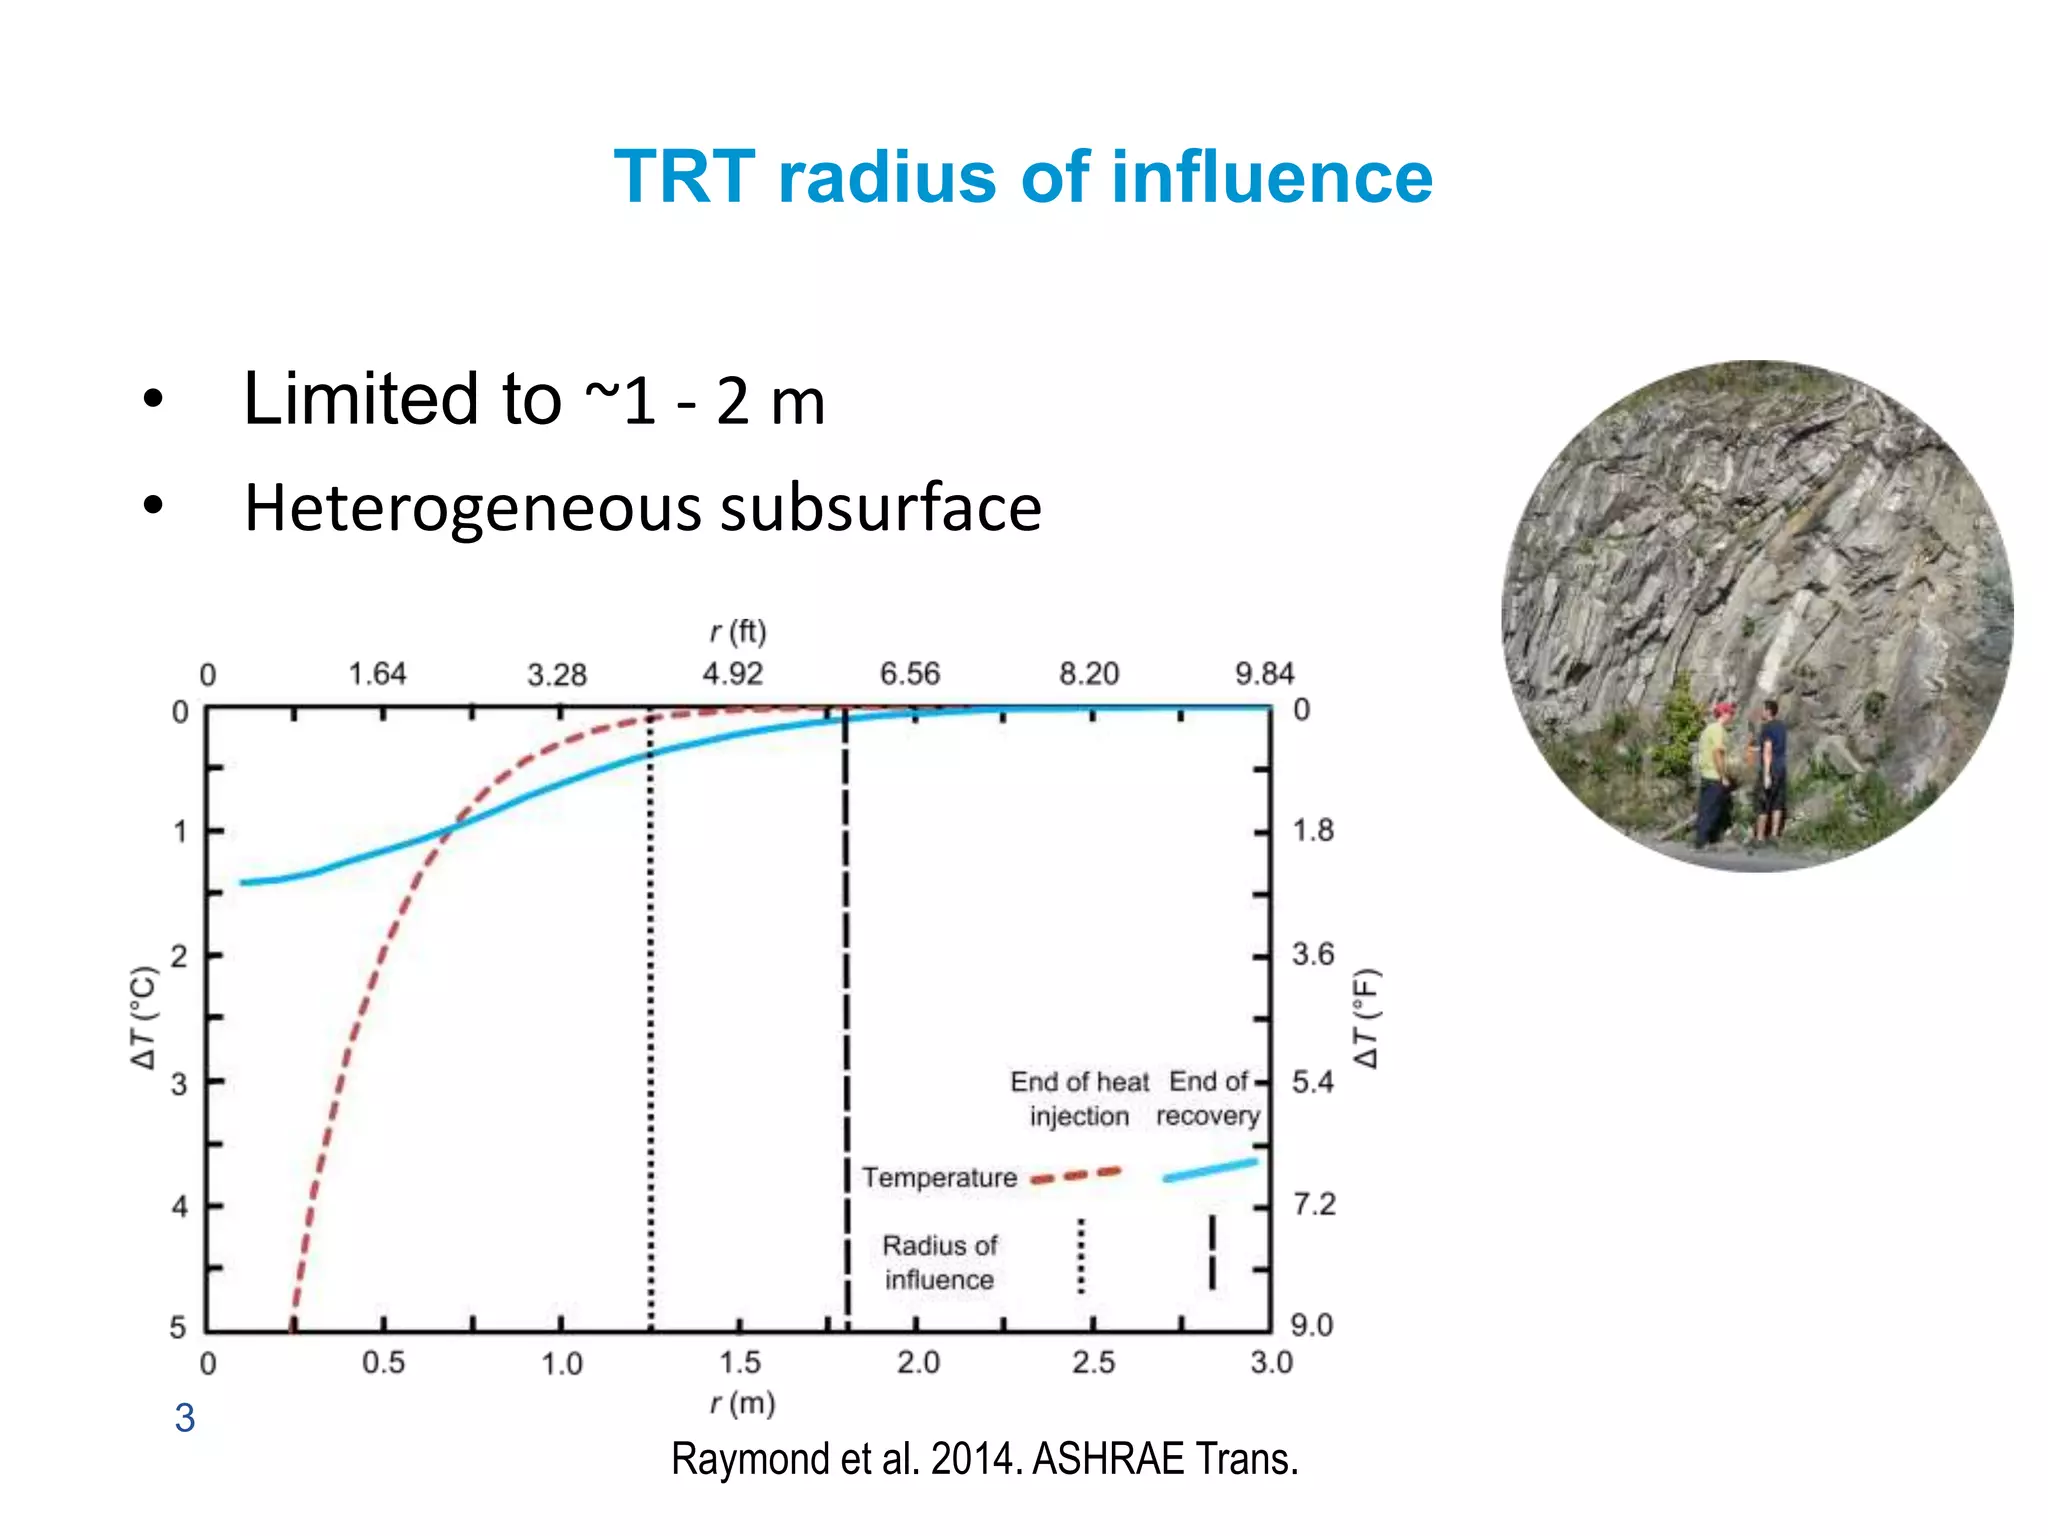
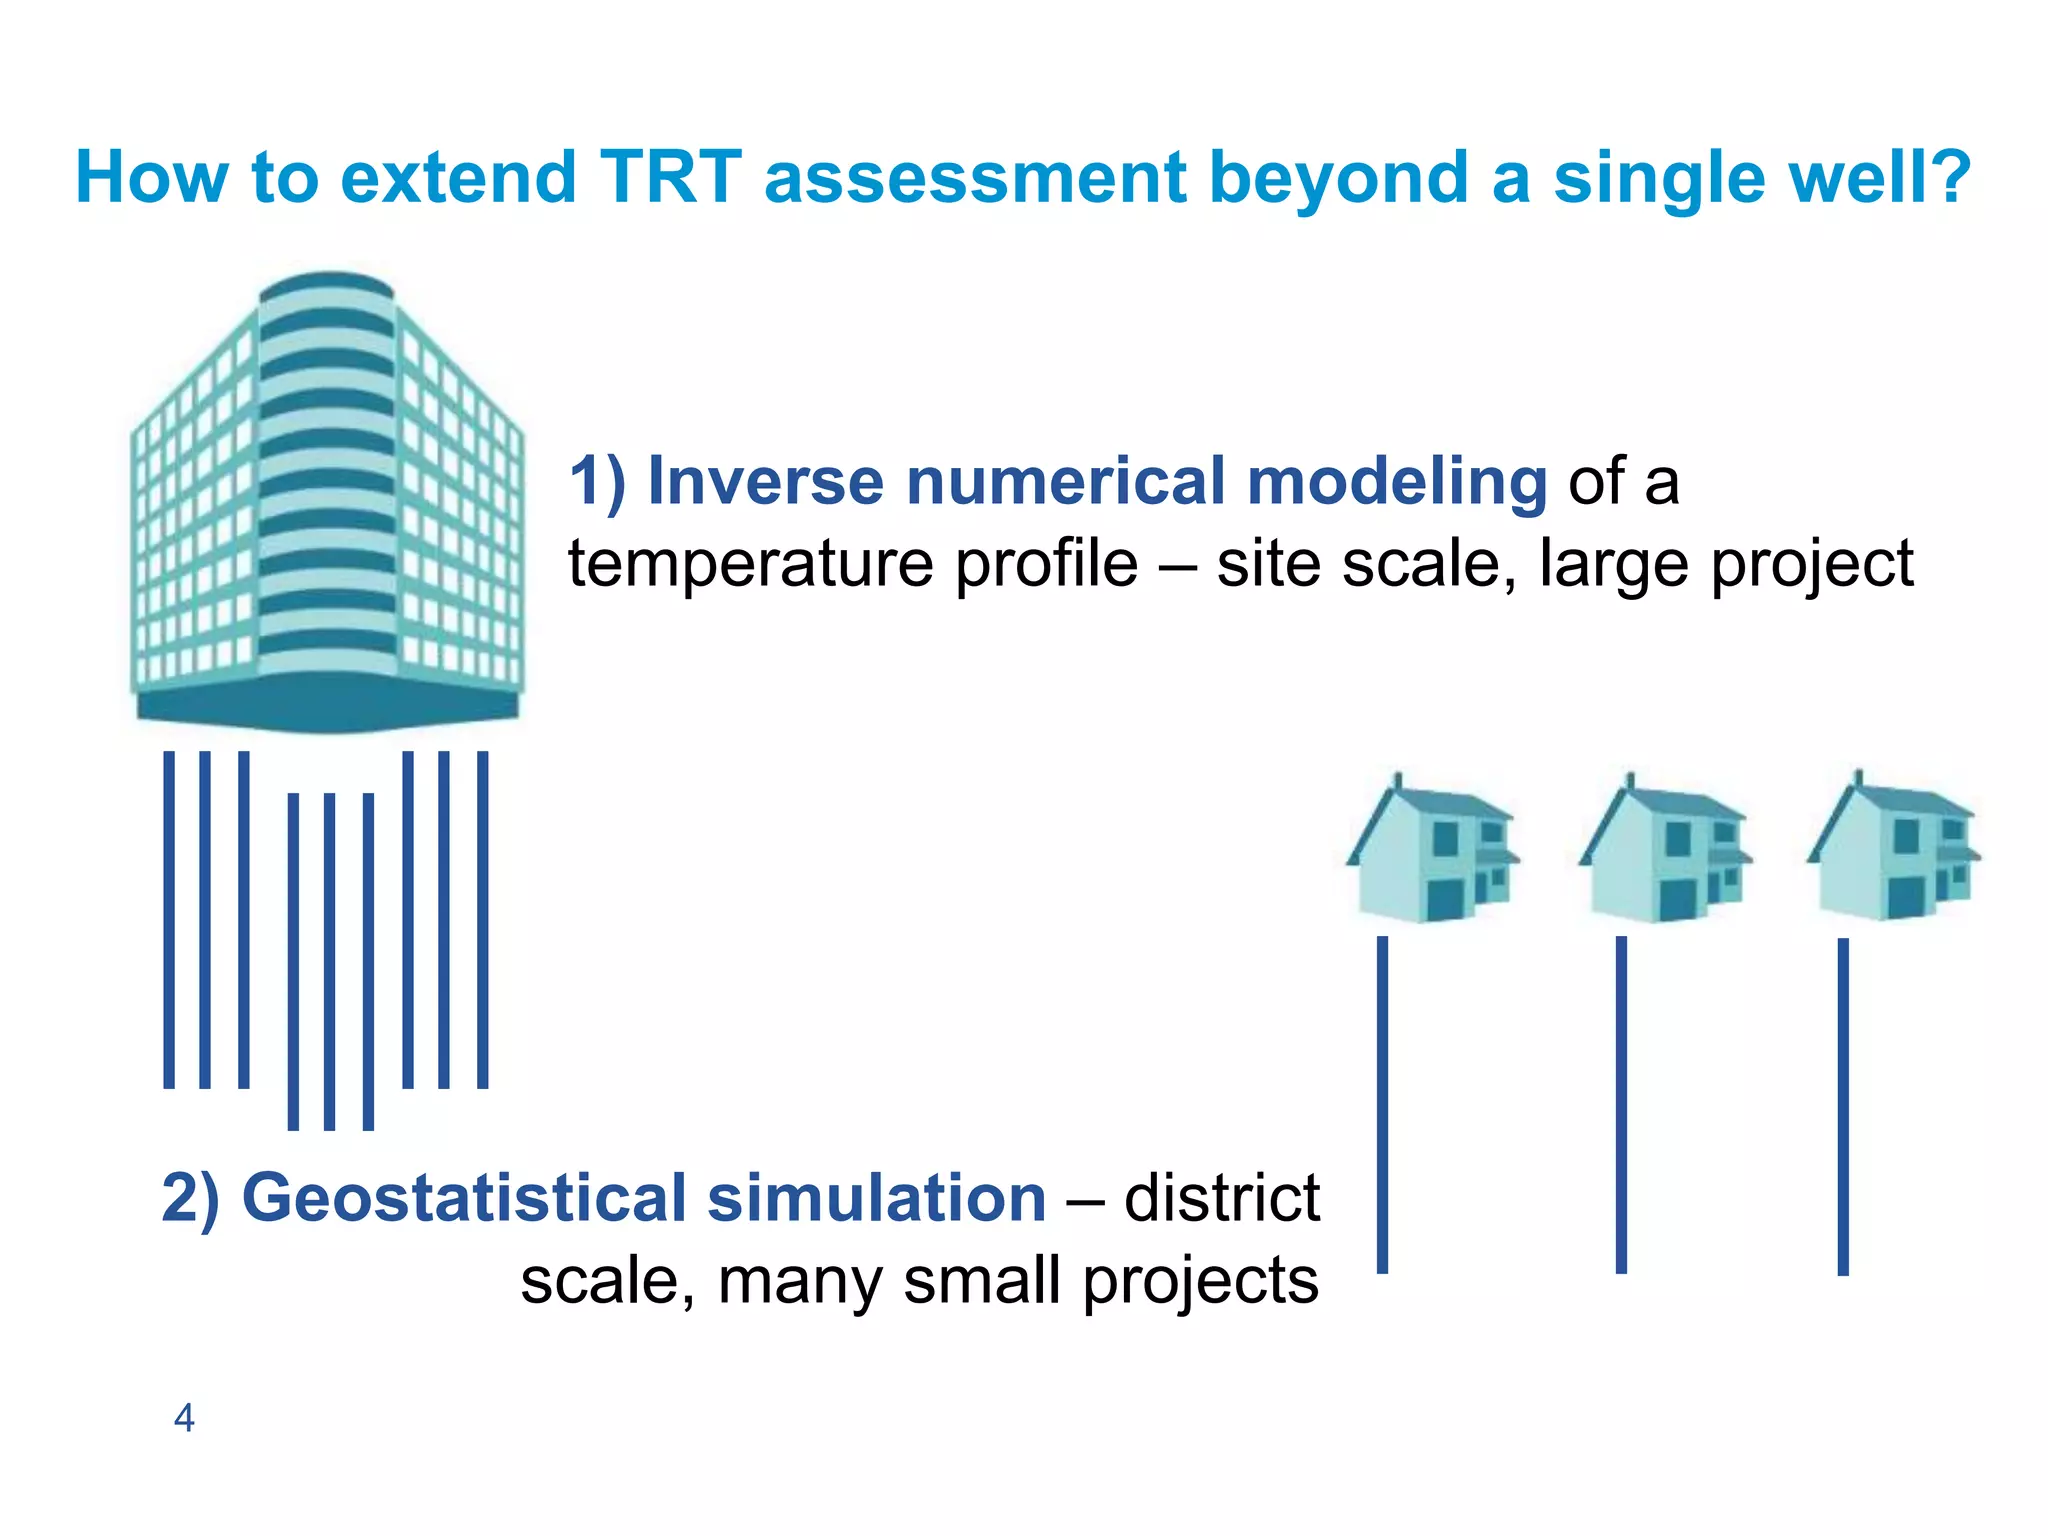
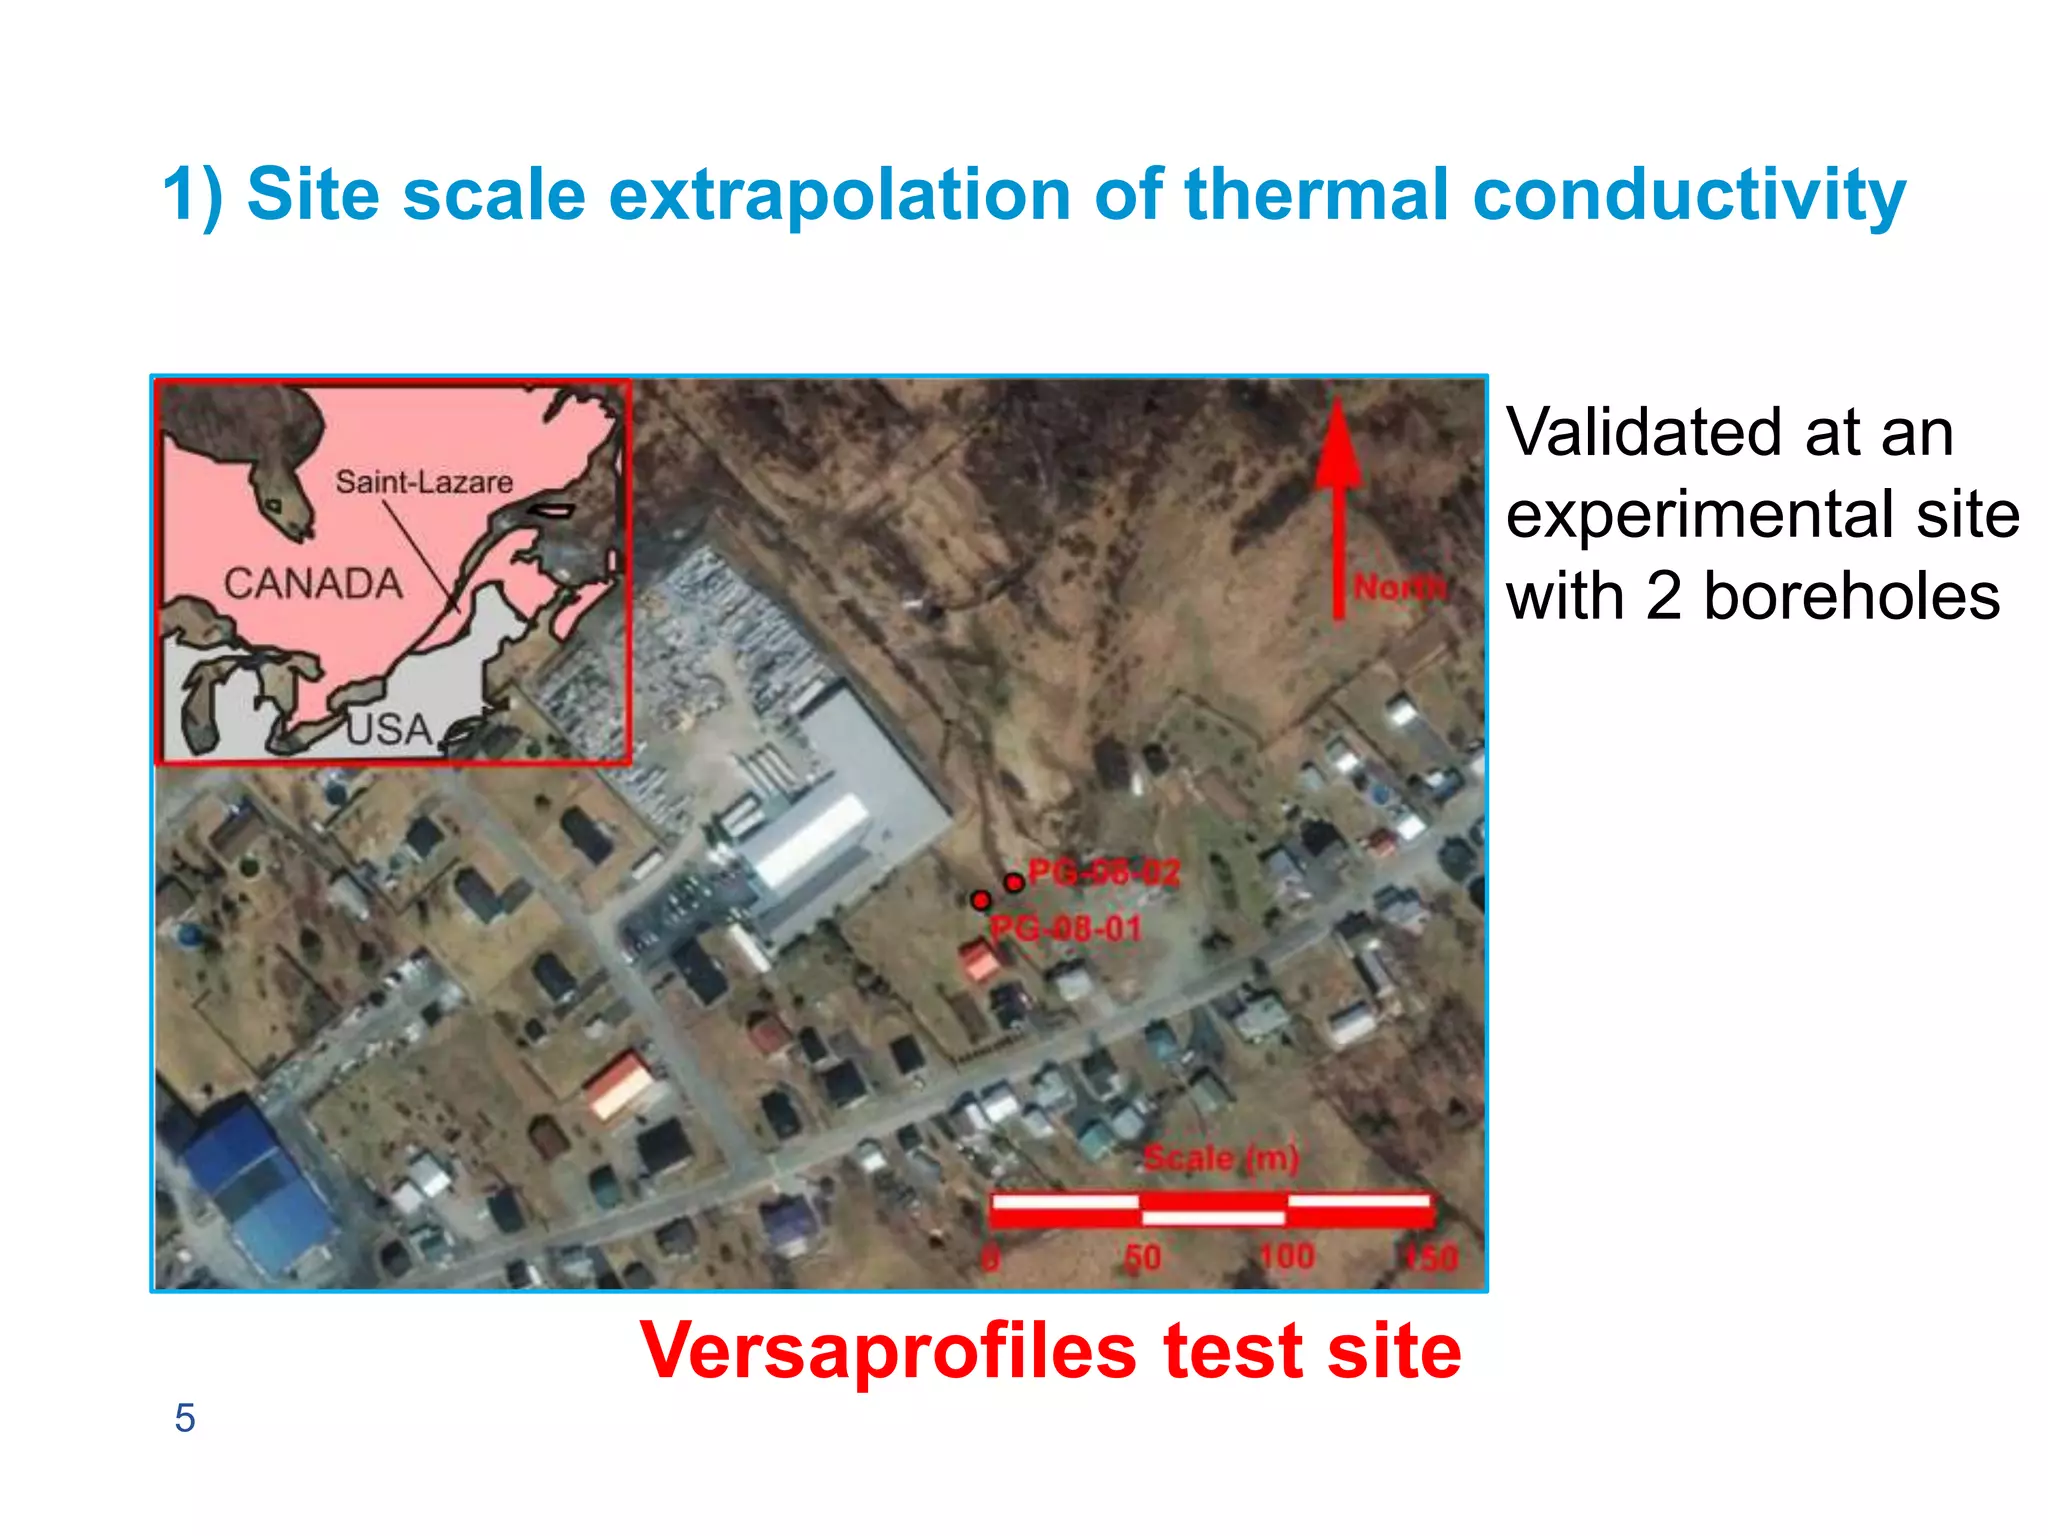
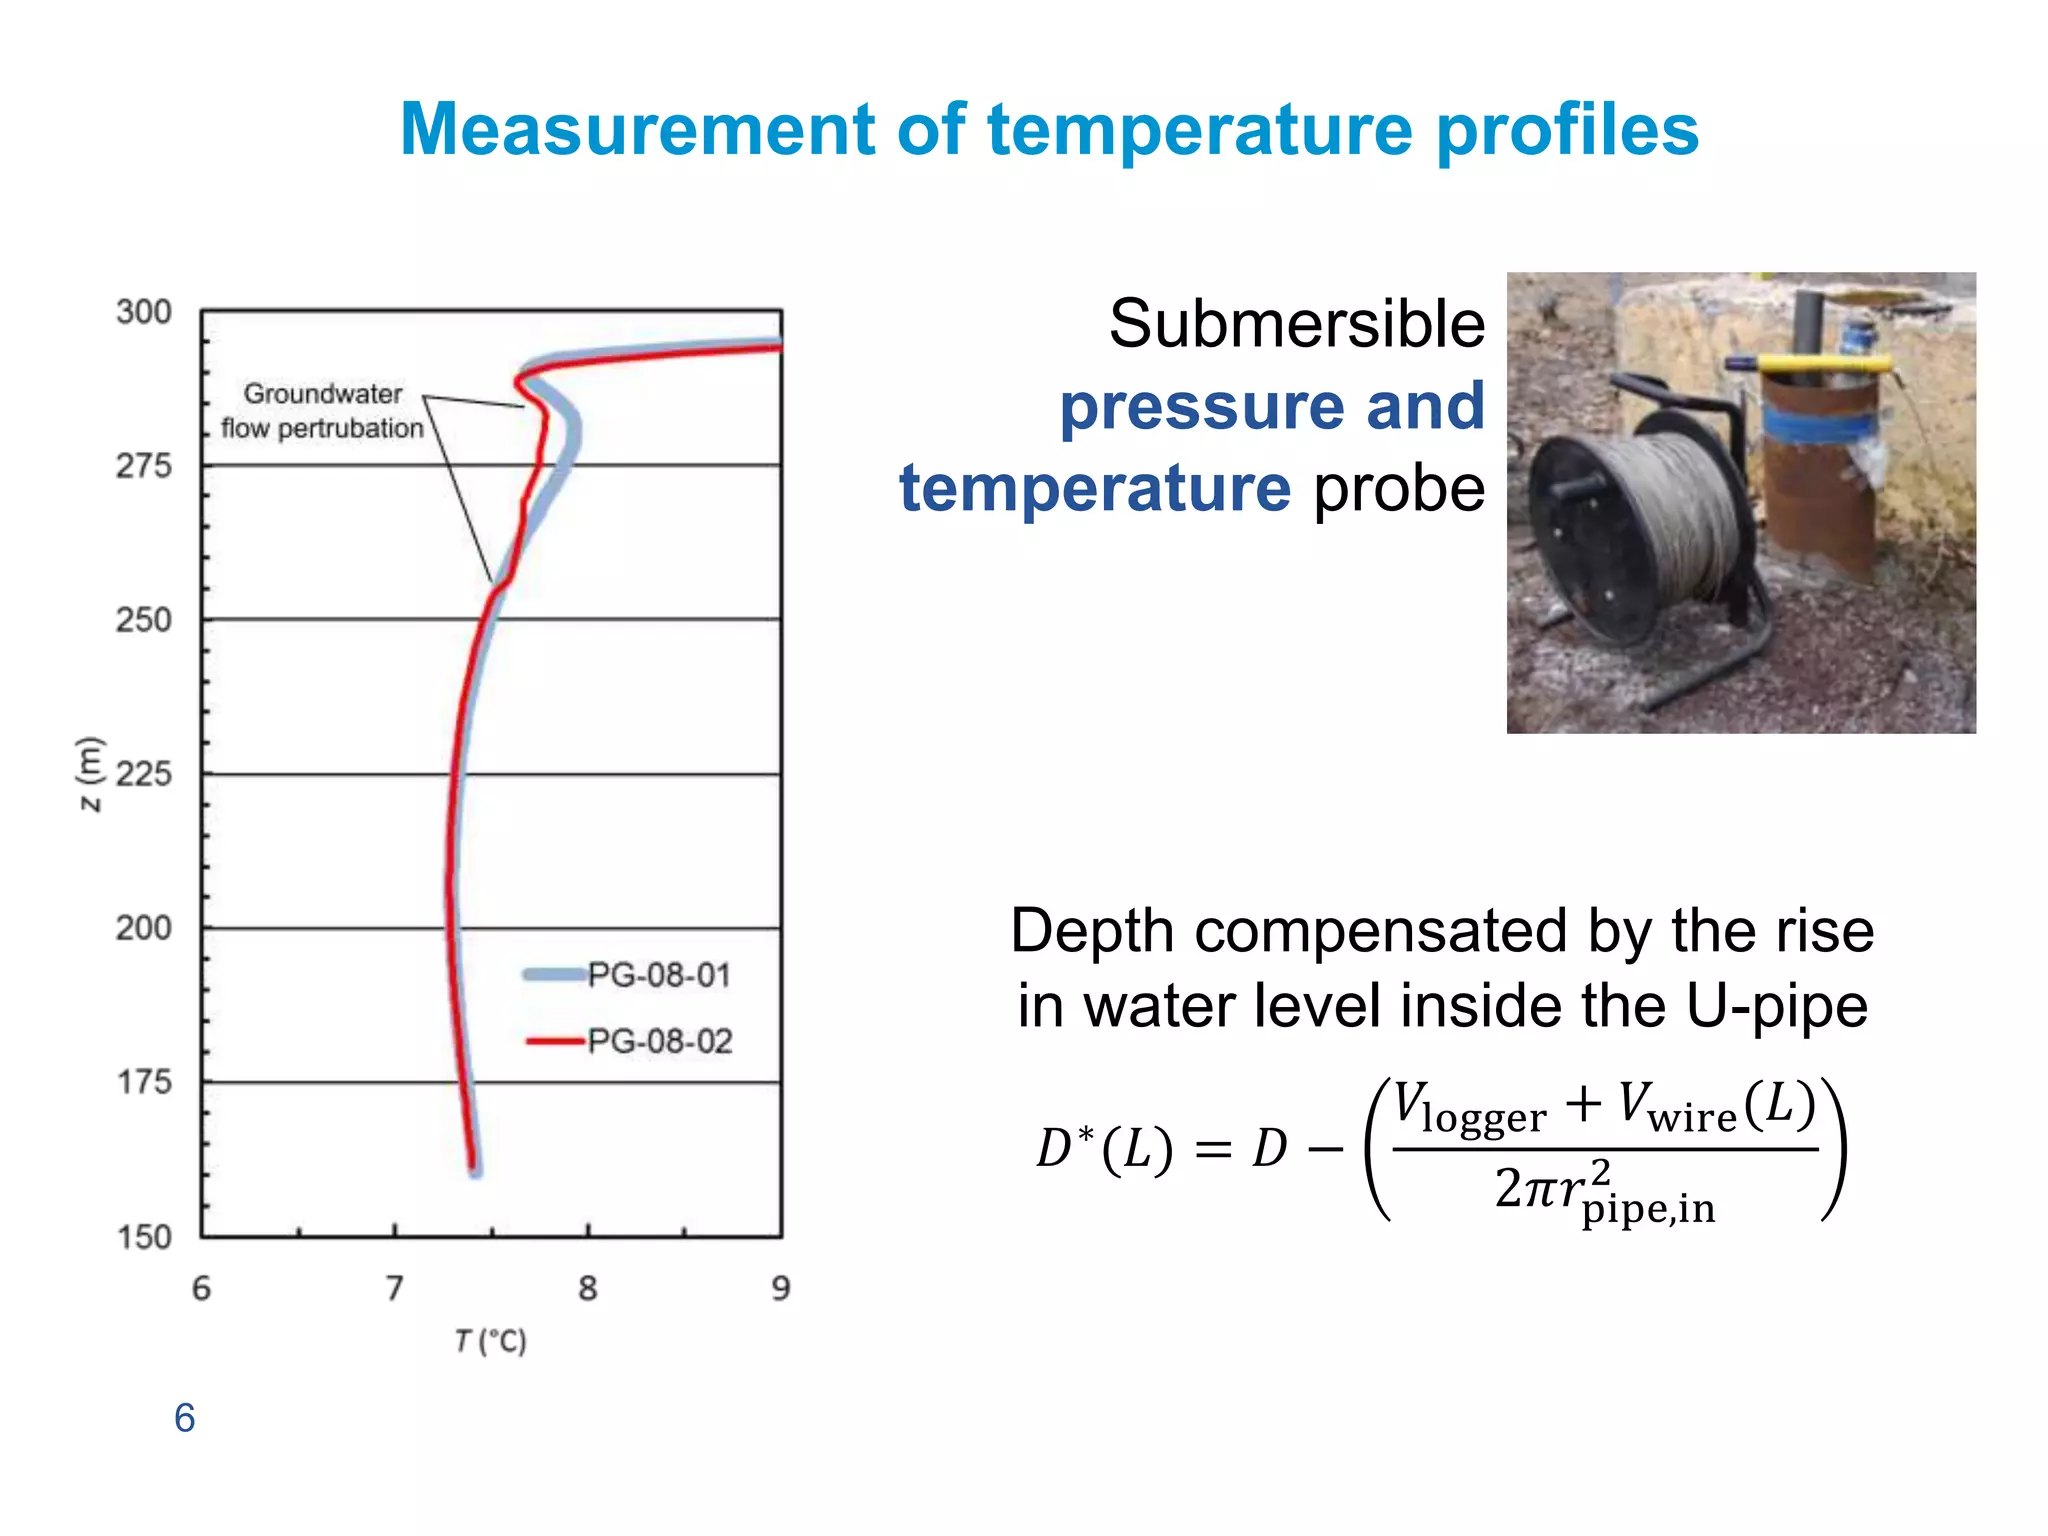
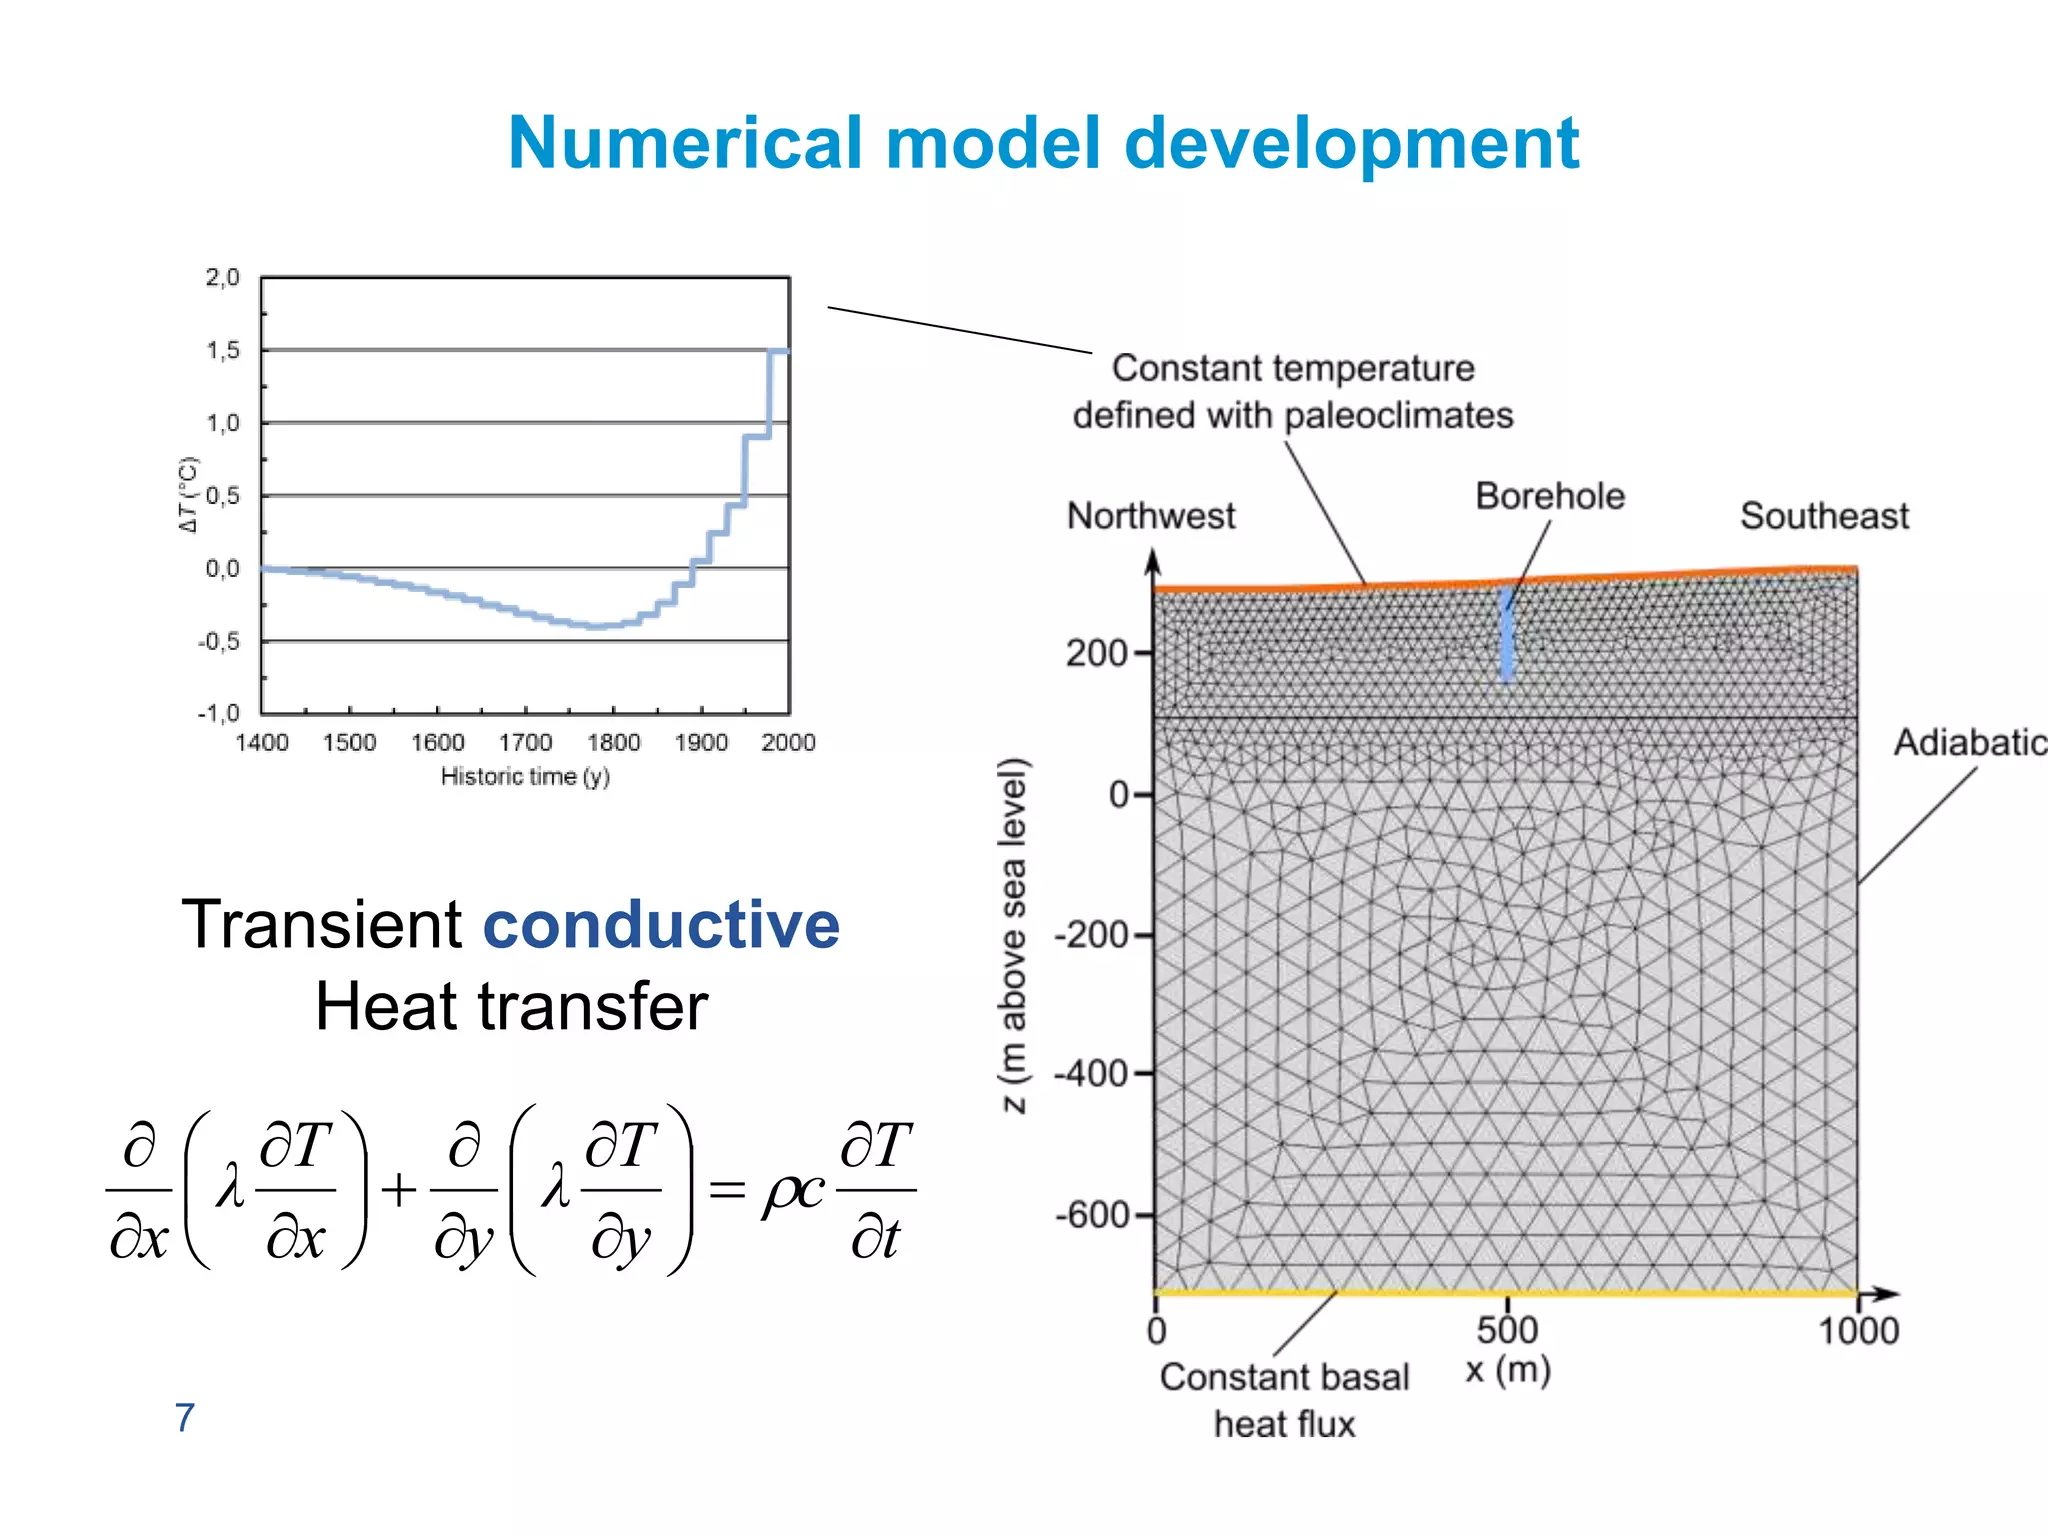
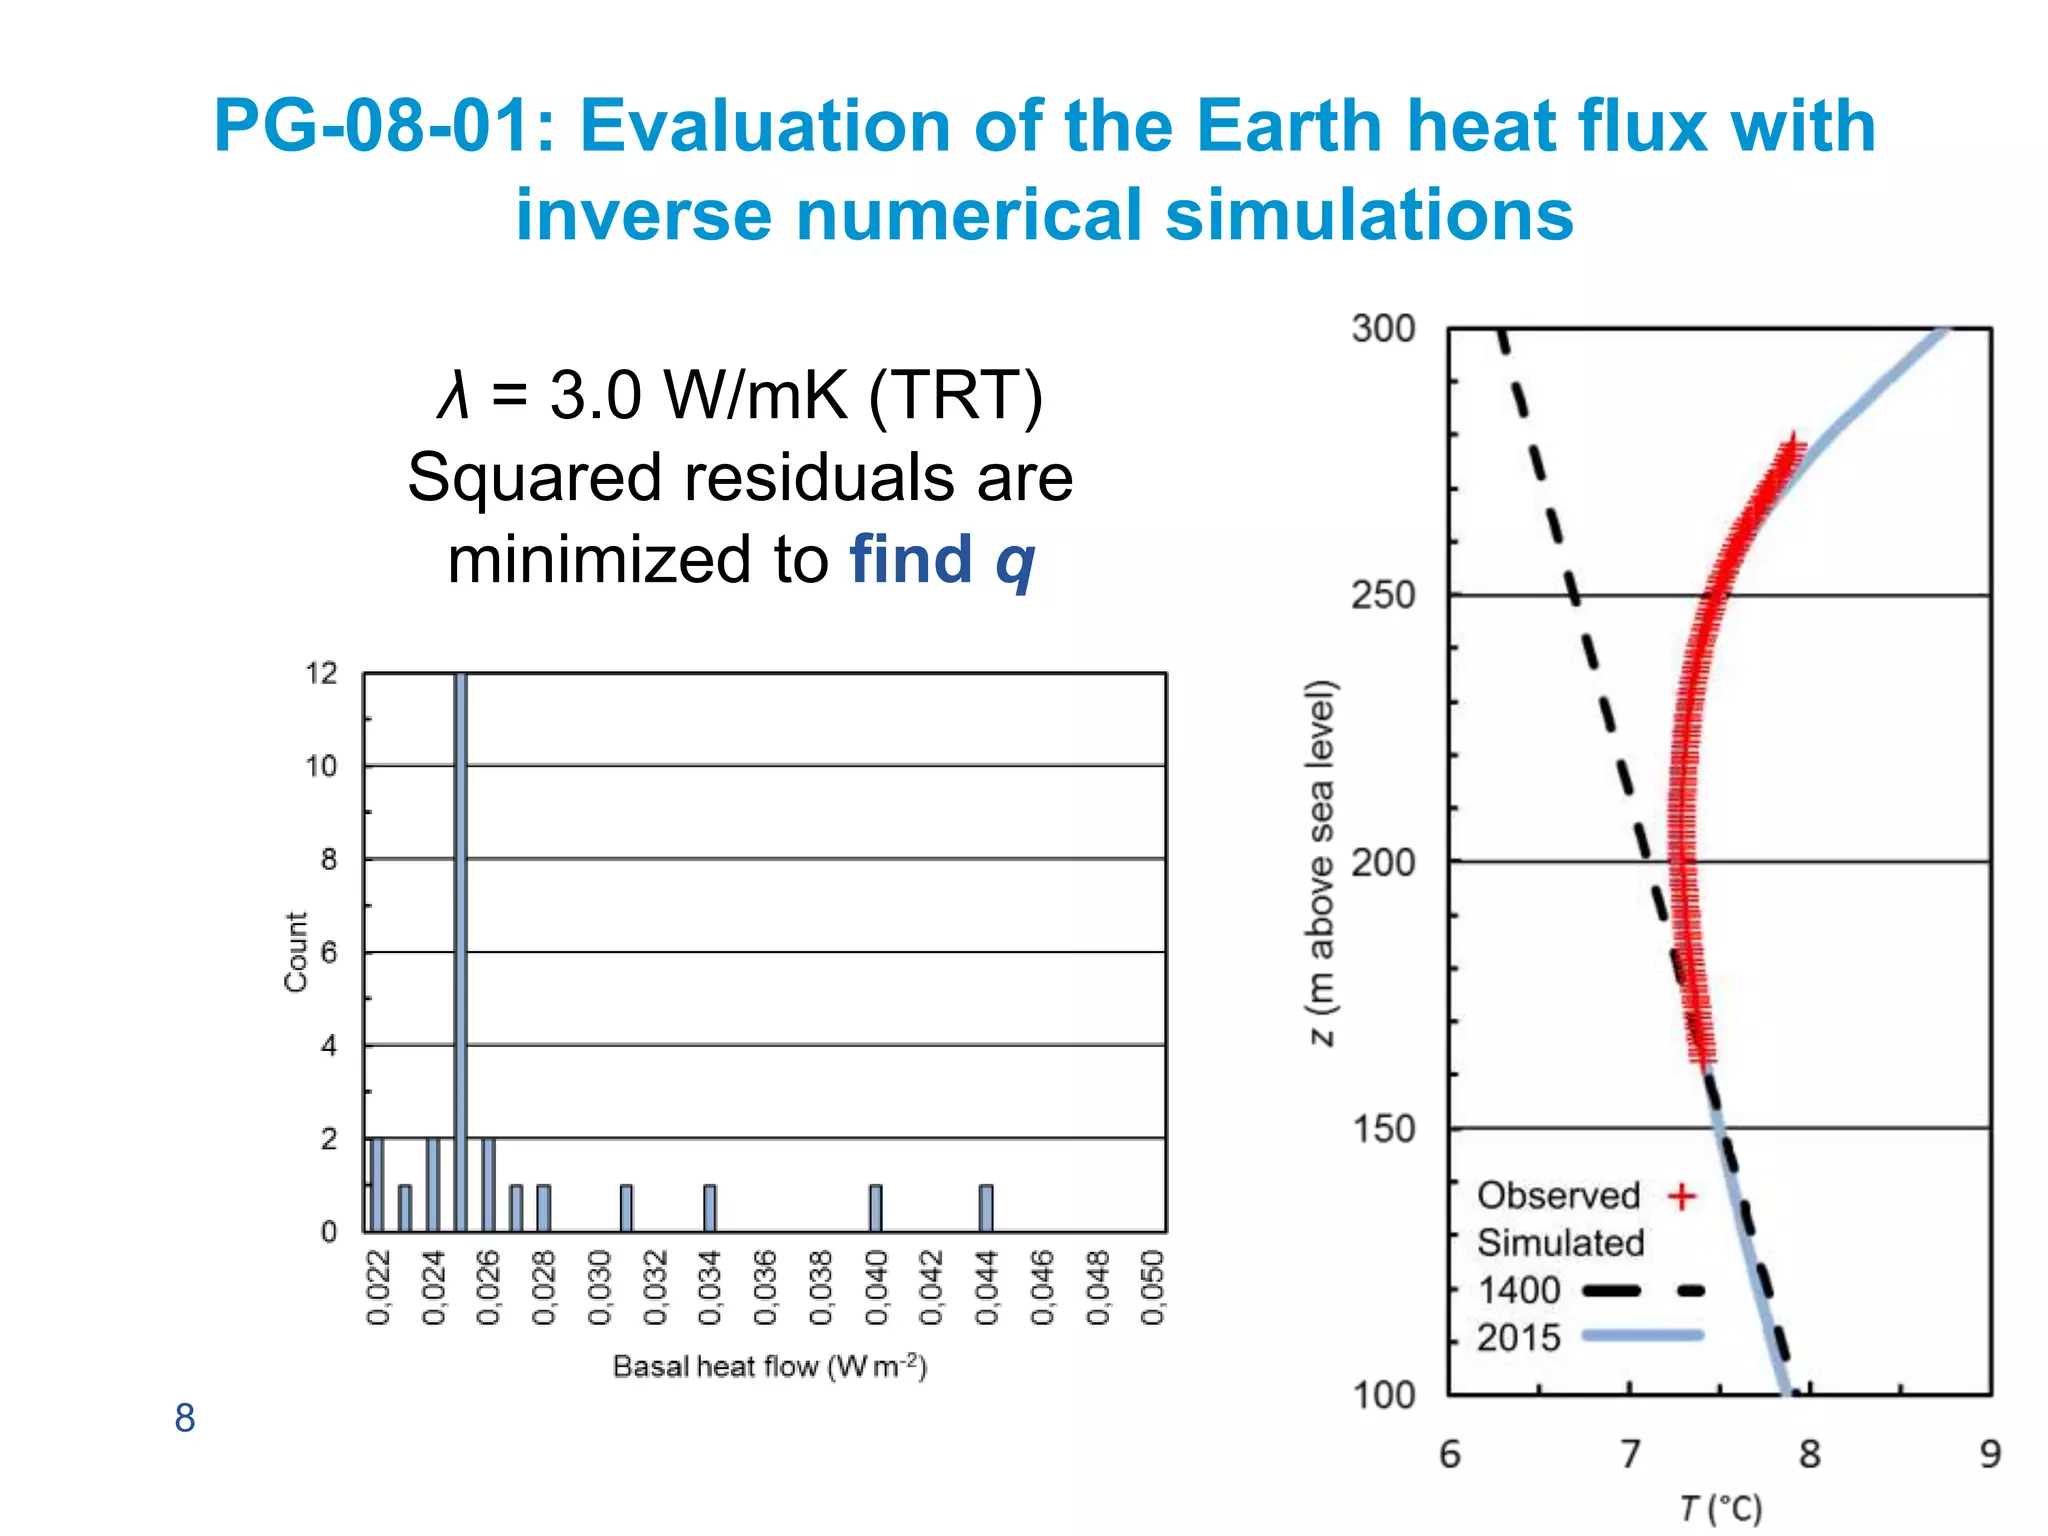
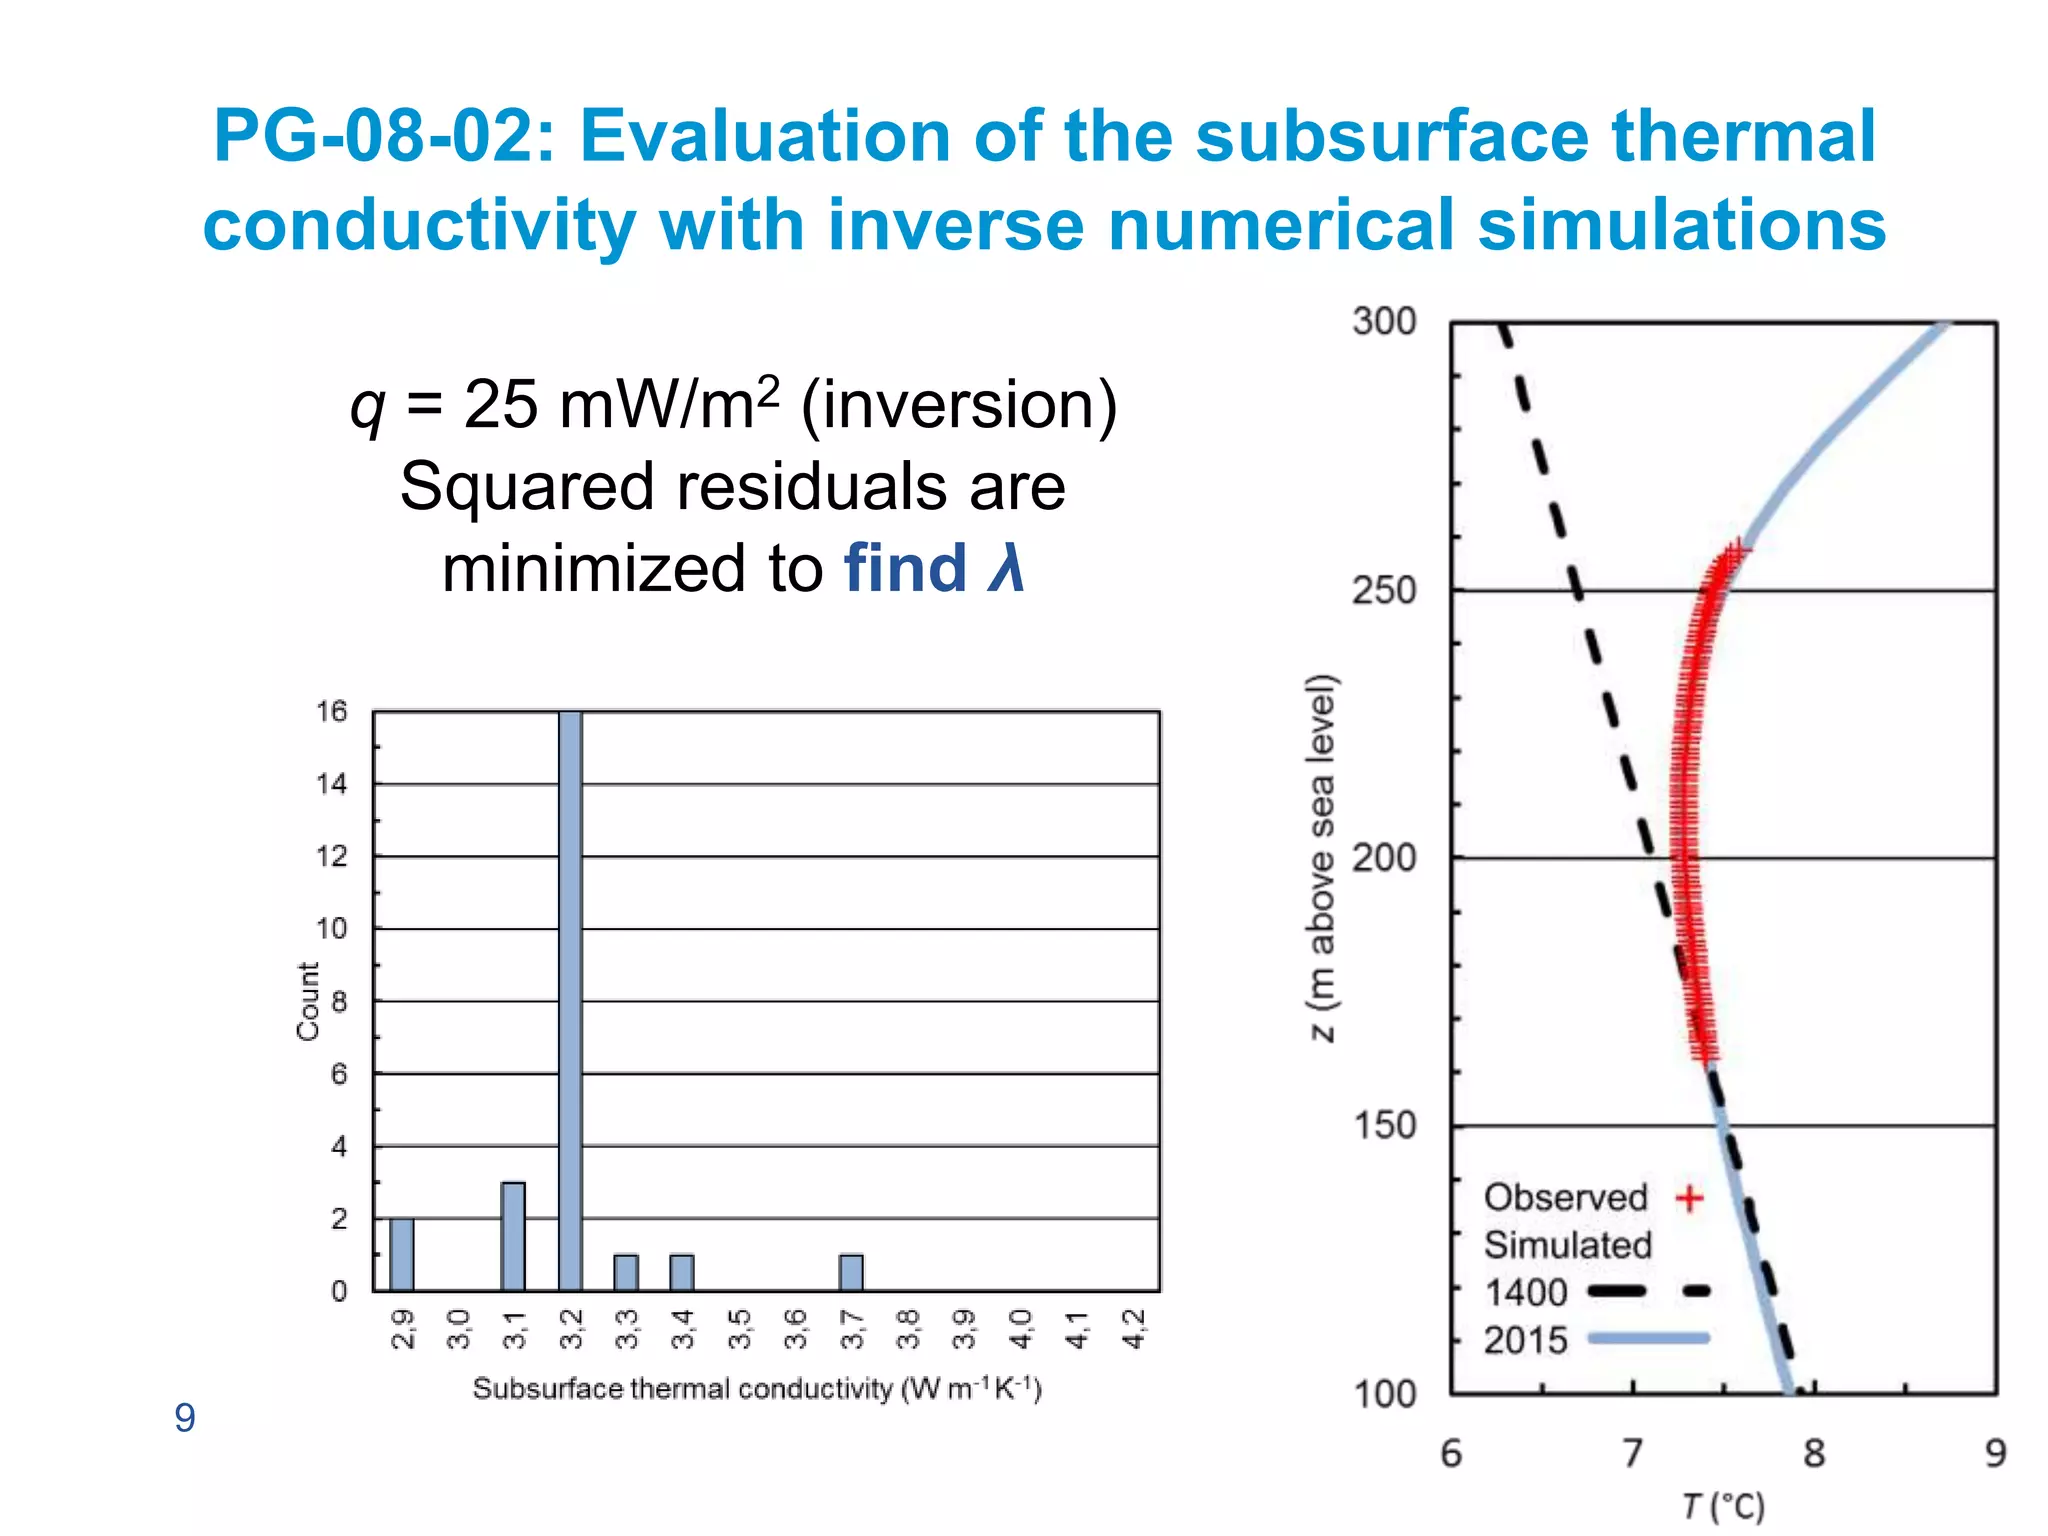
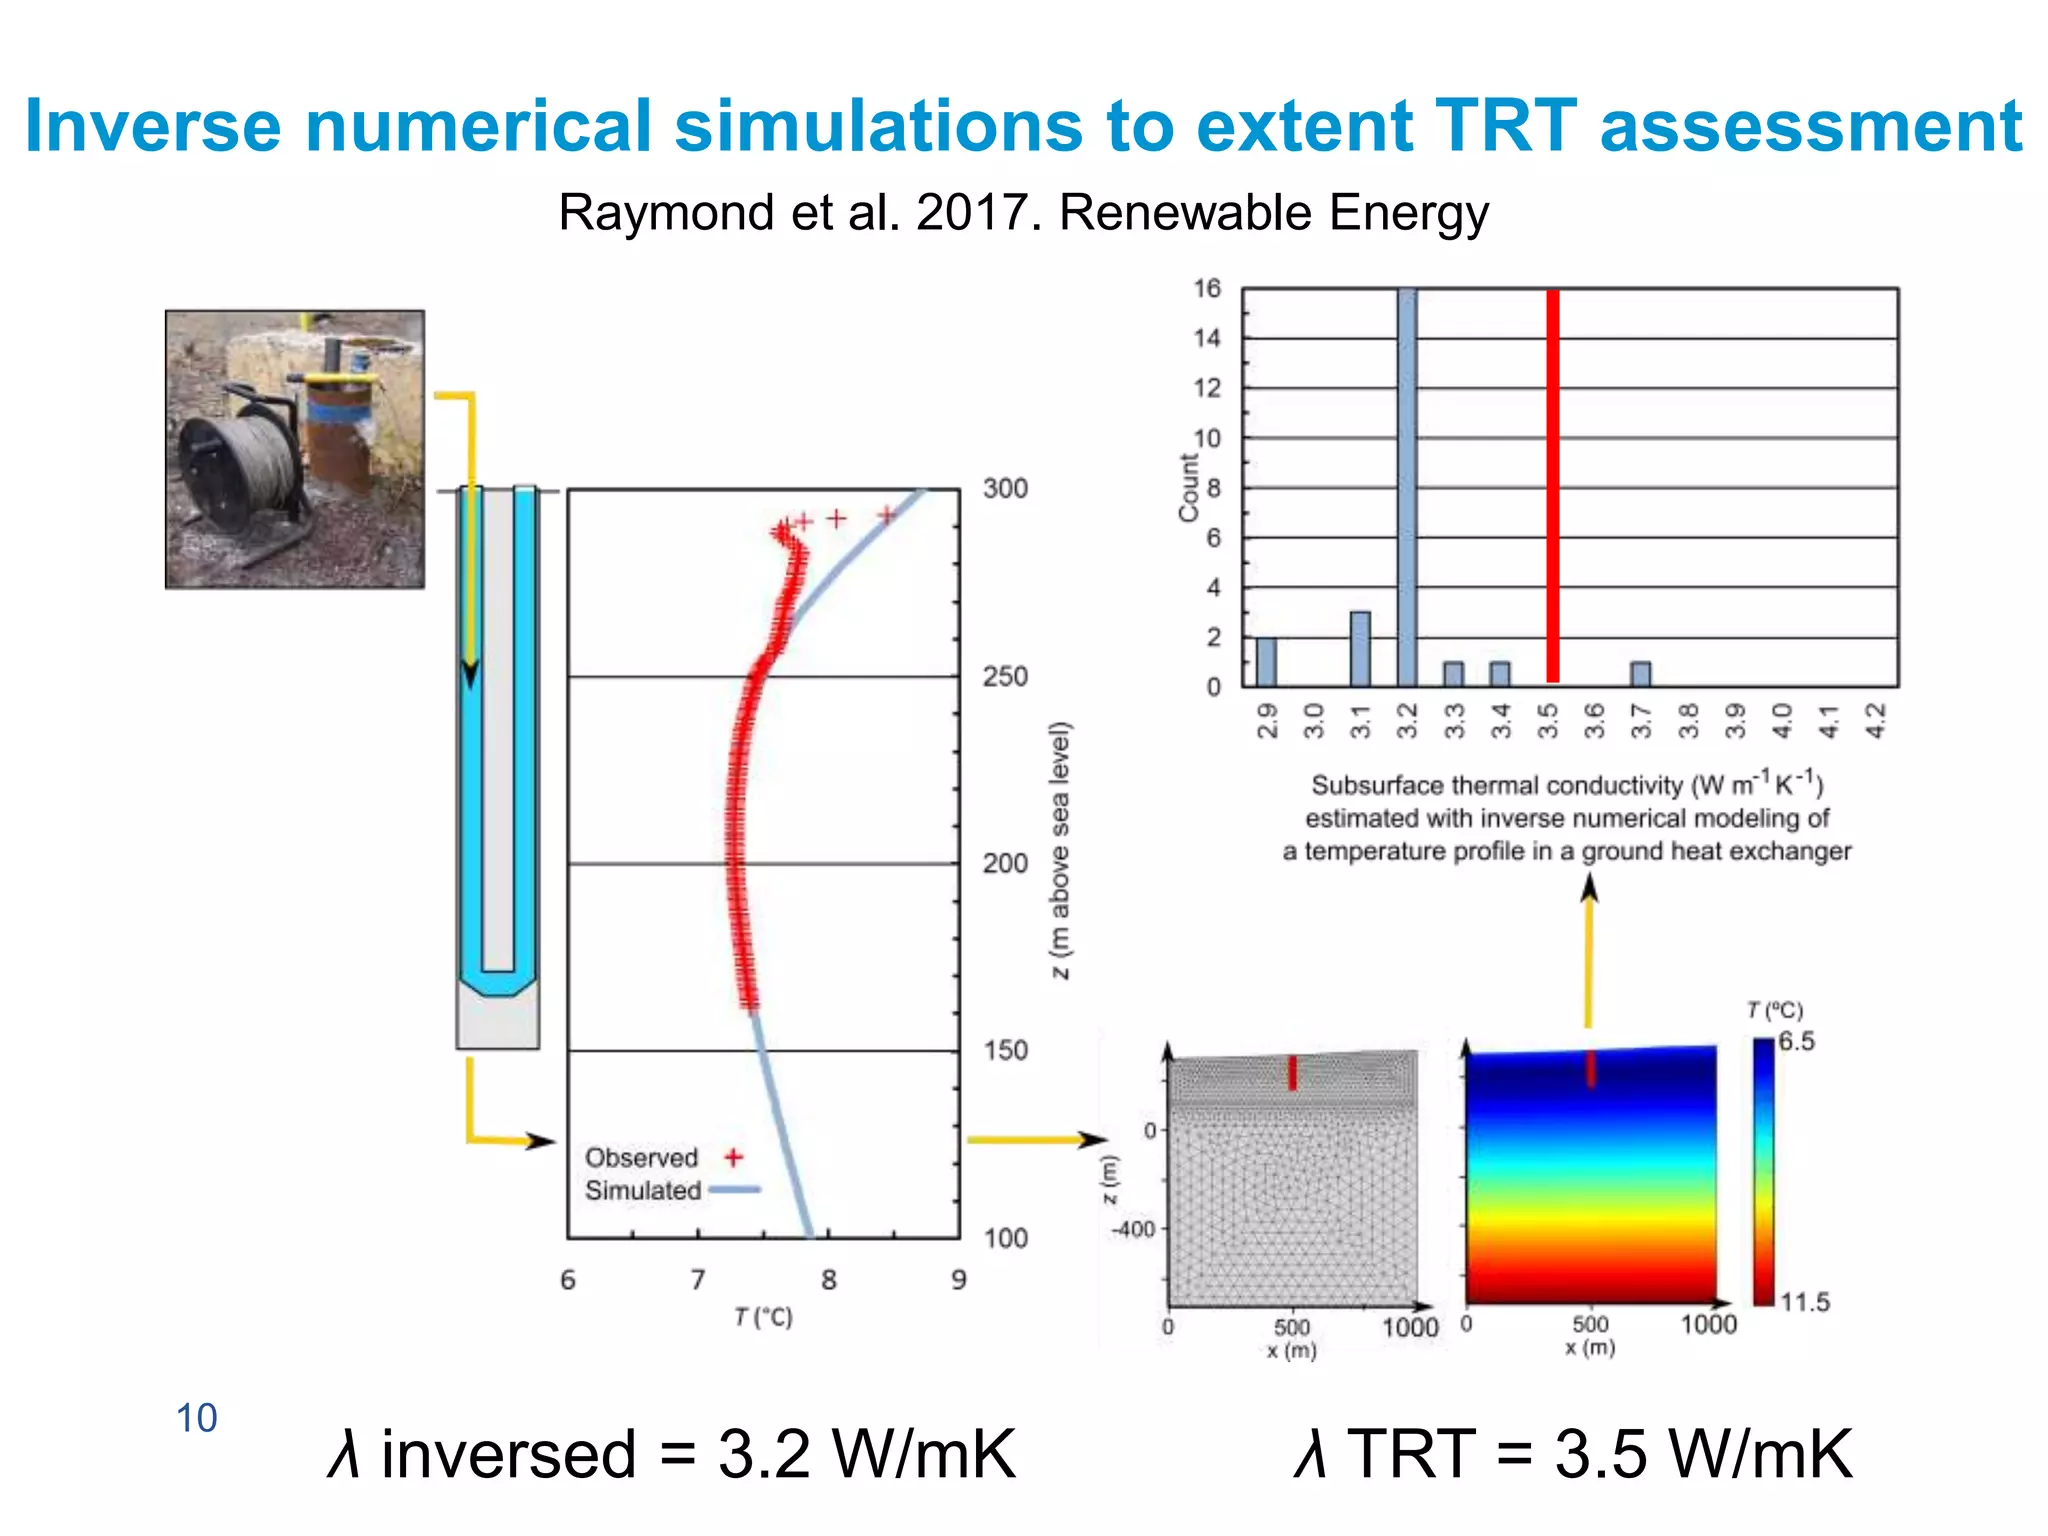
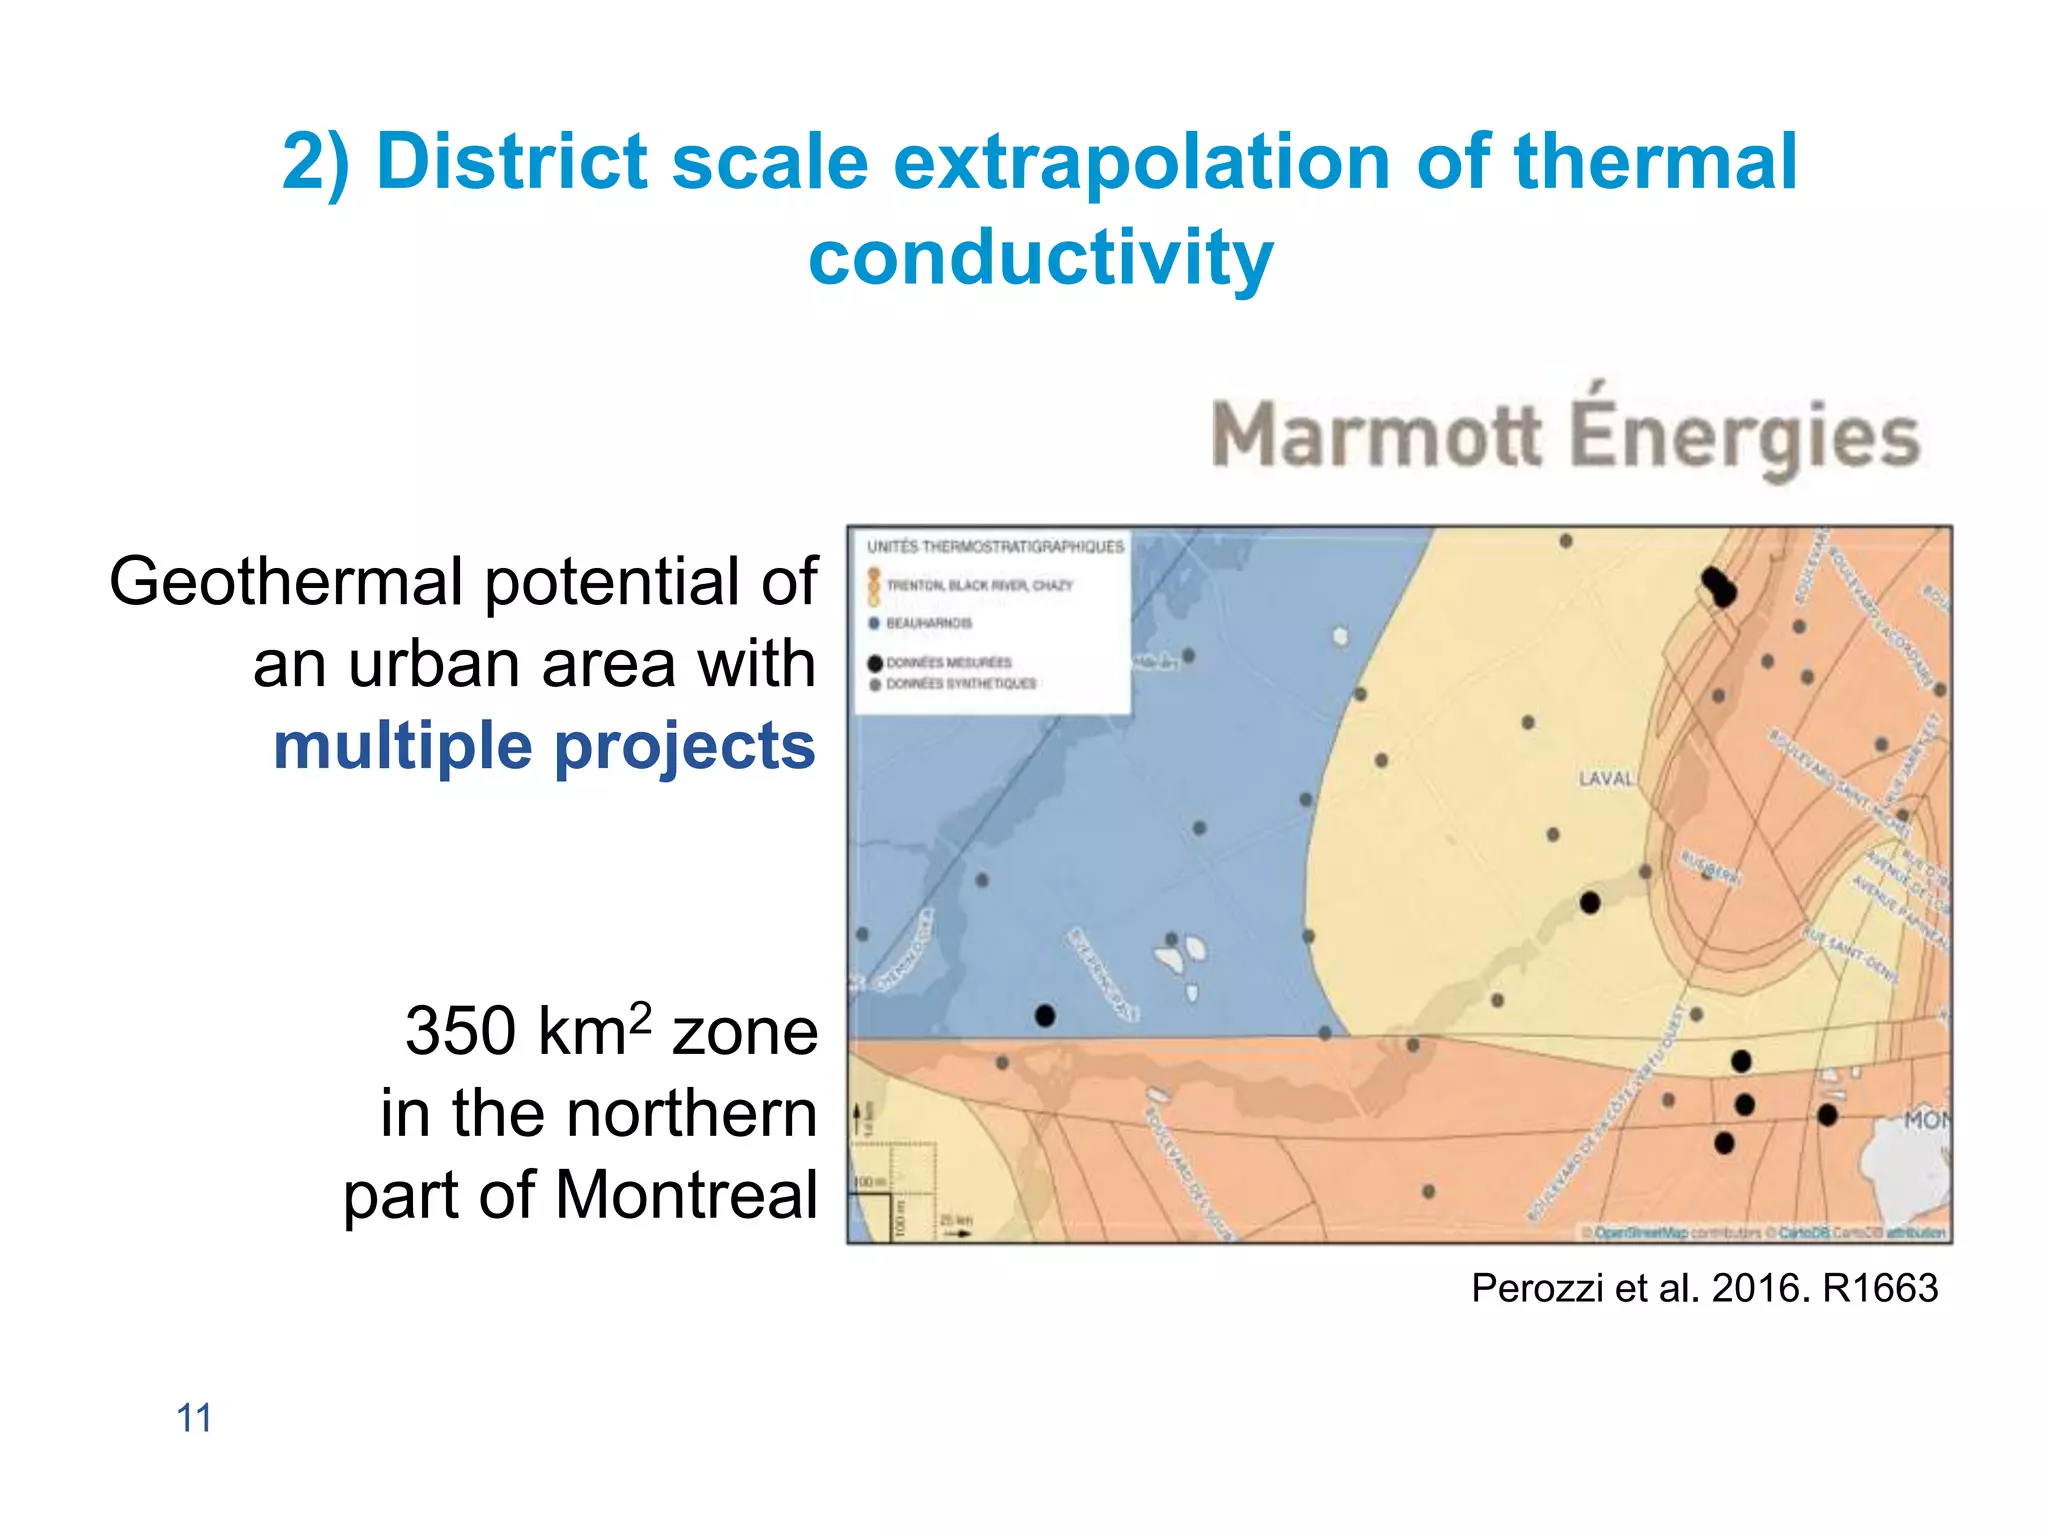
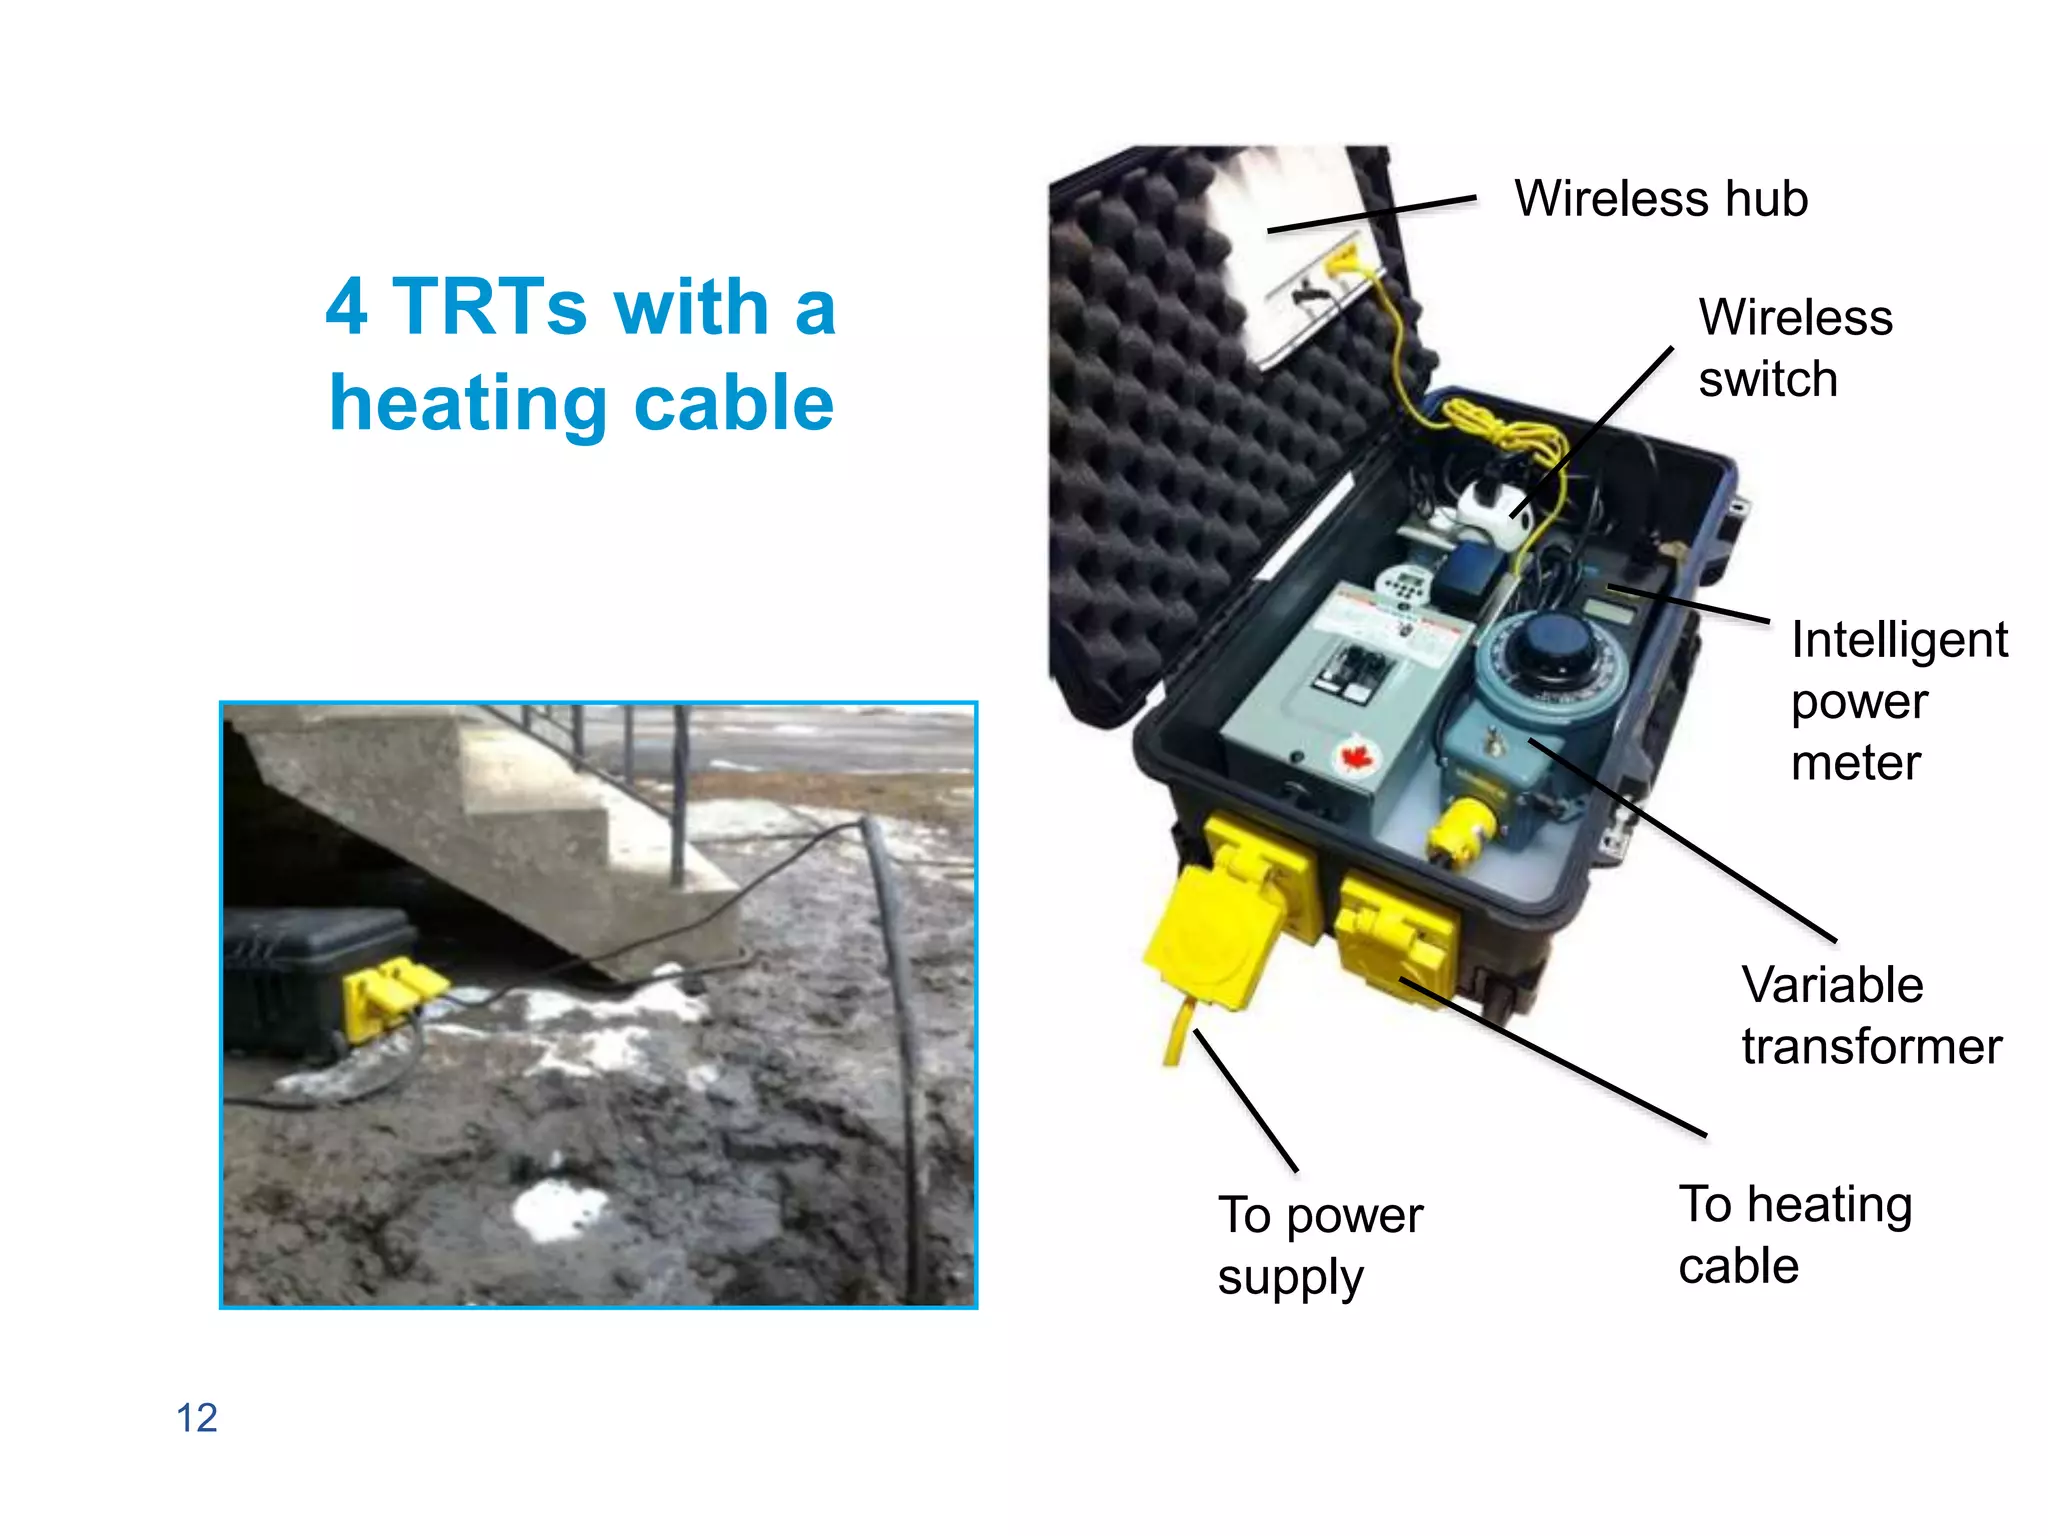
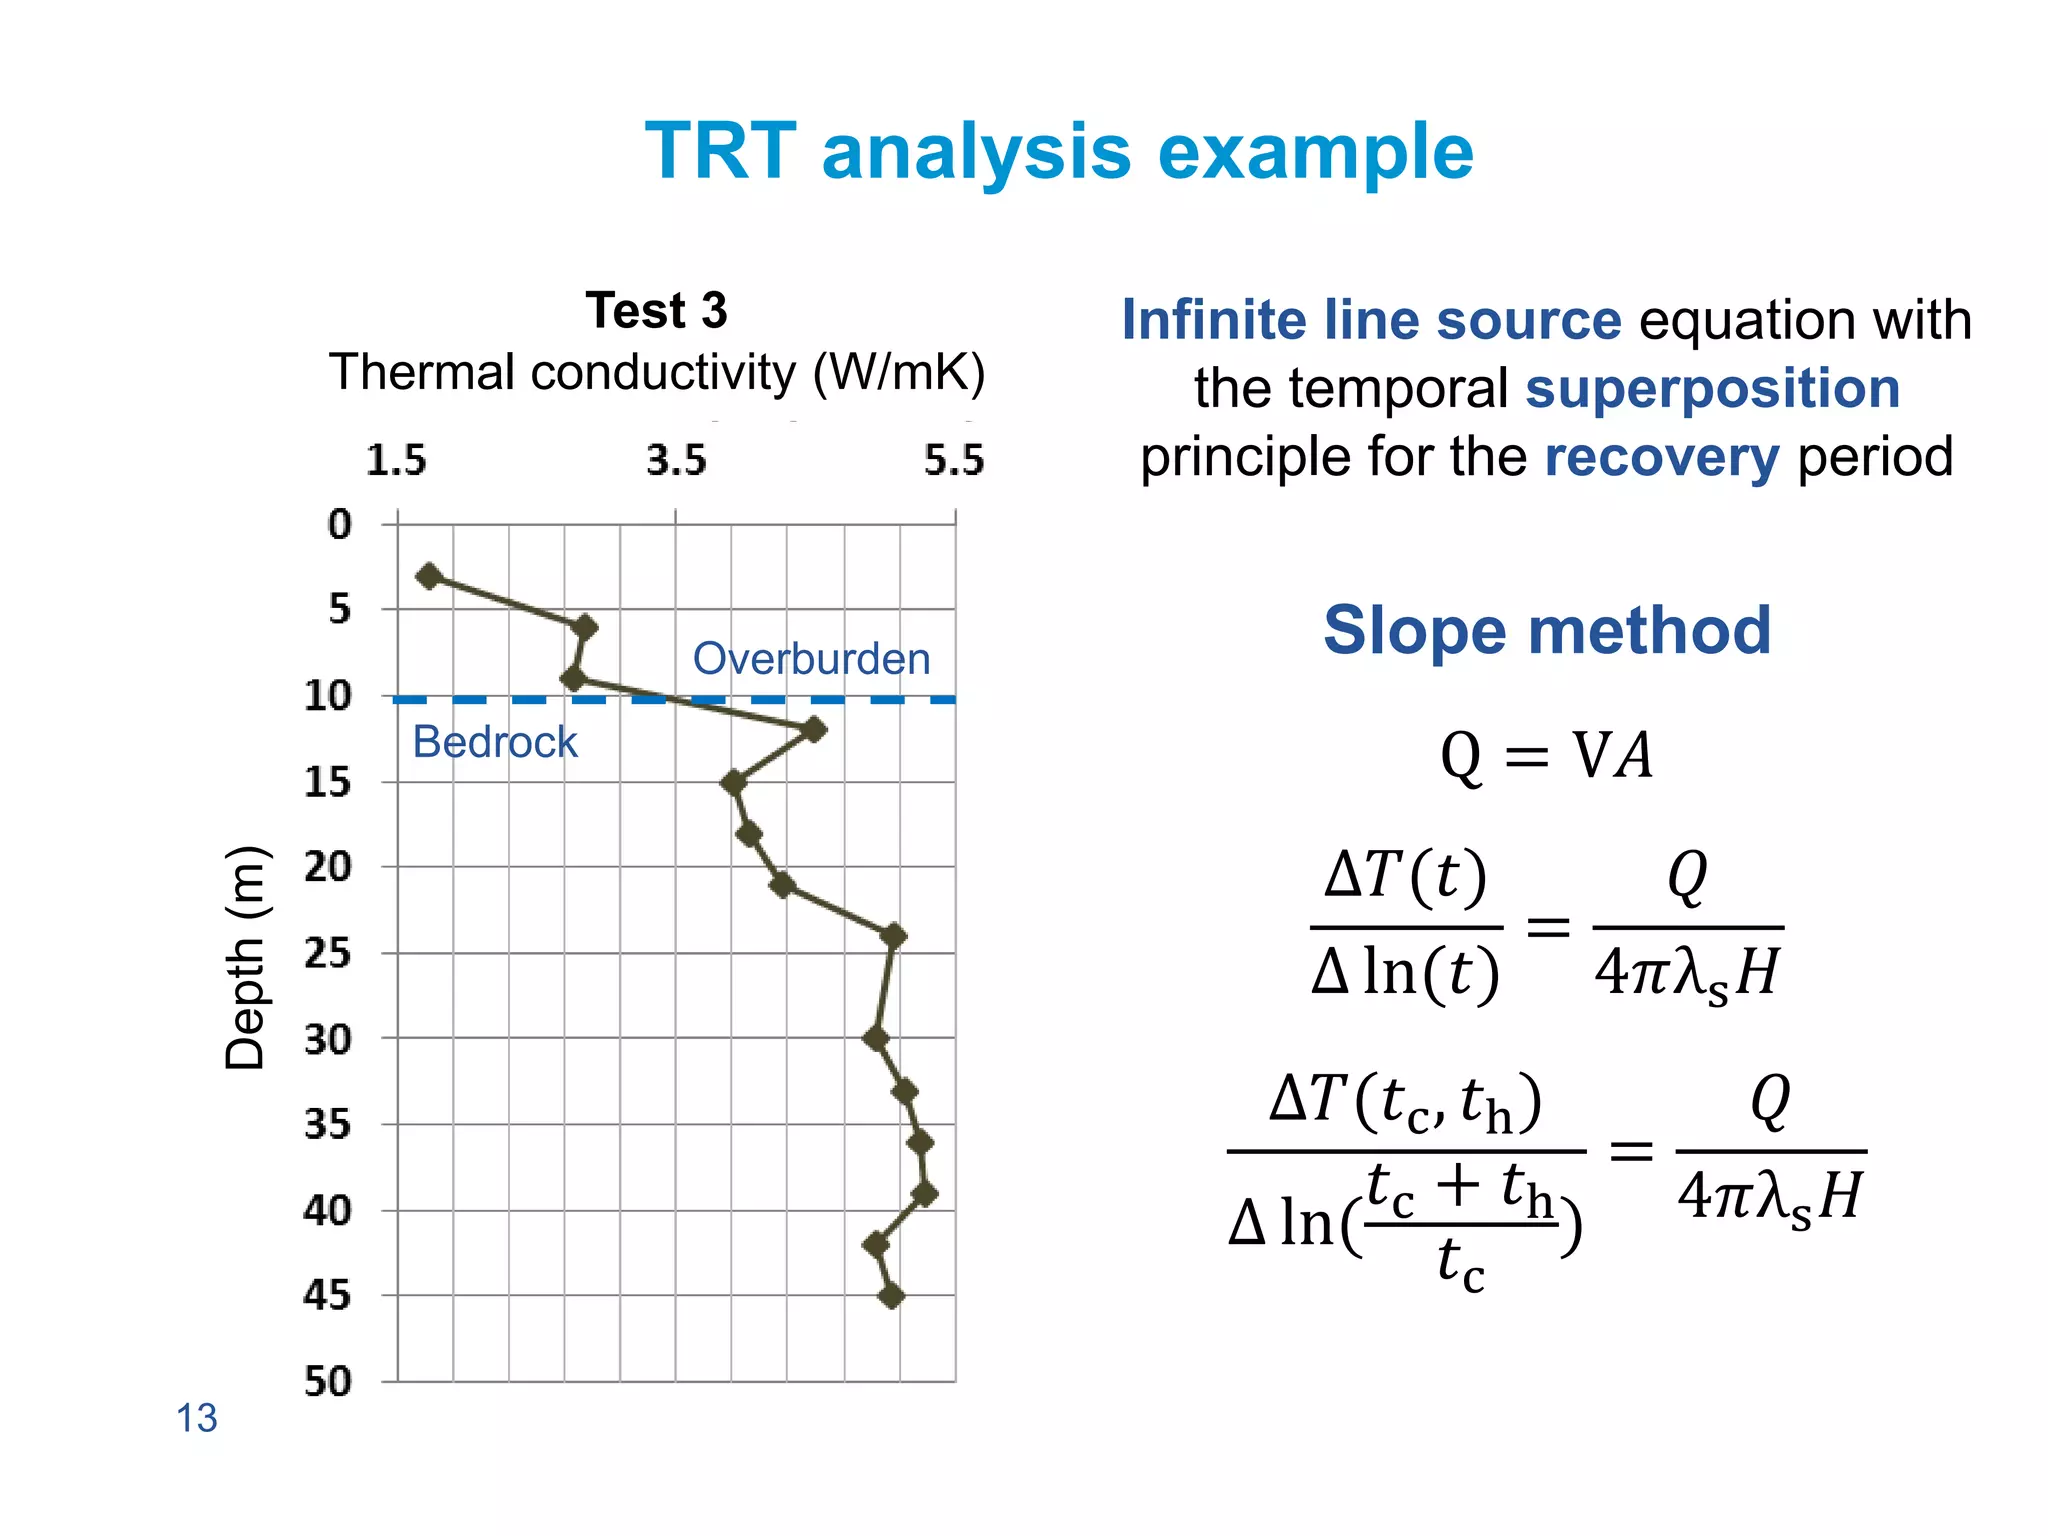
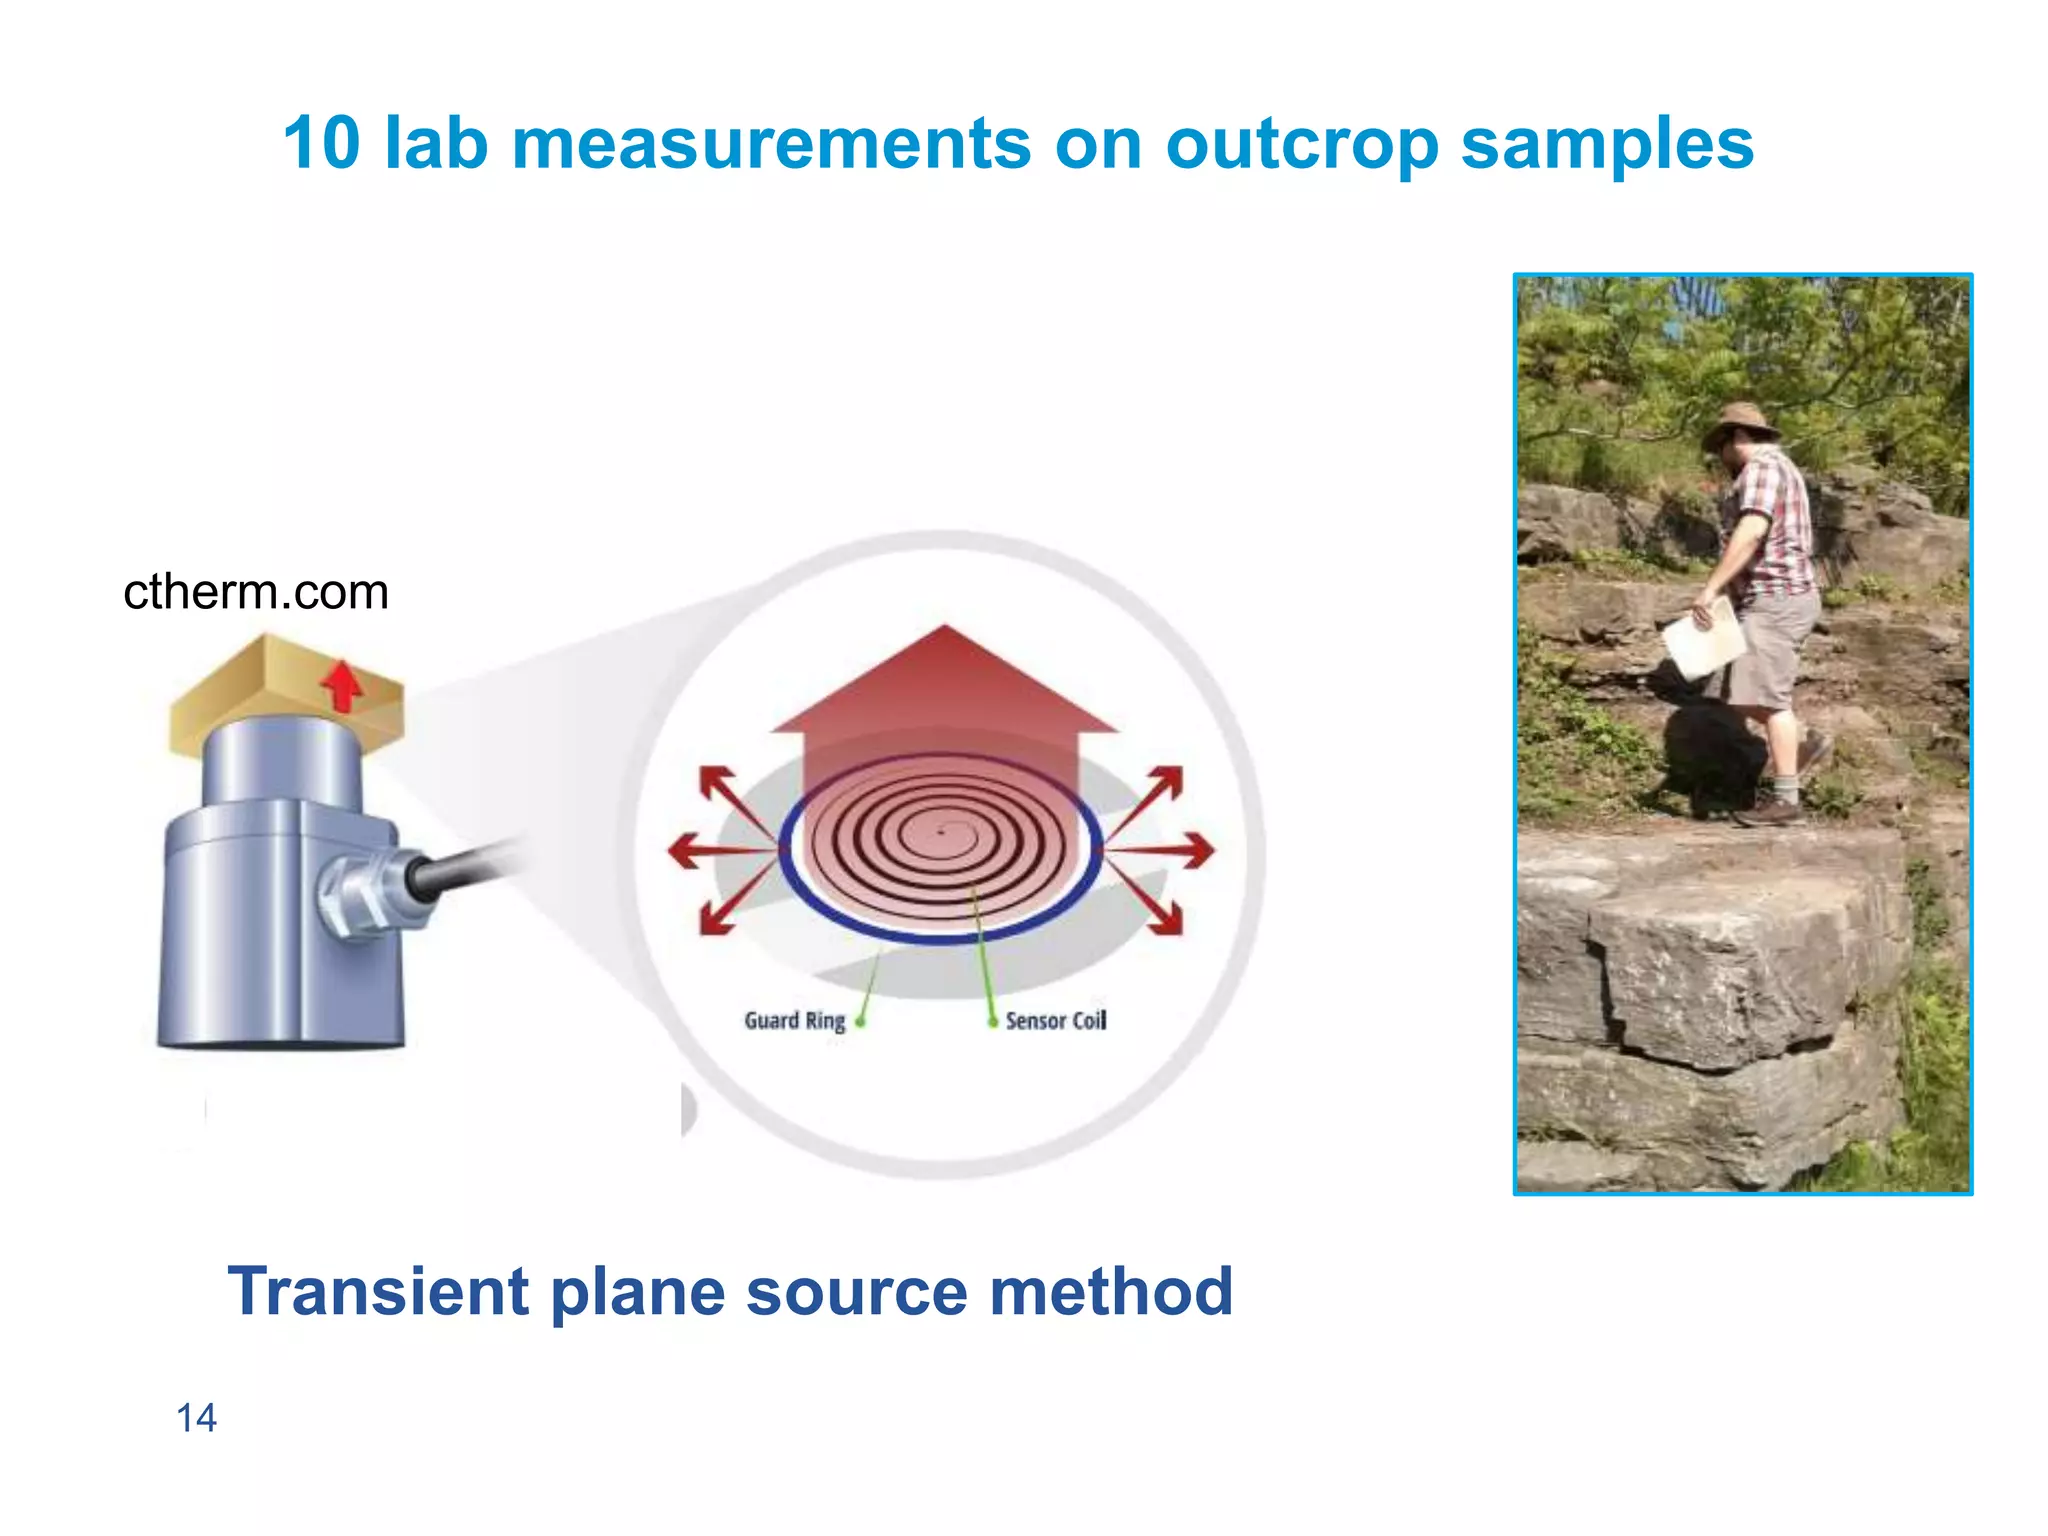
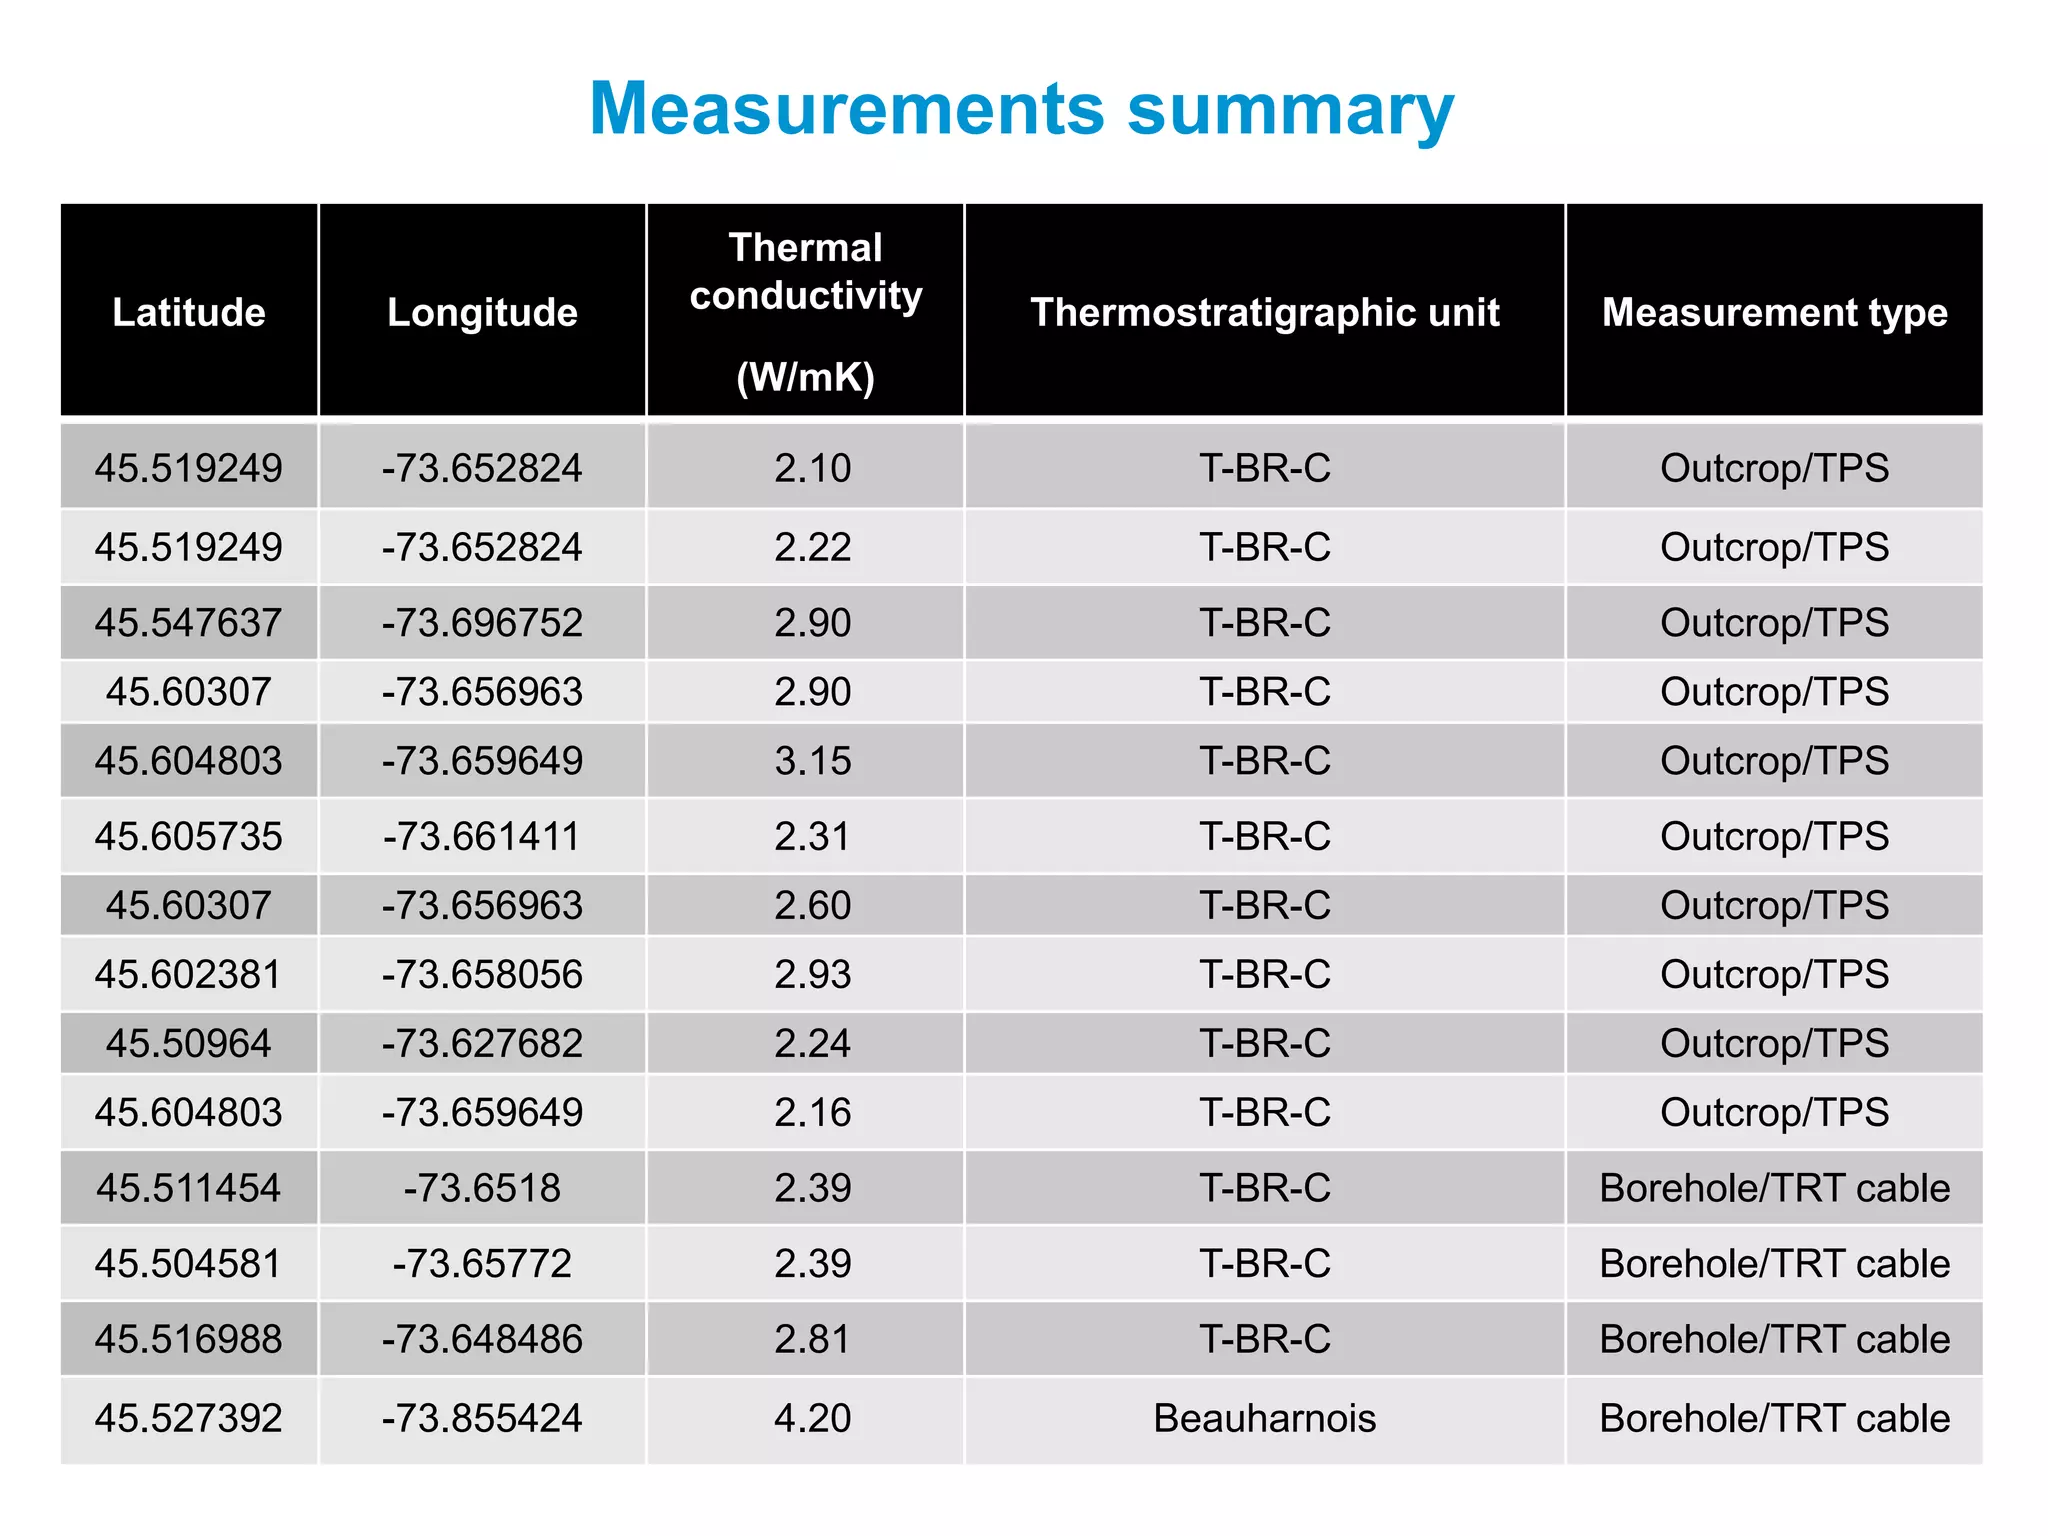
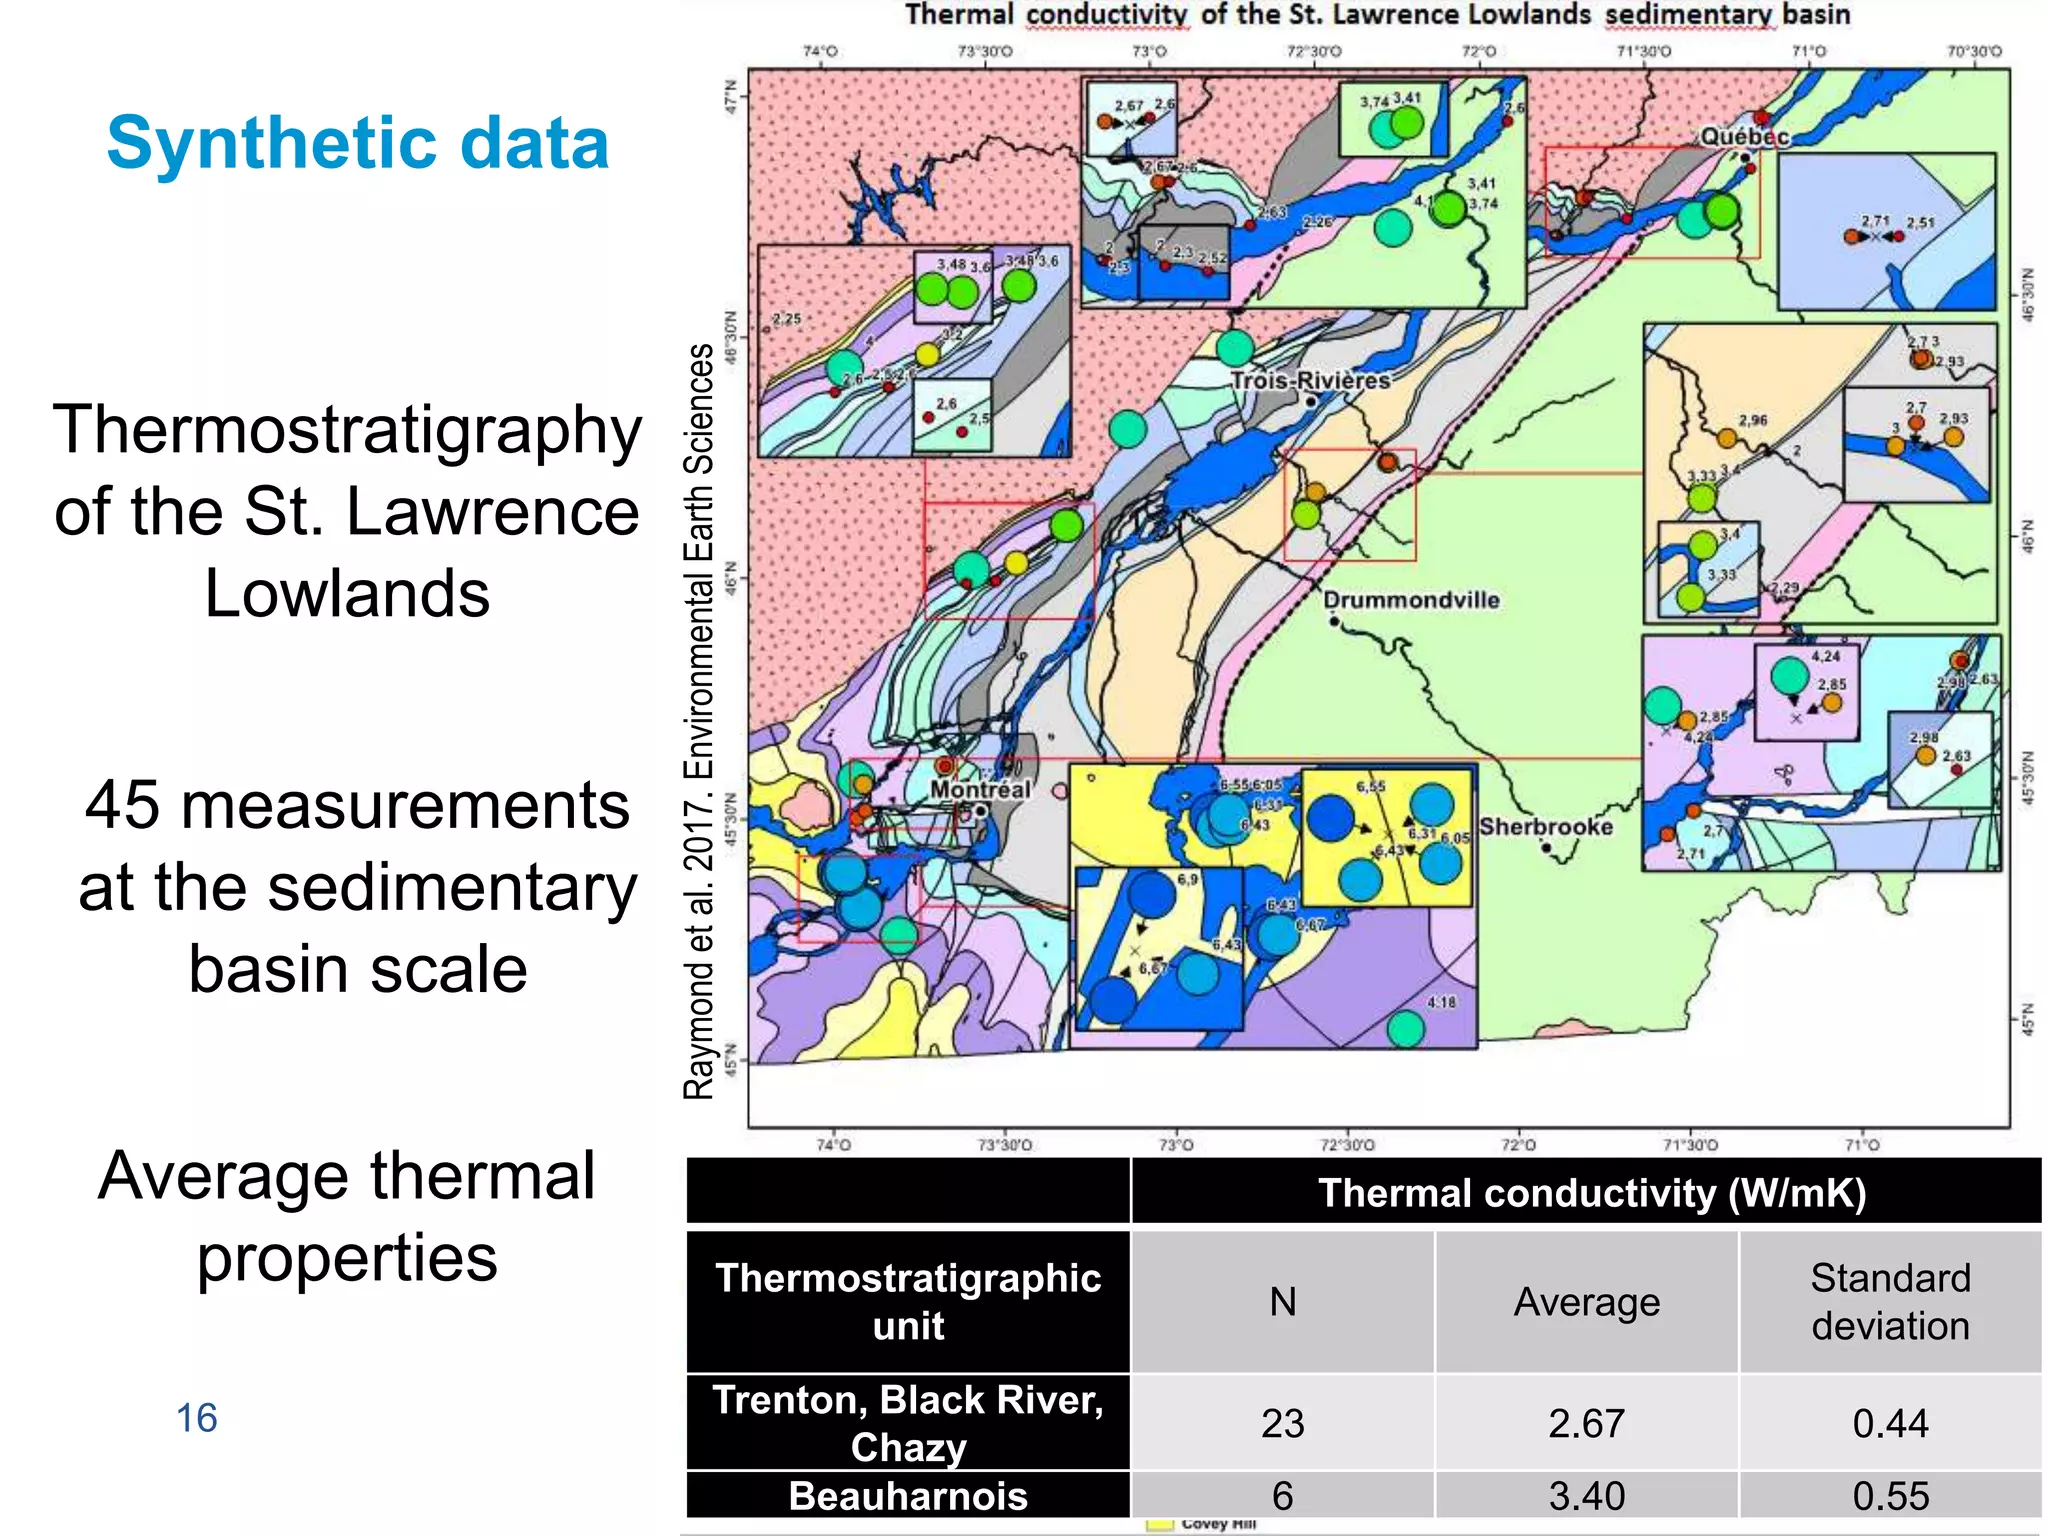
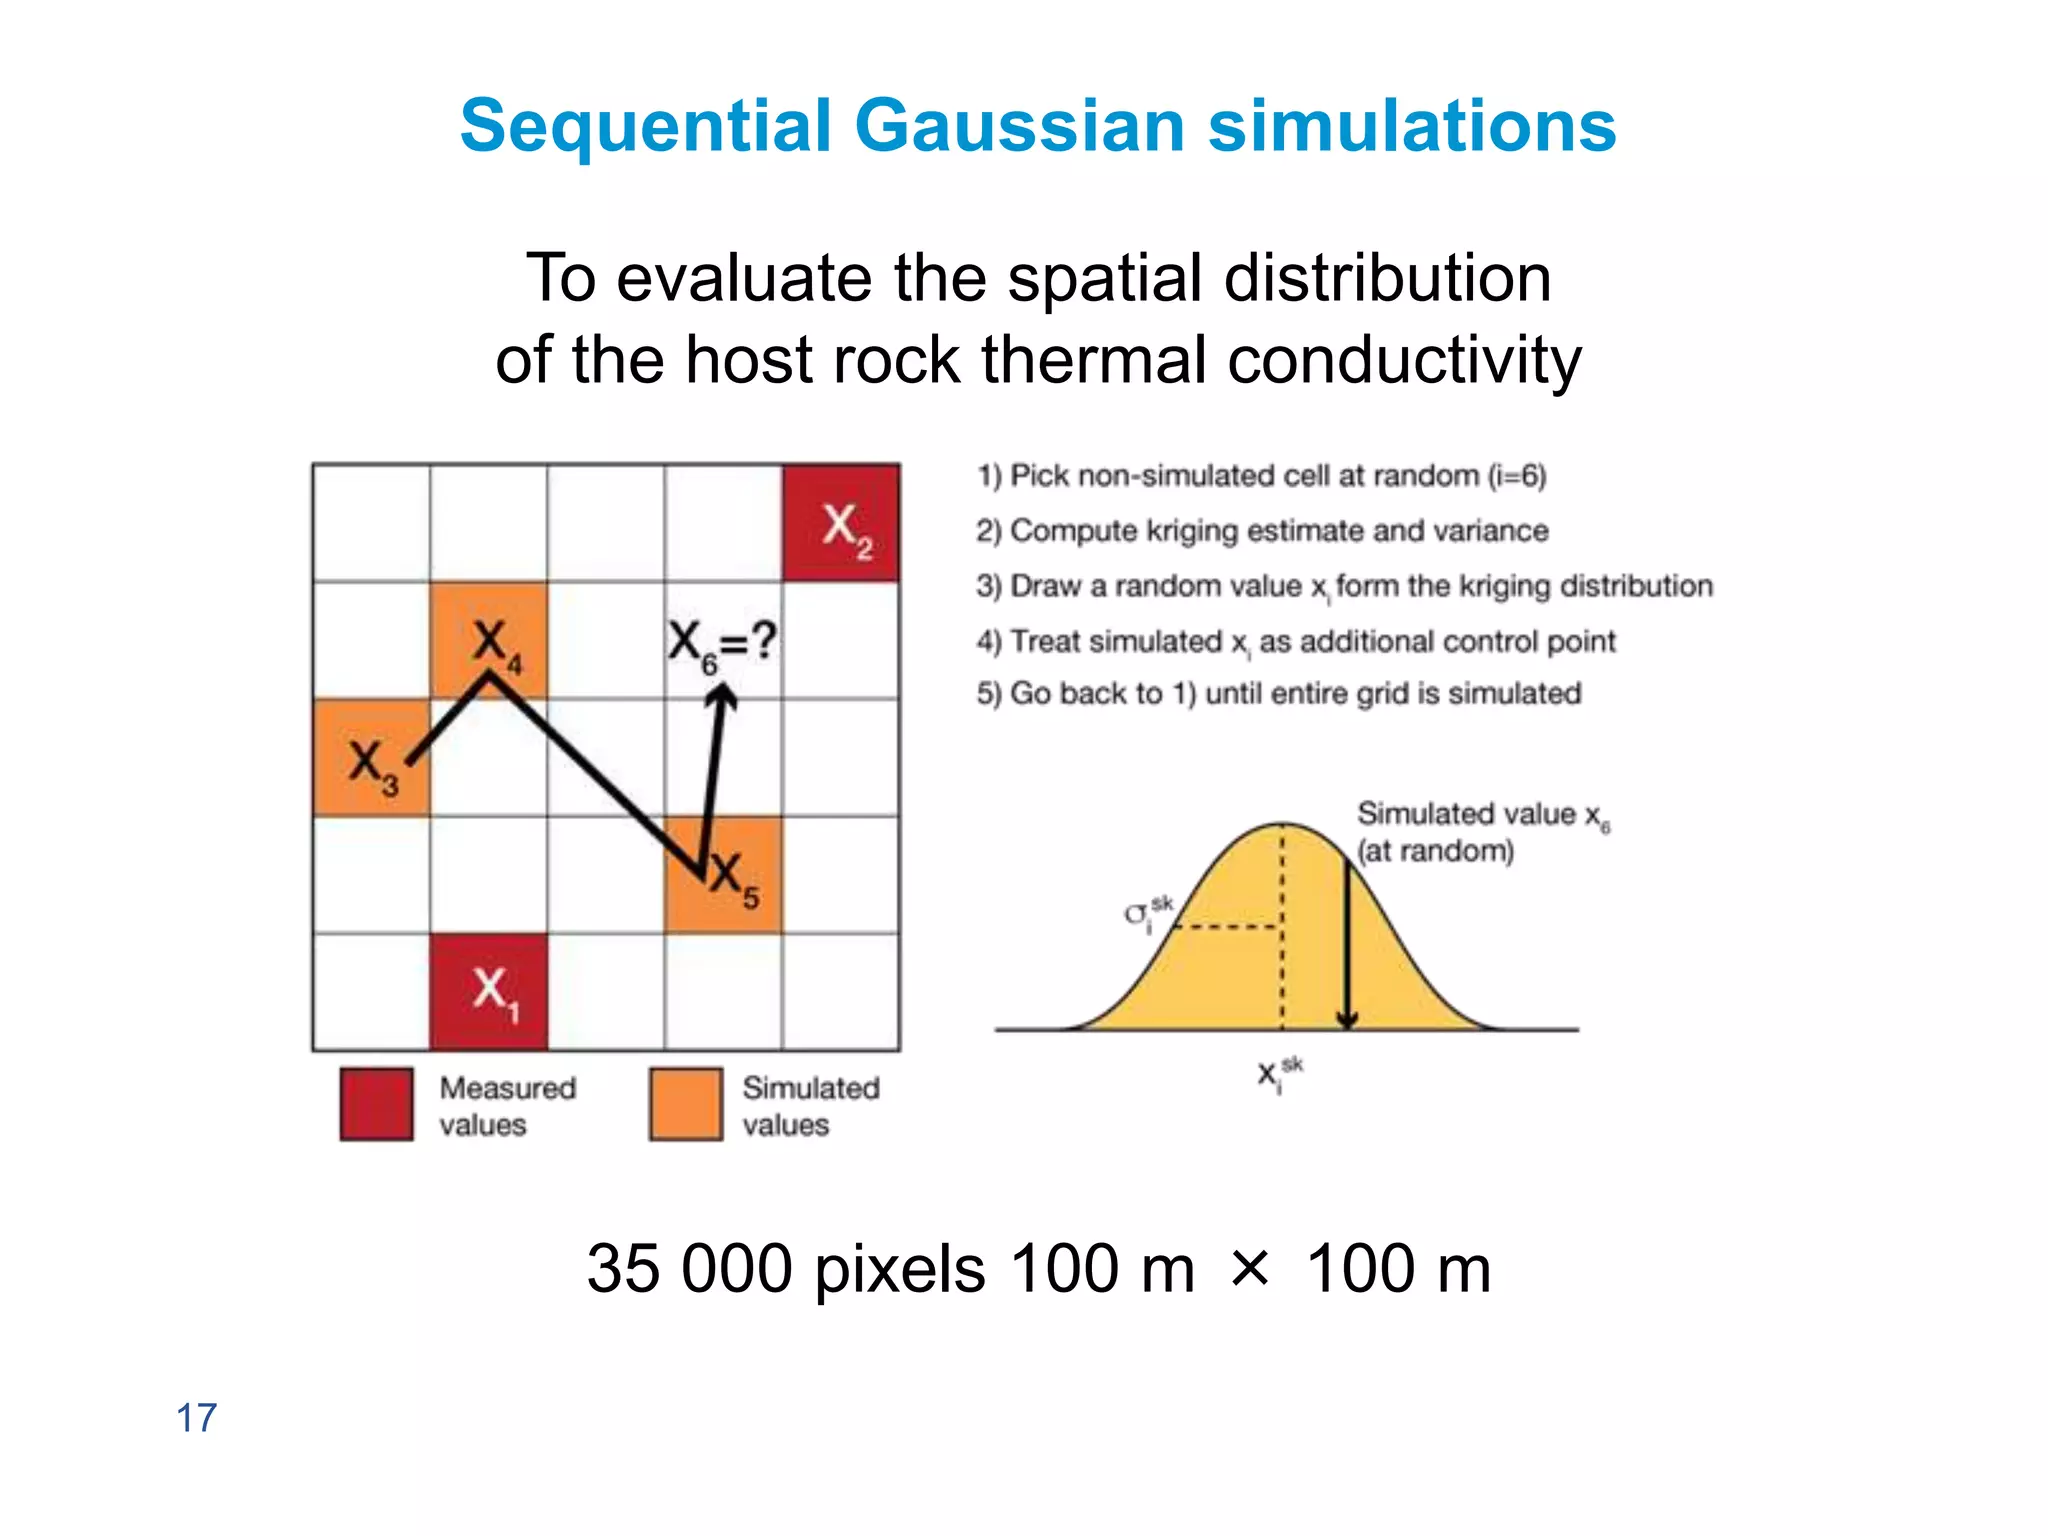
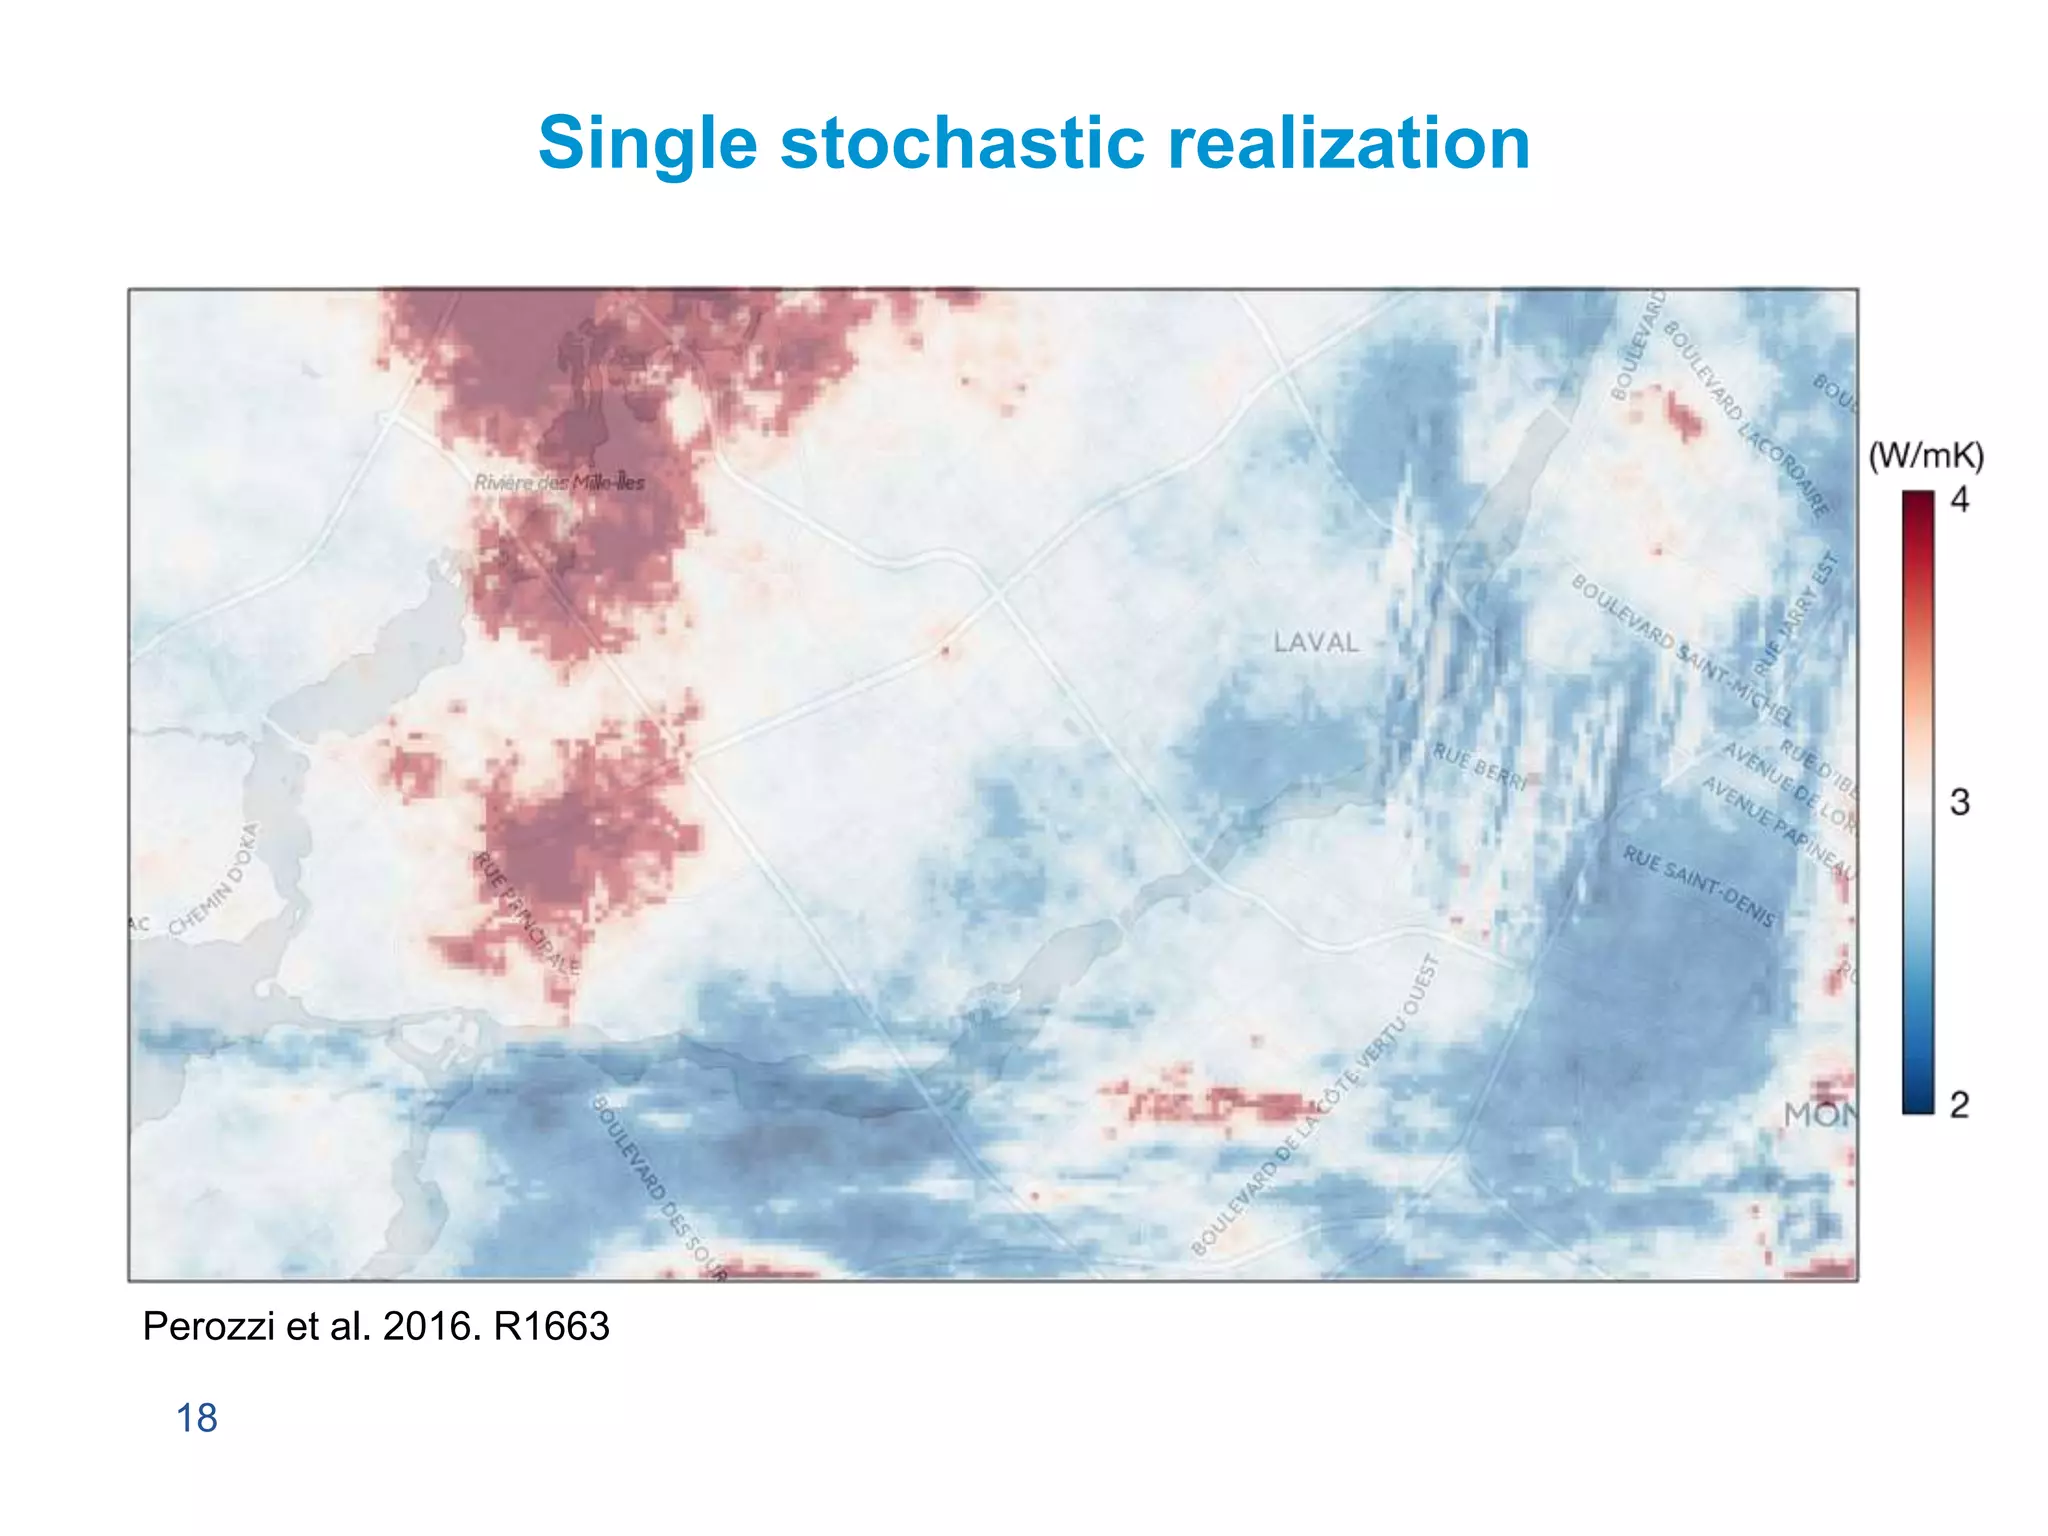
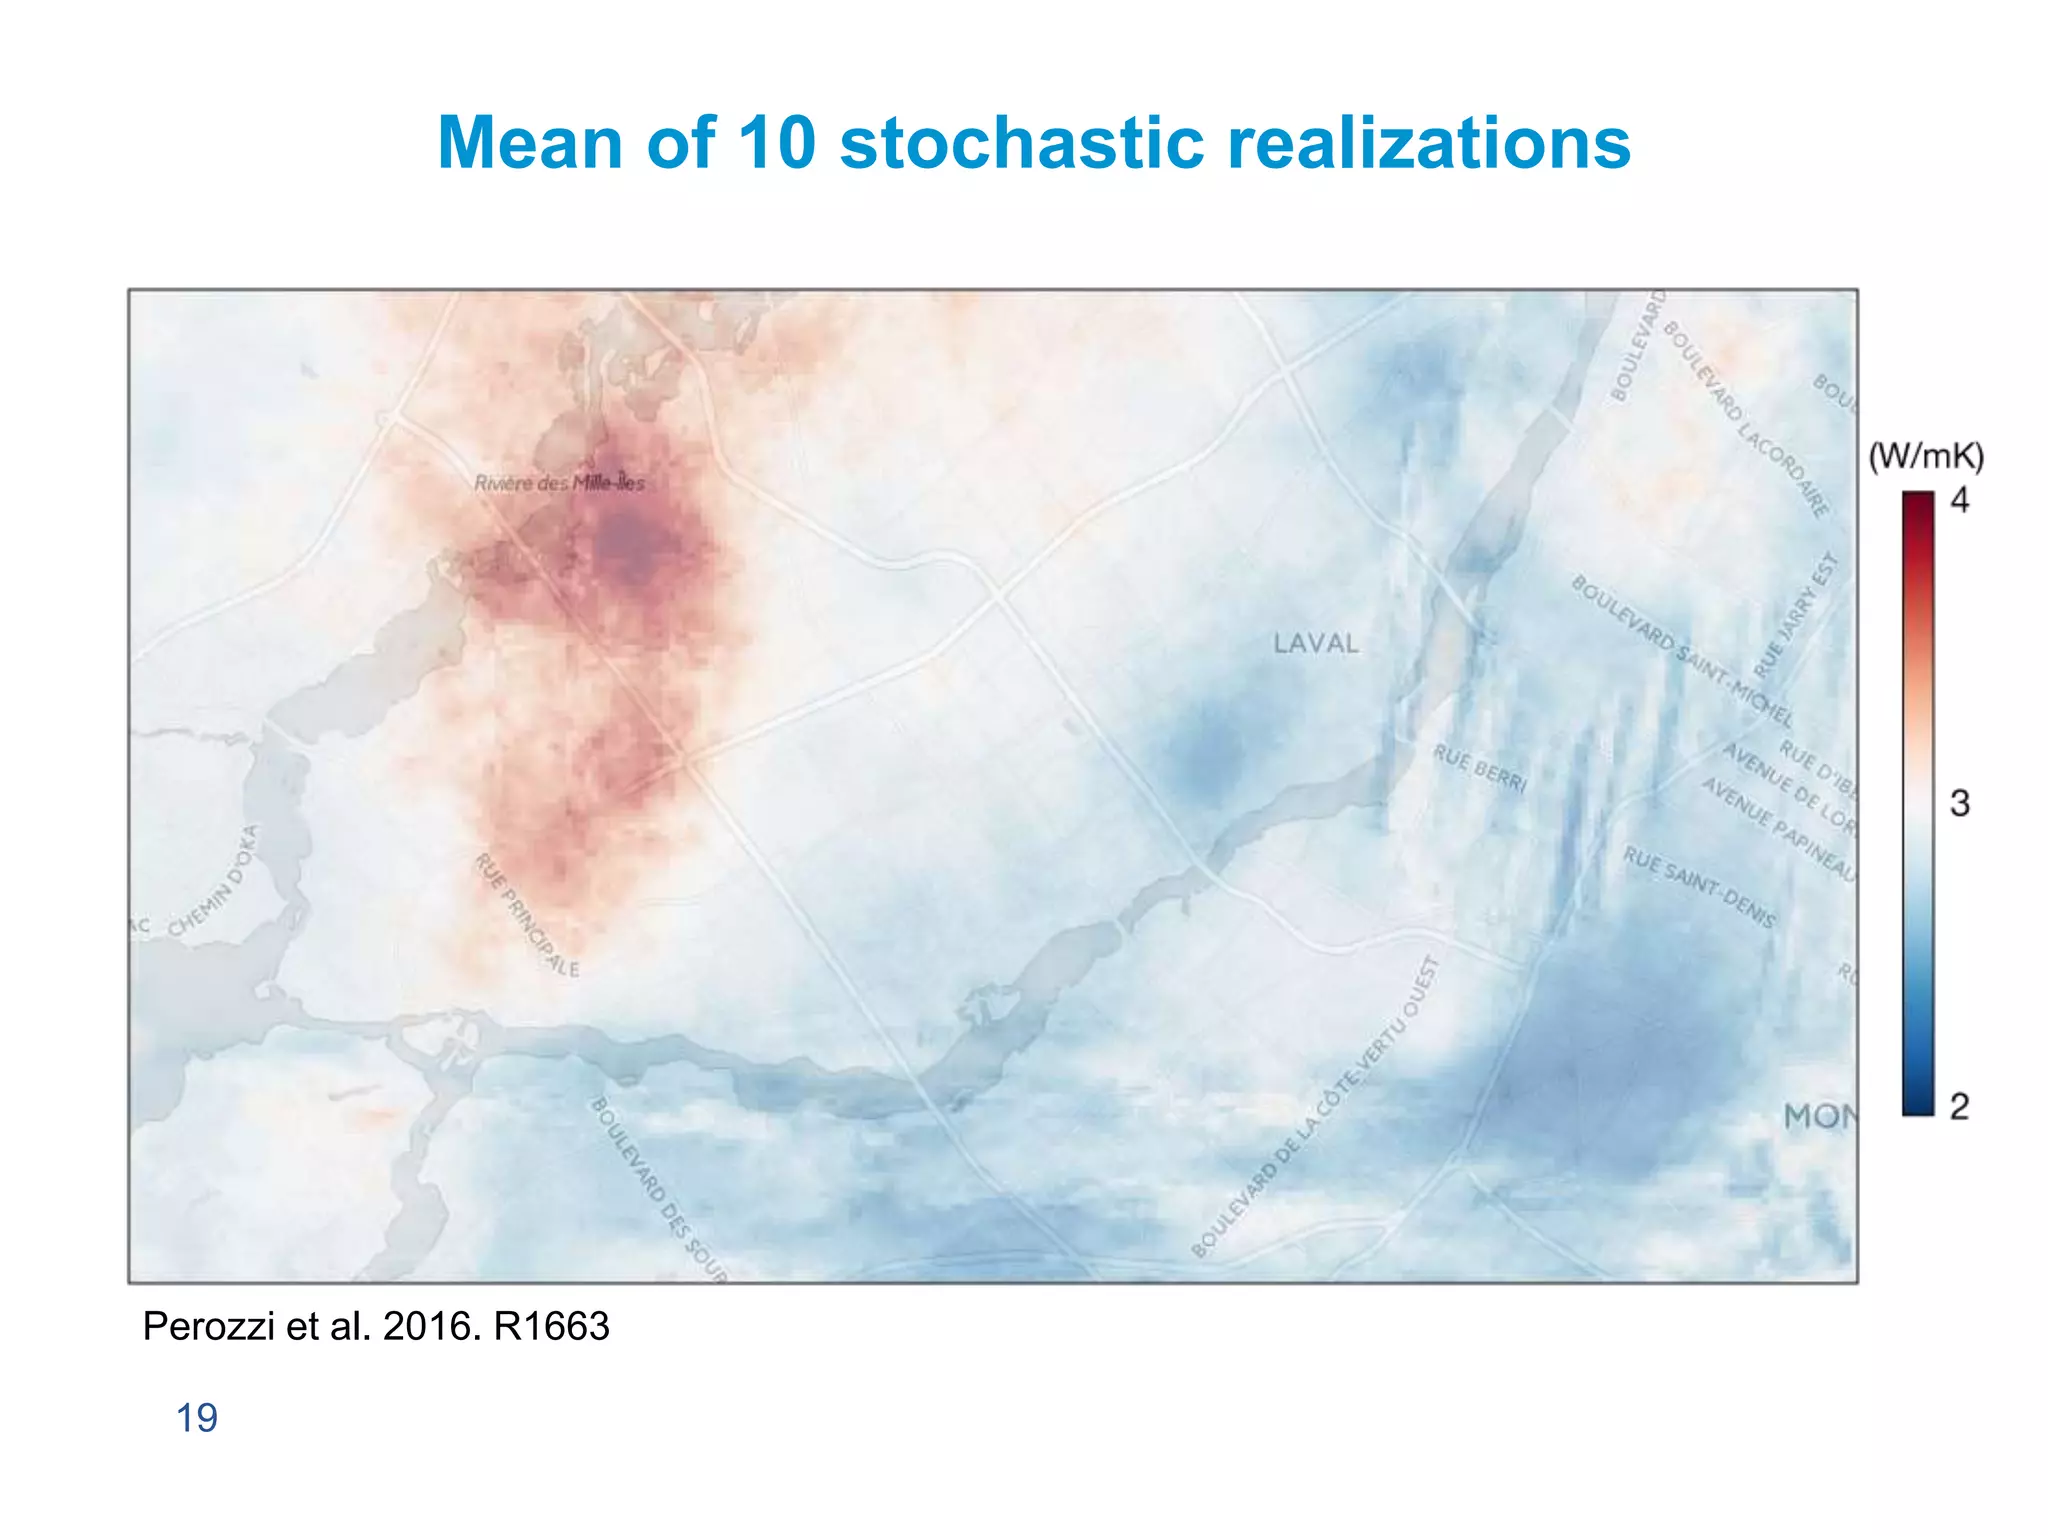
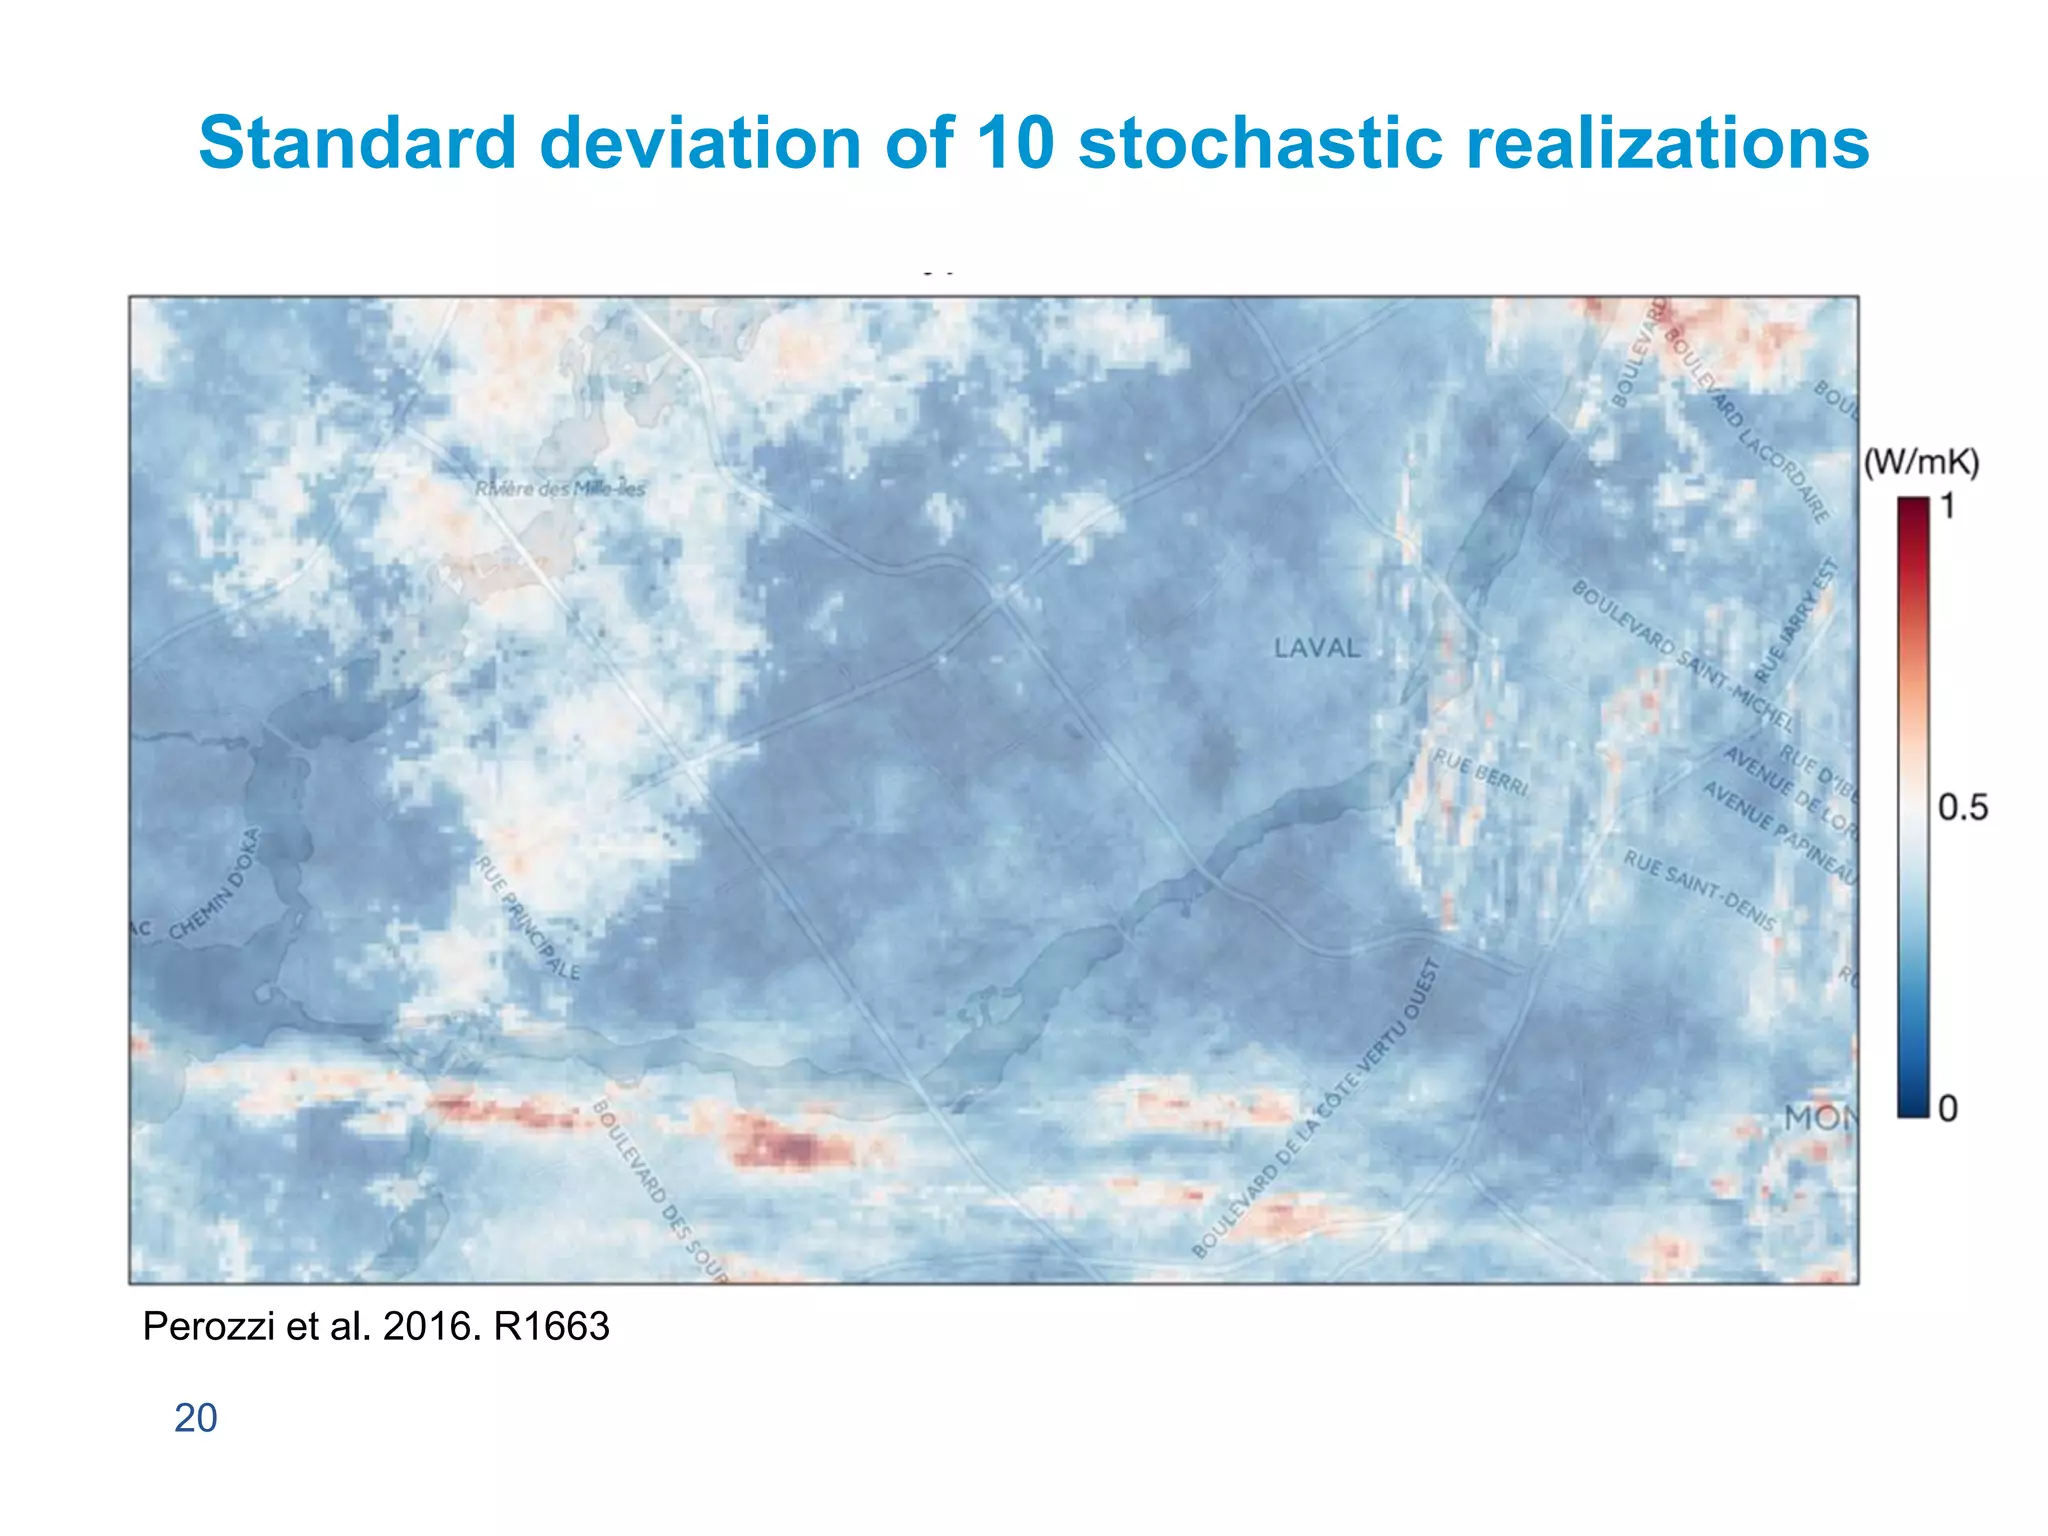
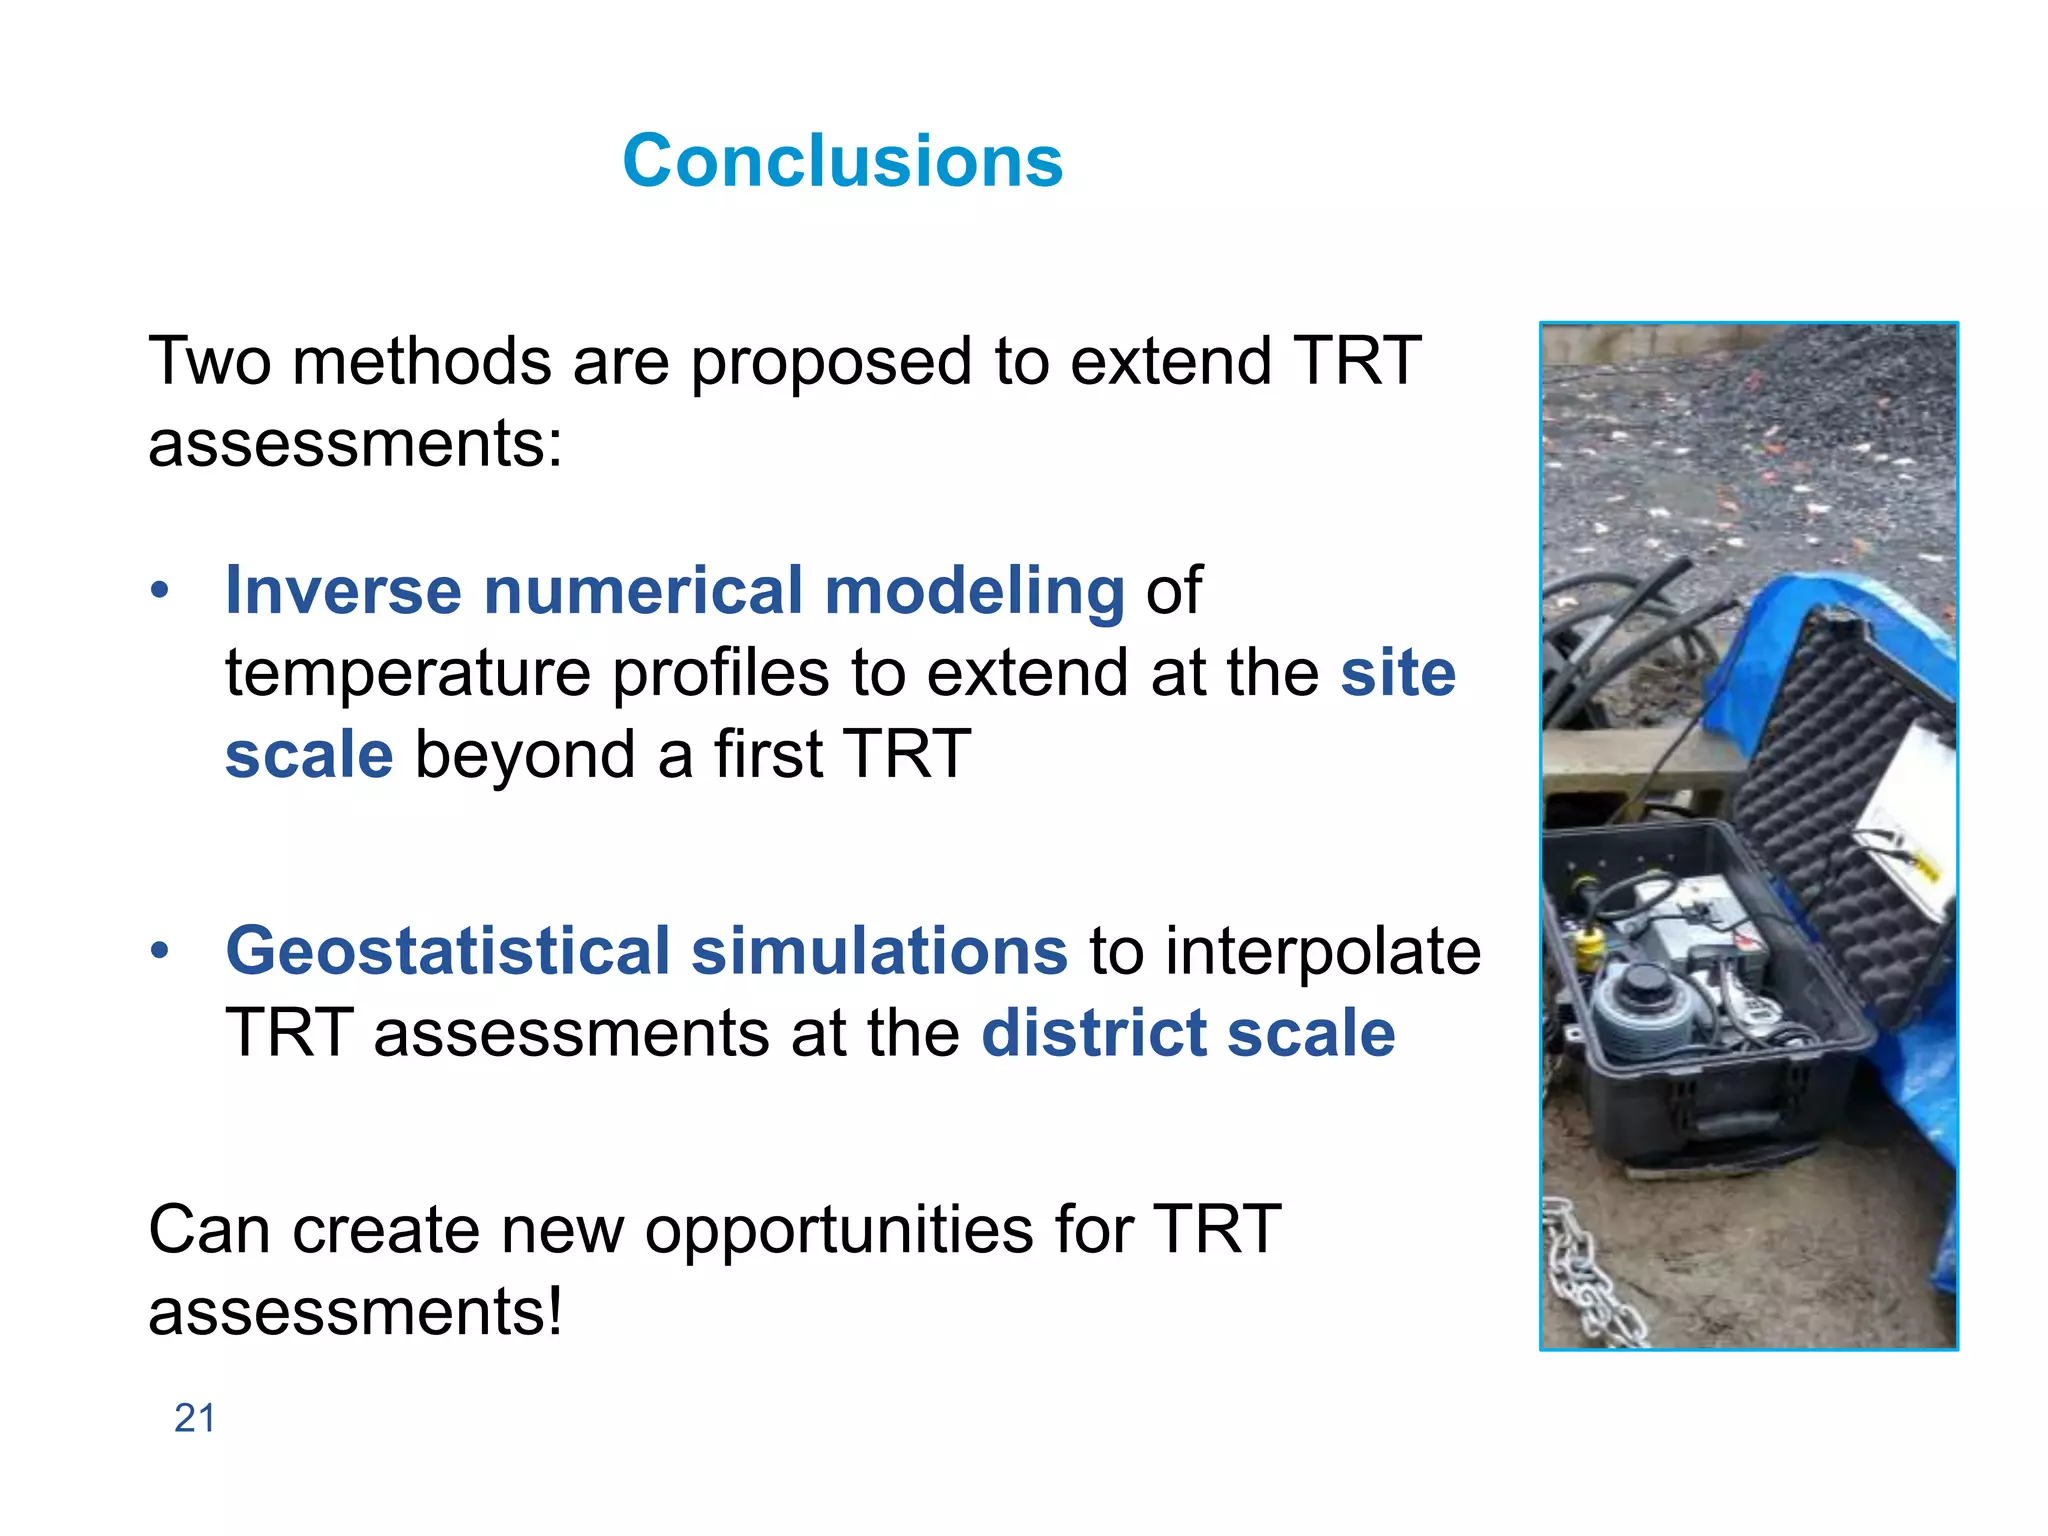

This document describes two new methods for spatially extending thermal response test (TRT) assessments: 1) Inverse numerical modeling of temperature profiles from multiple boreholes at a site can be used to evaluate subsurface thermal conductivity beyond a single TRT well. 2) At a district scale, geostatistical simulation using thermal conductivity data from outcrops, boreholes, and multiple TRTs can provide stochastic realizations of subsurface properties to spatially interpolate between test locations. Both methods allow TRT assessments to be expanded beyond their typical limited spatial scope, creating new opportunities for evaluating ground source heat potential.