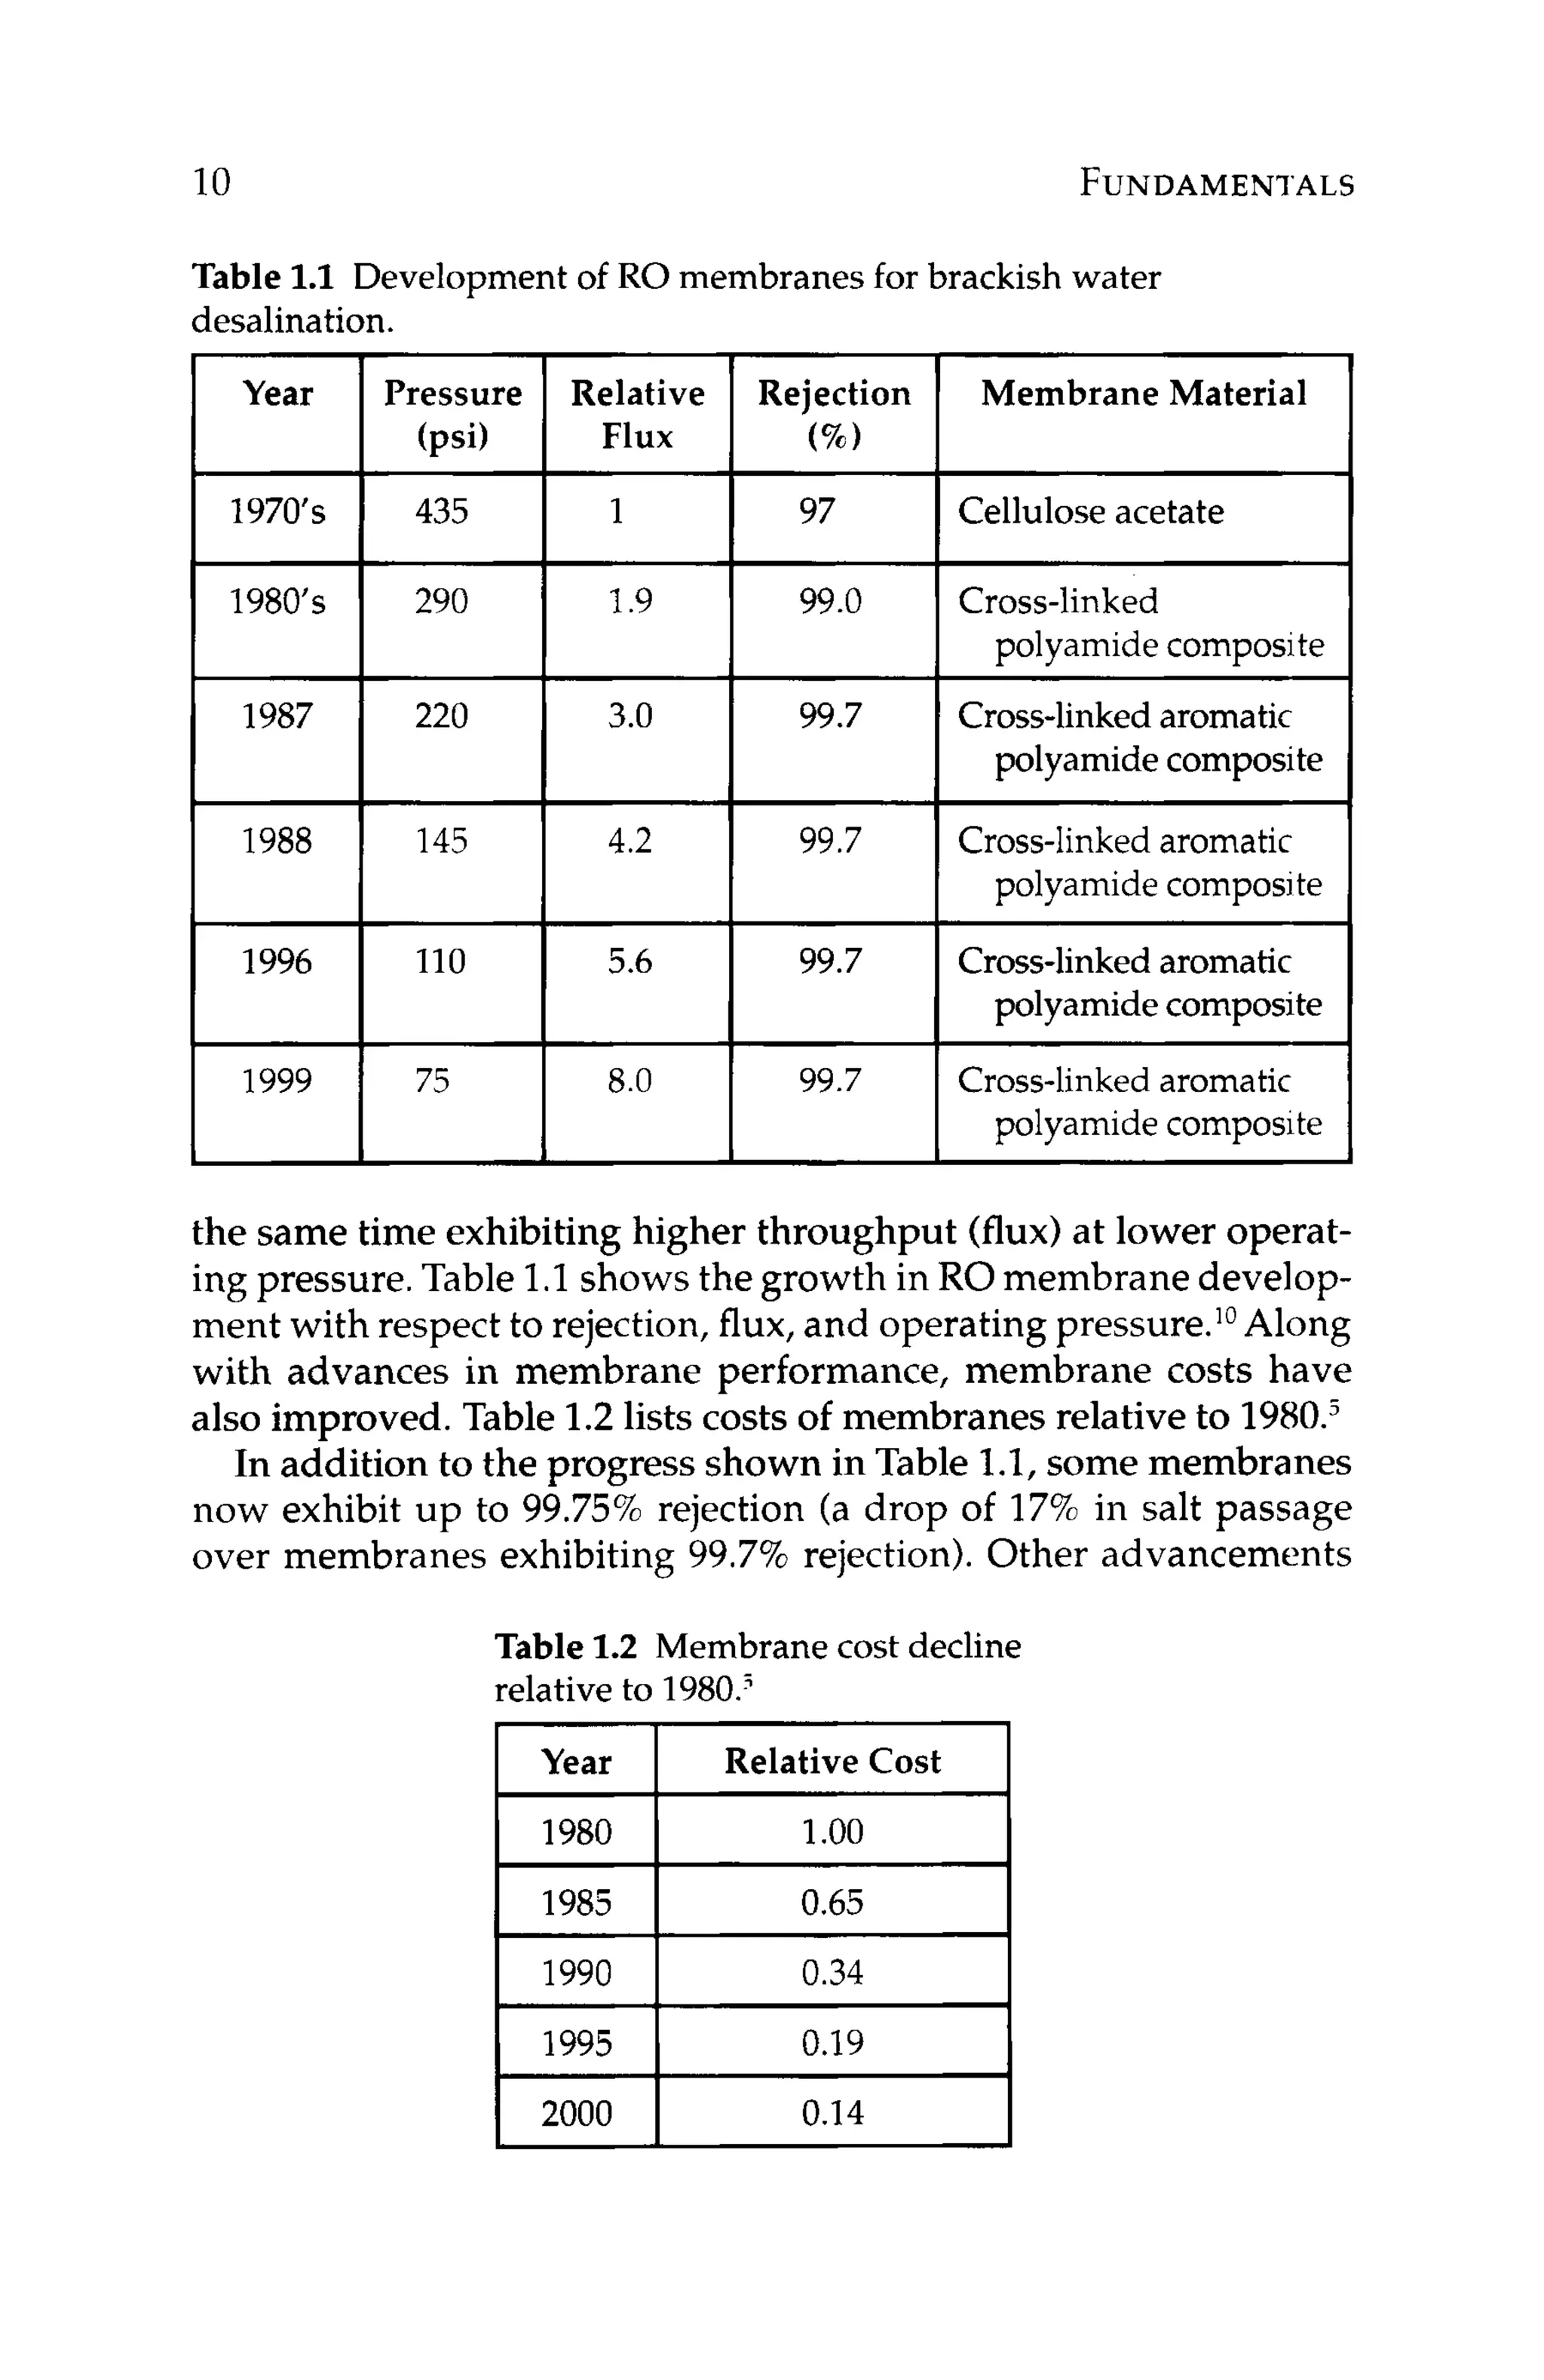
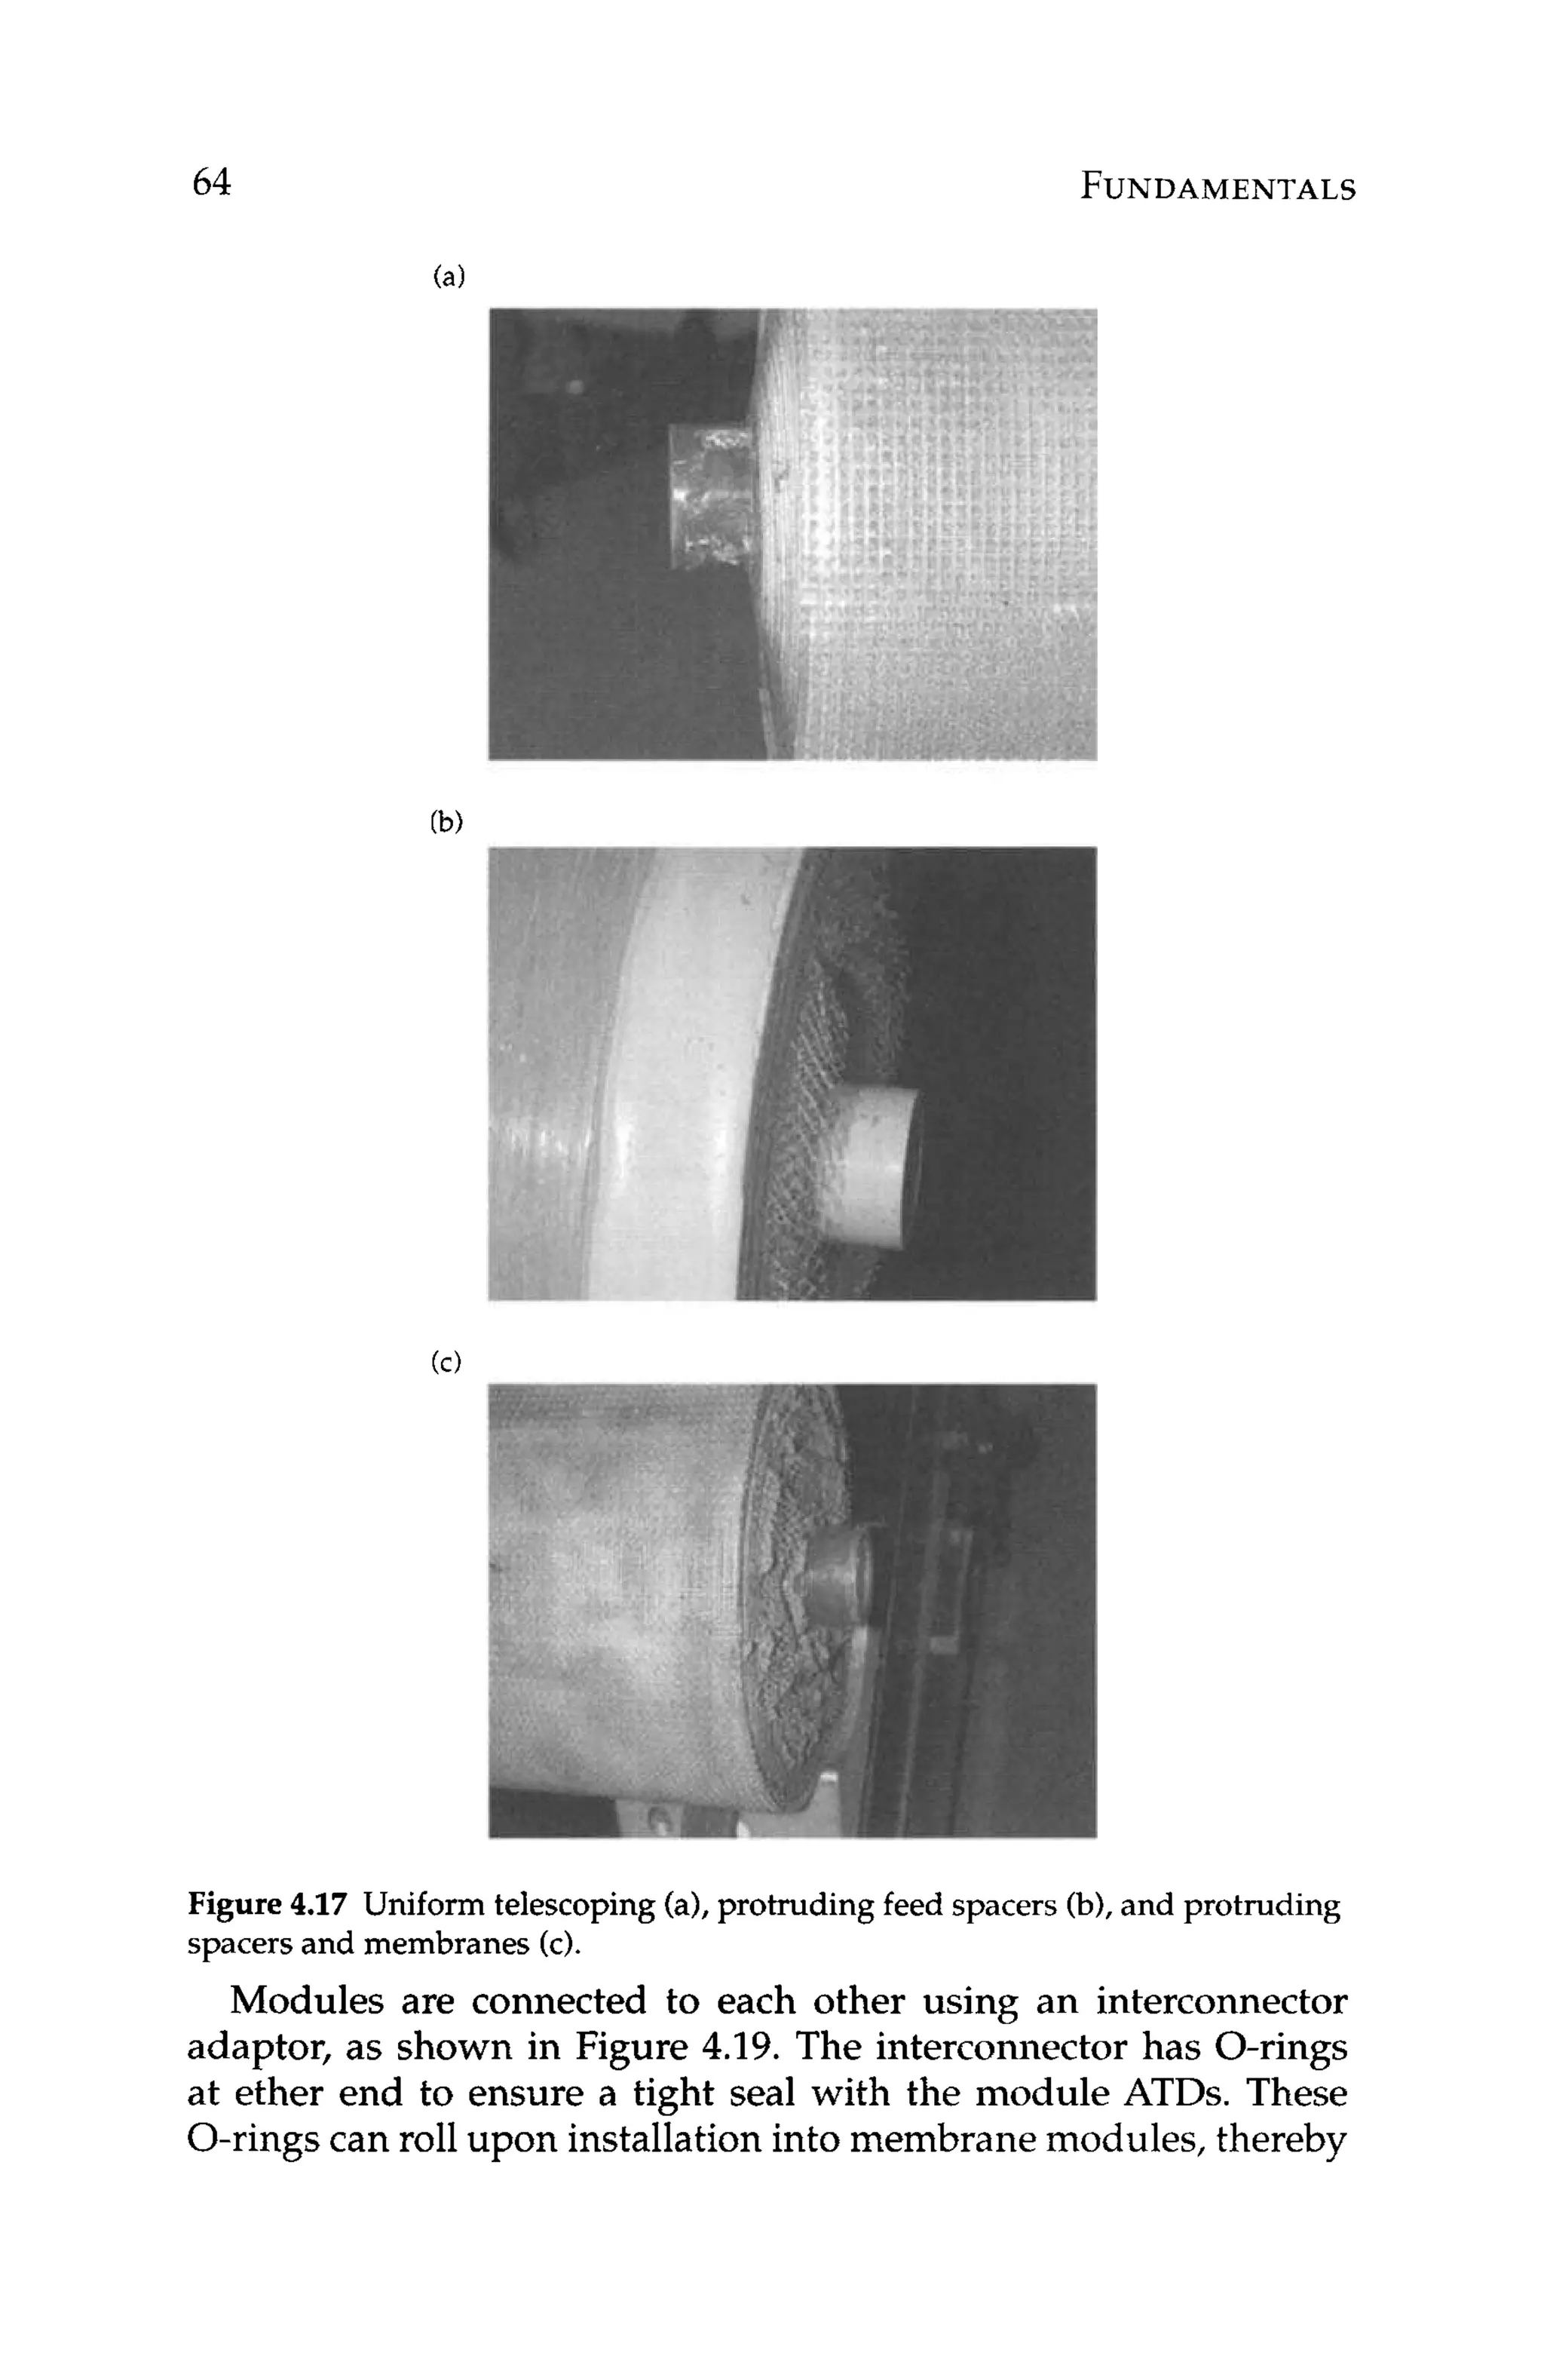
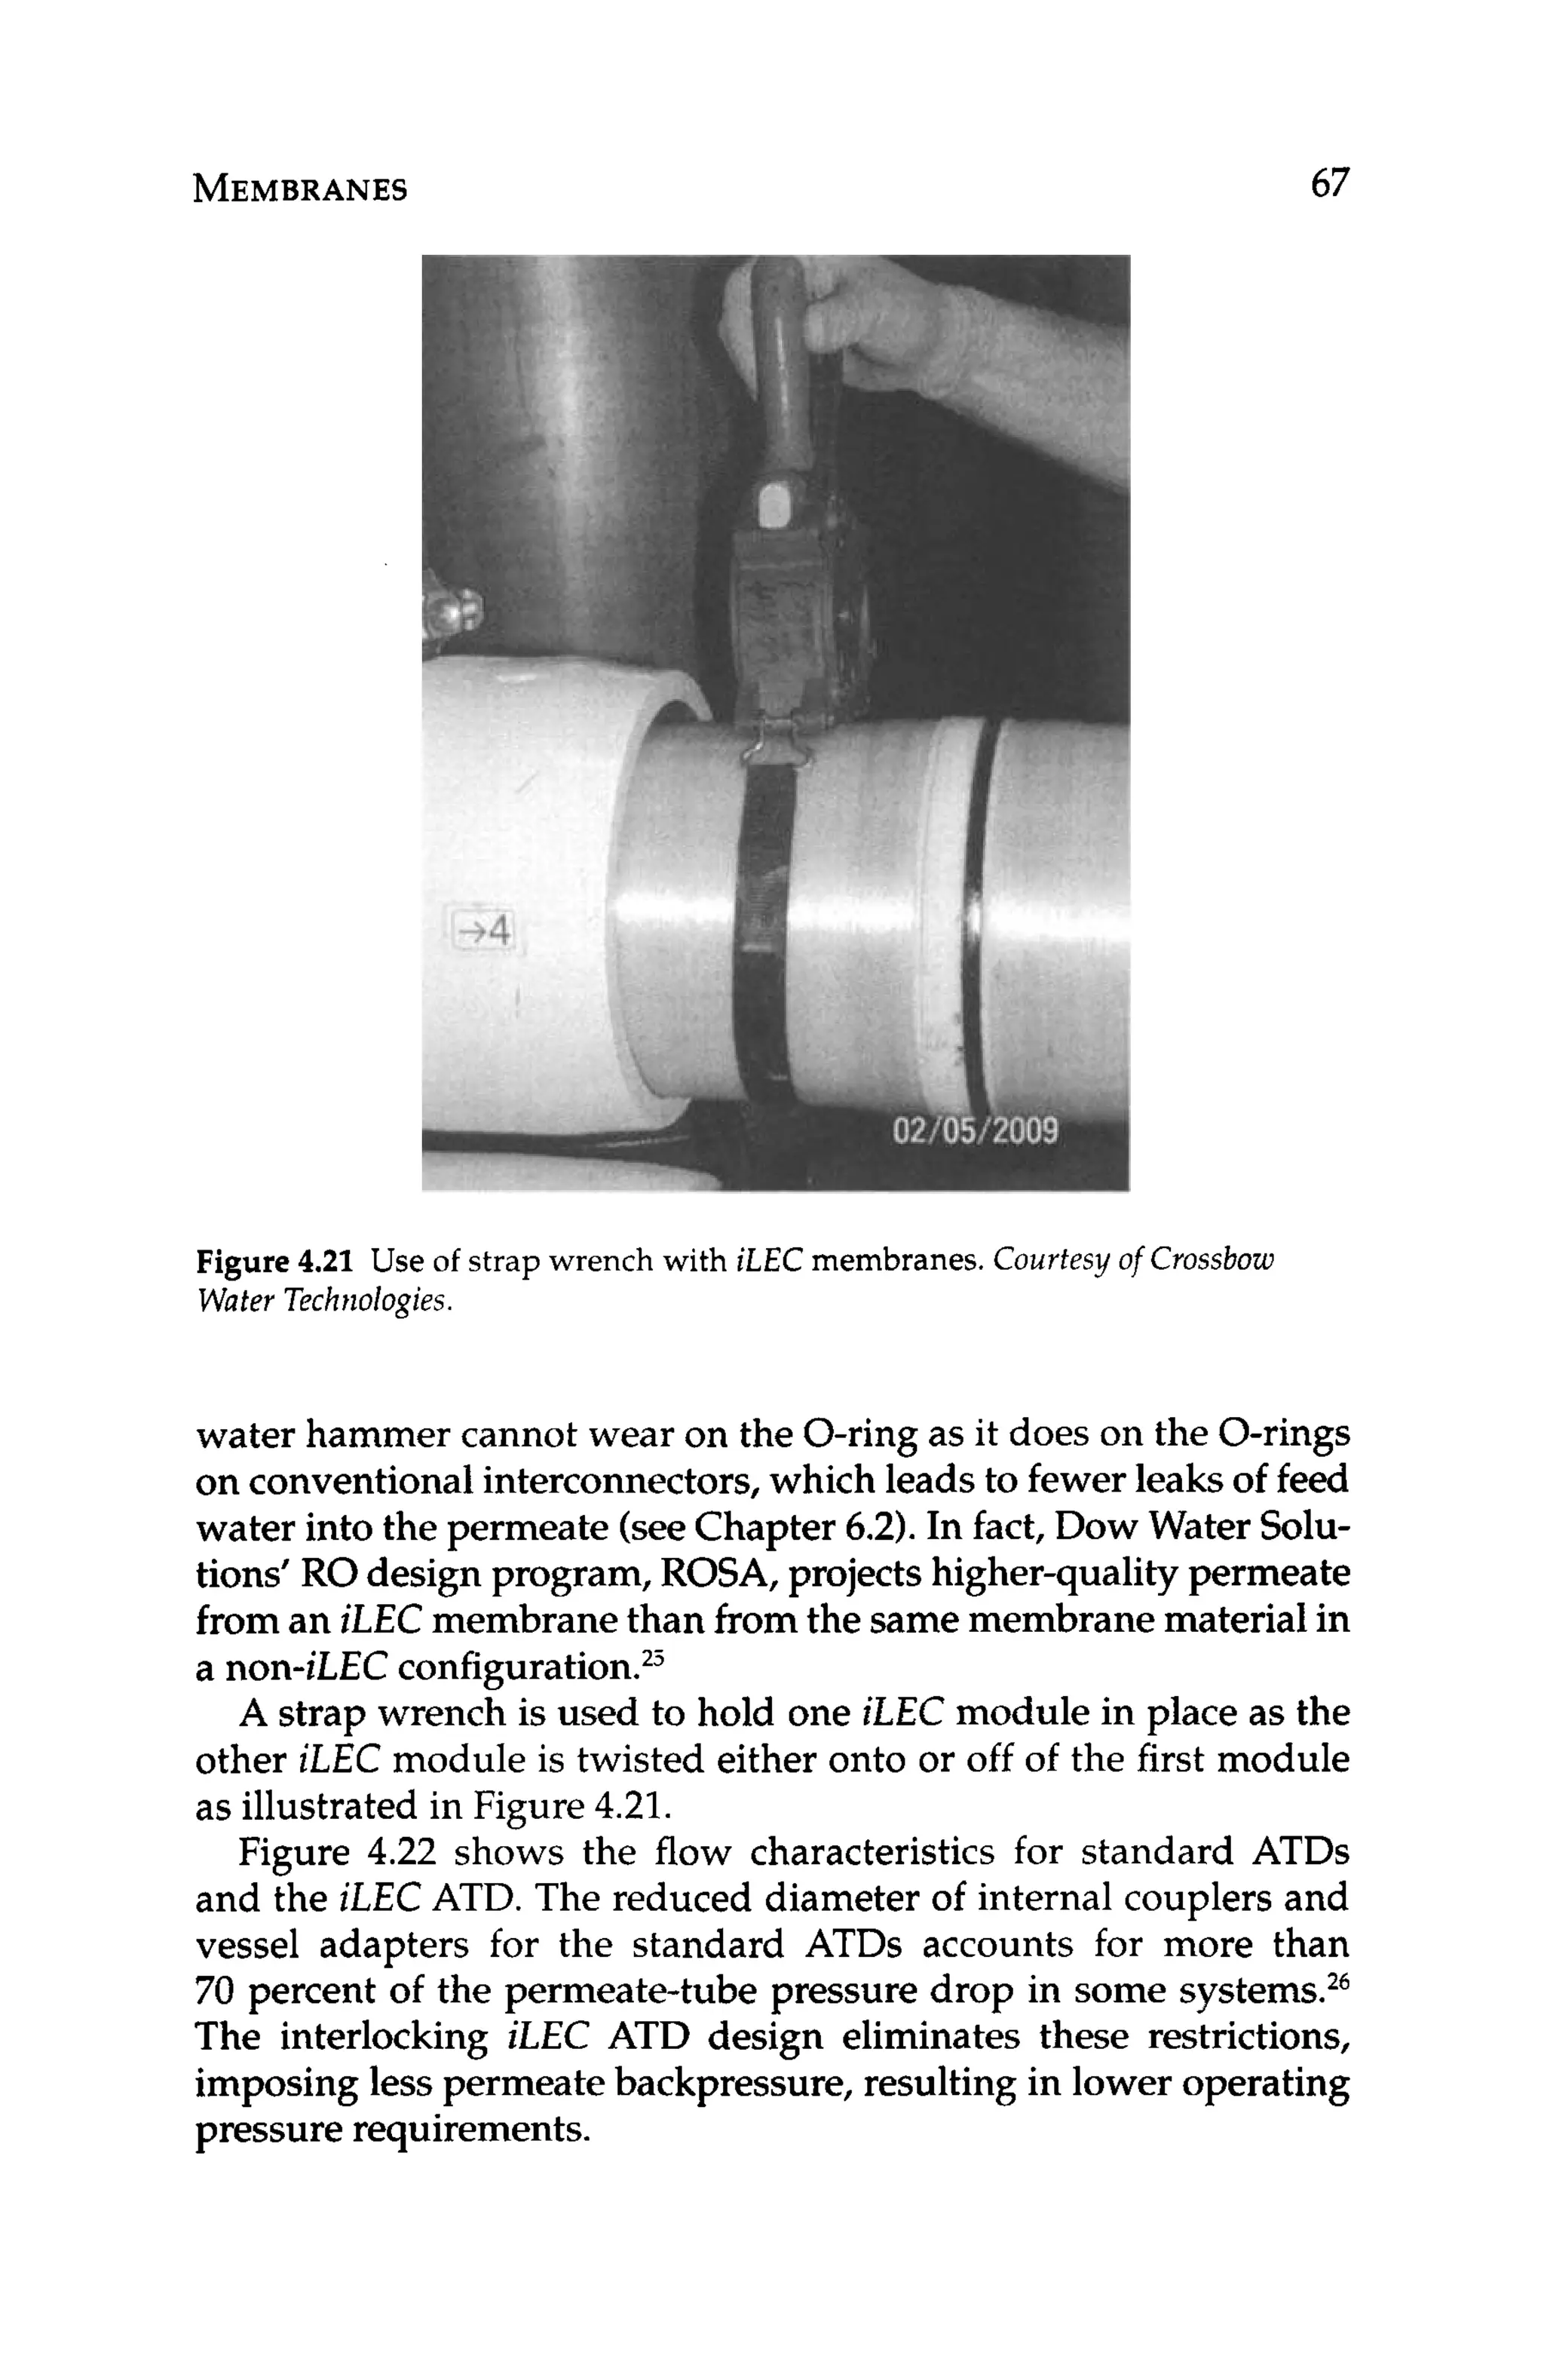
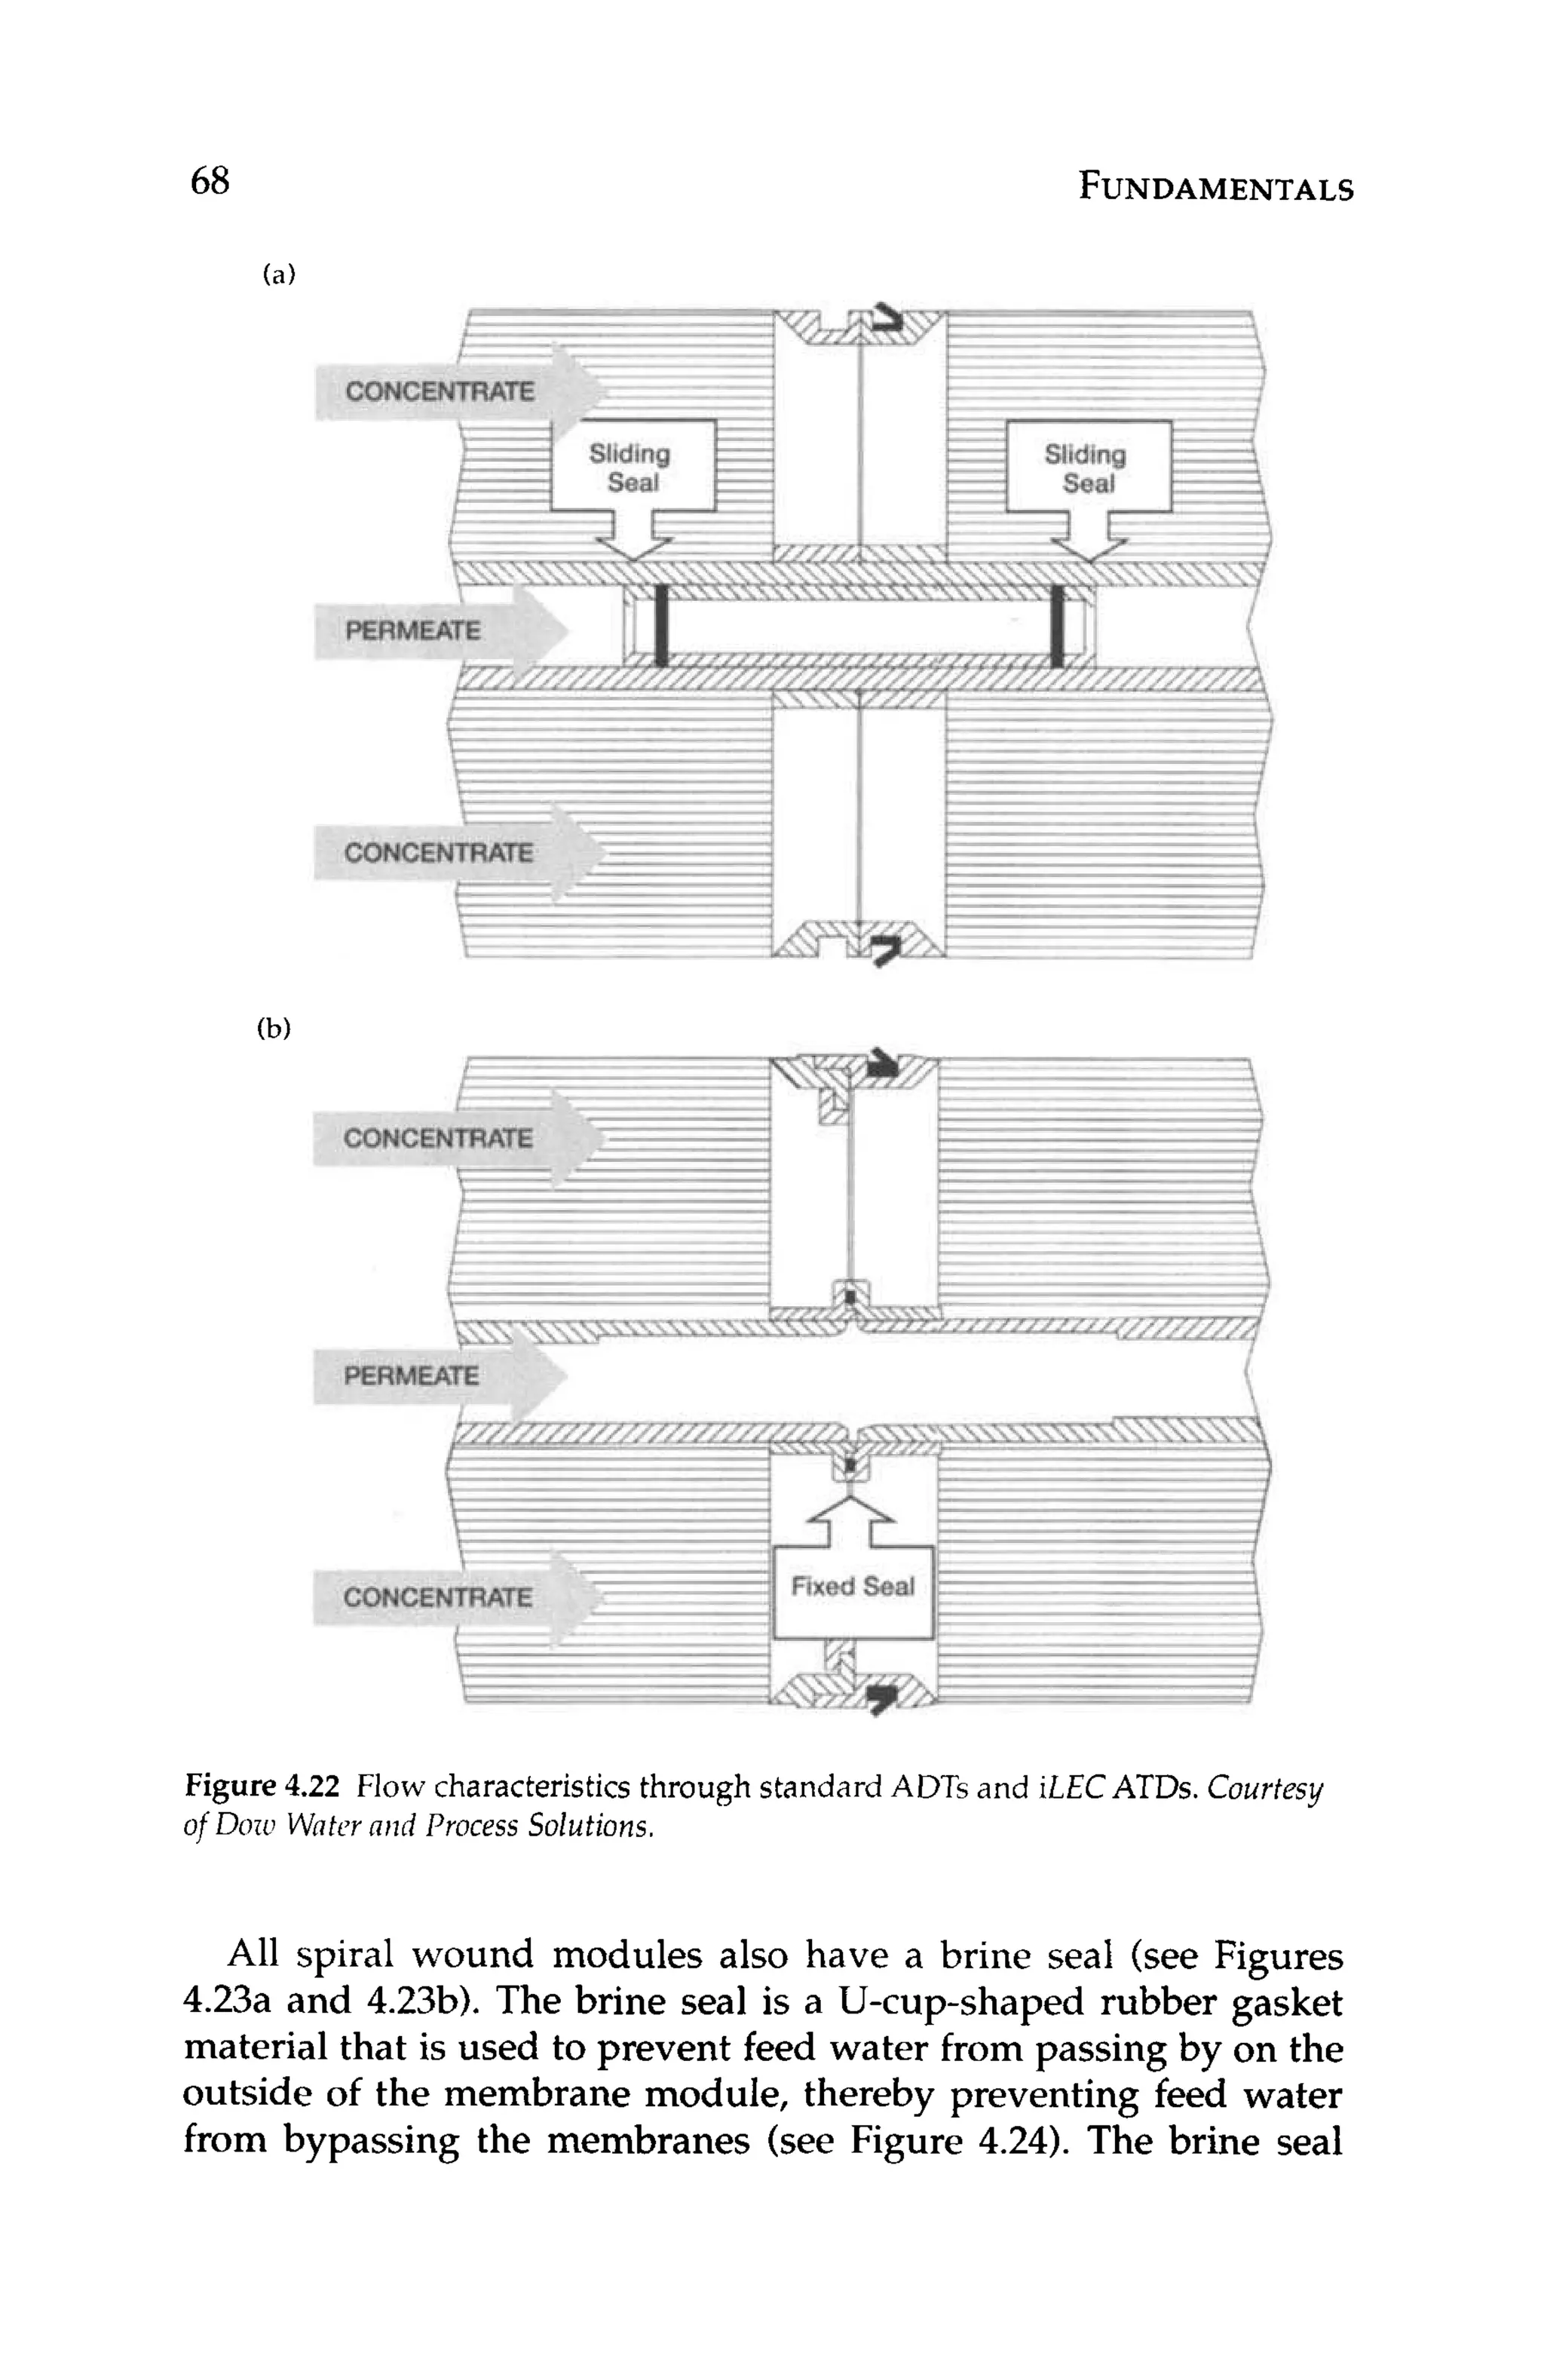
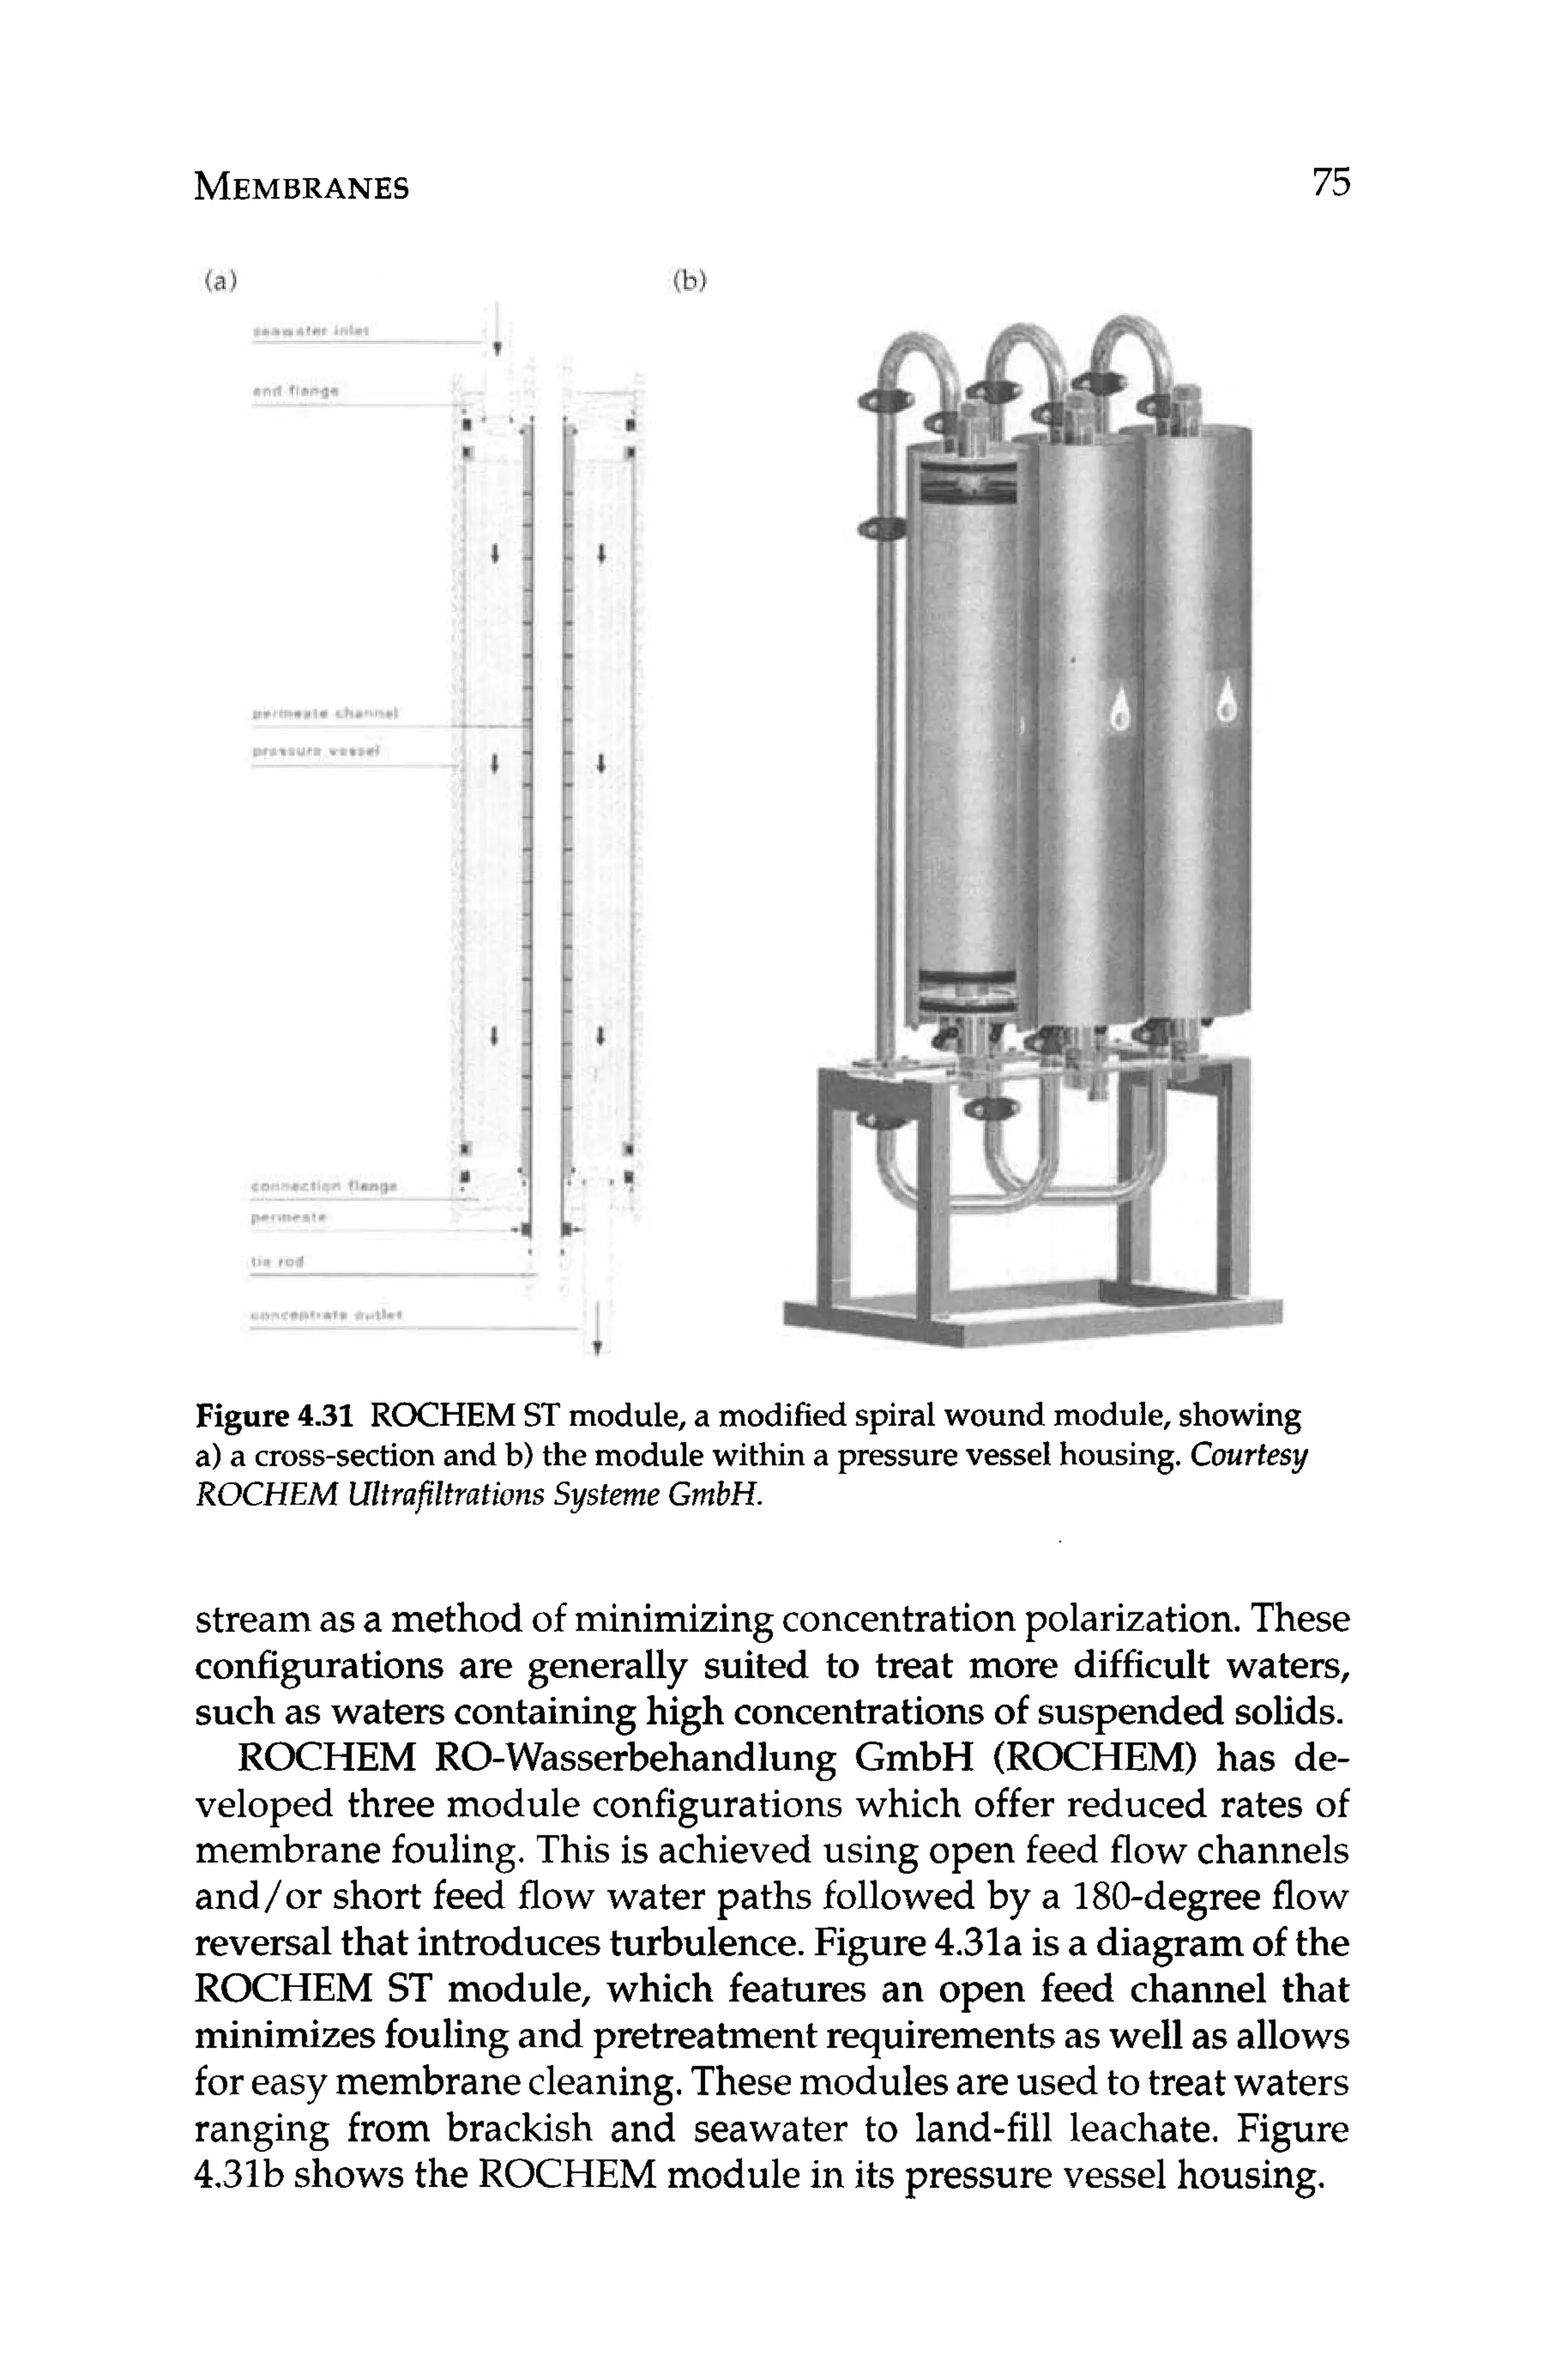
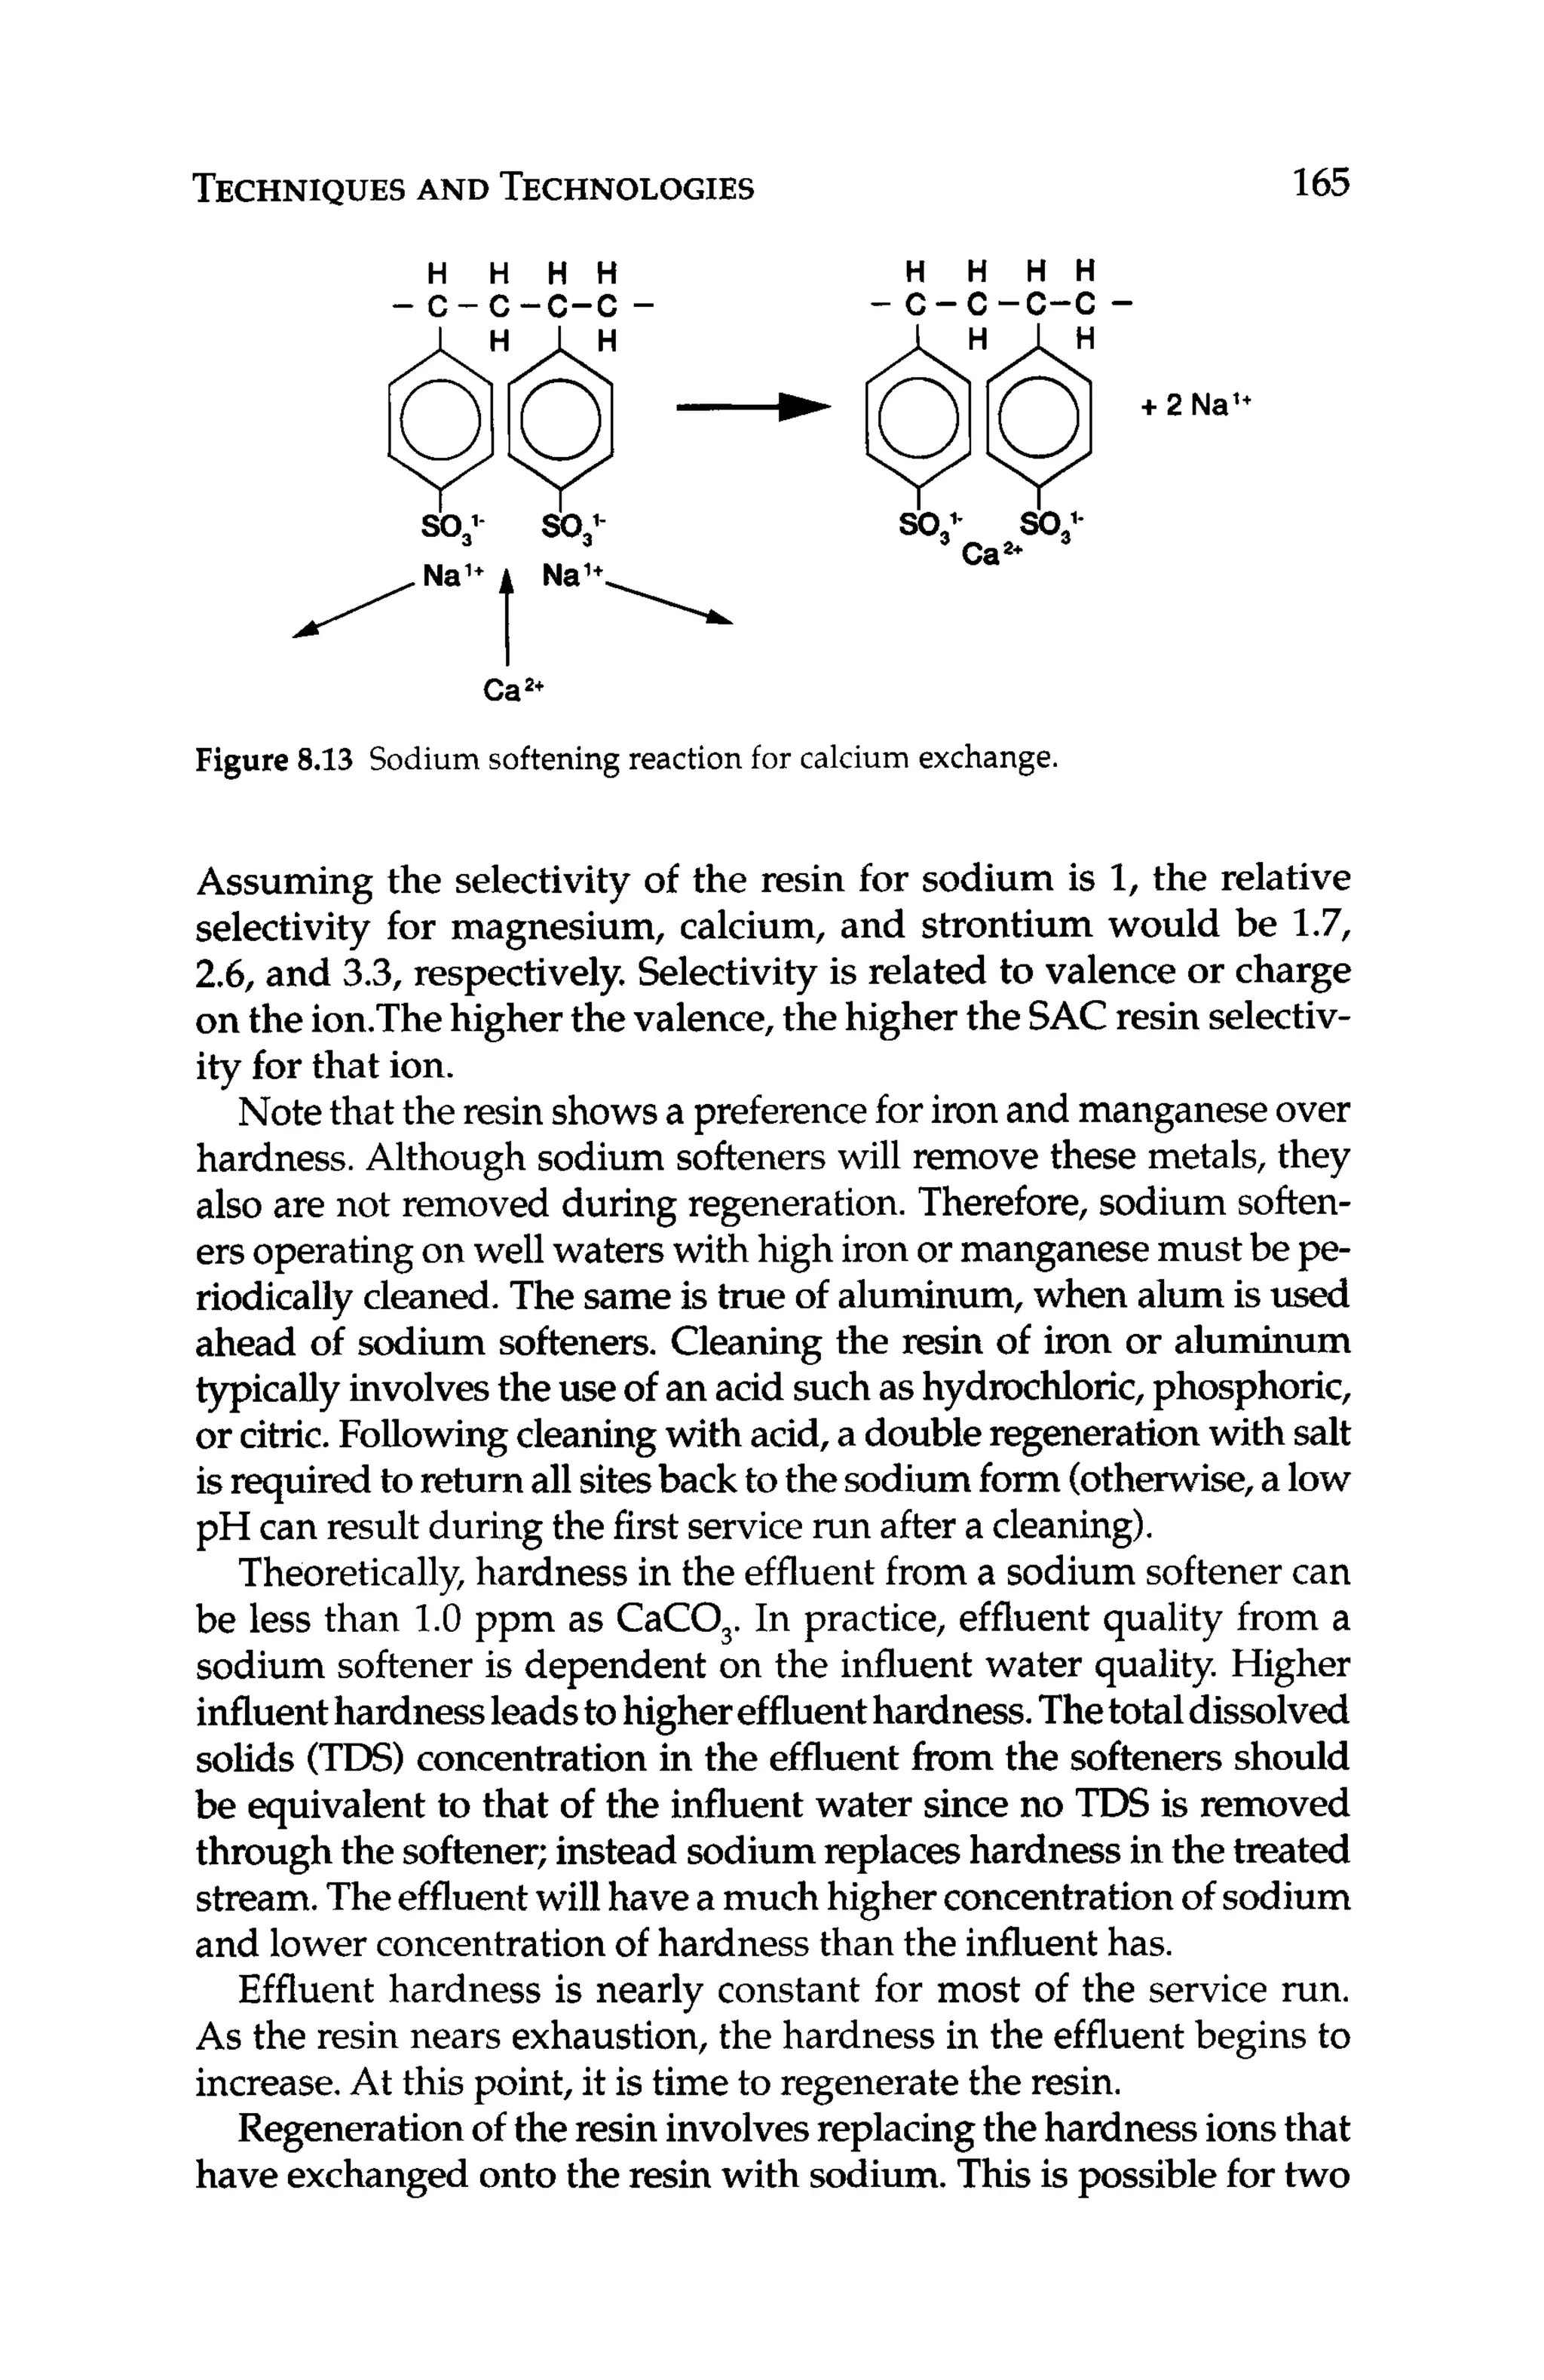
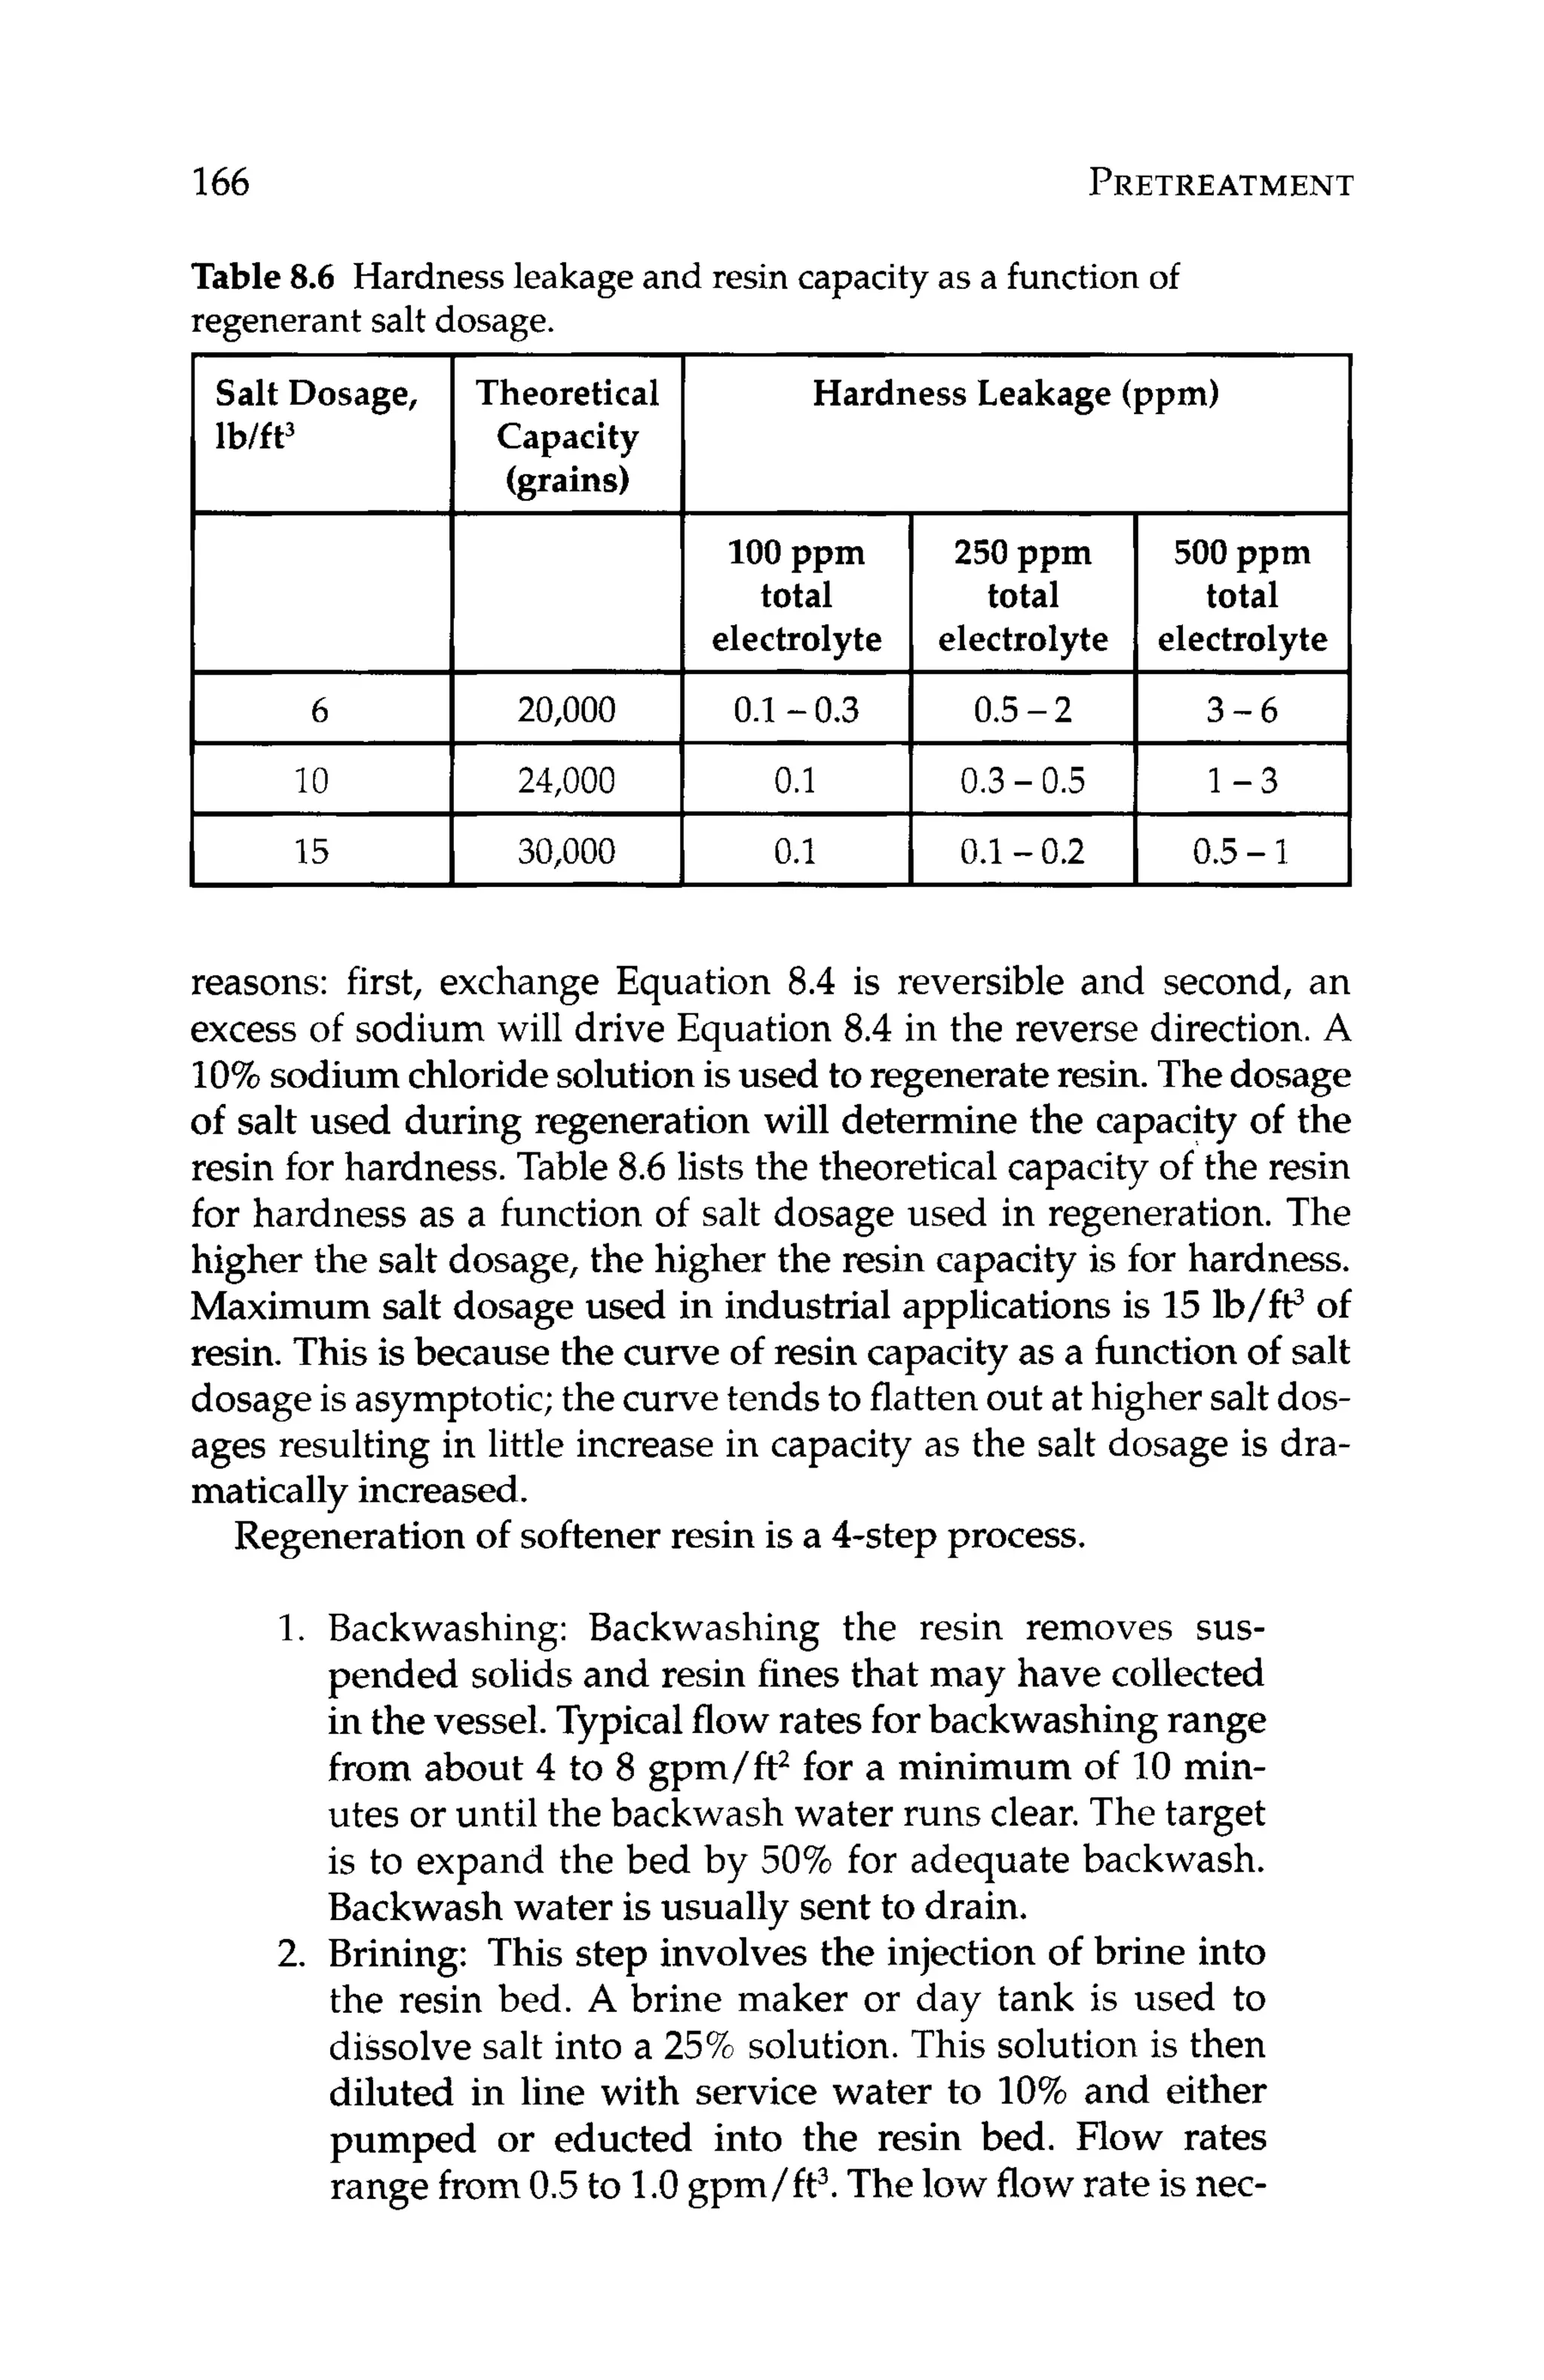
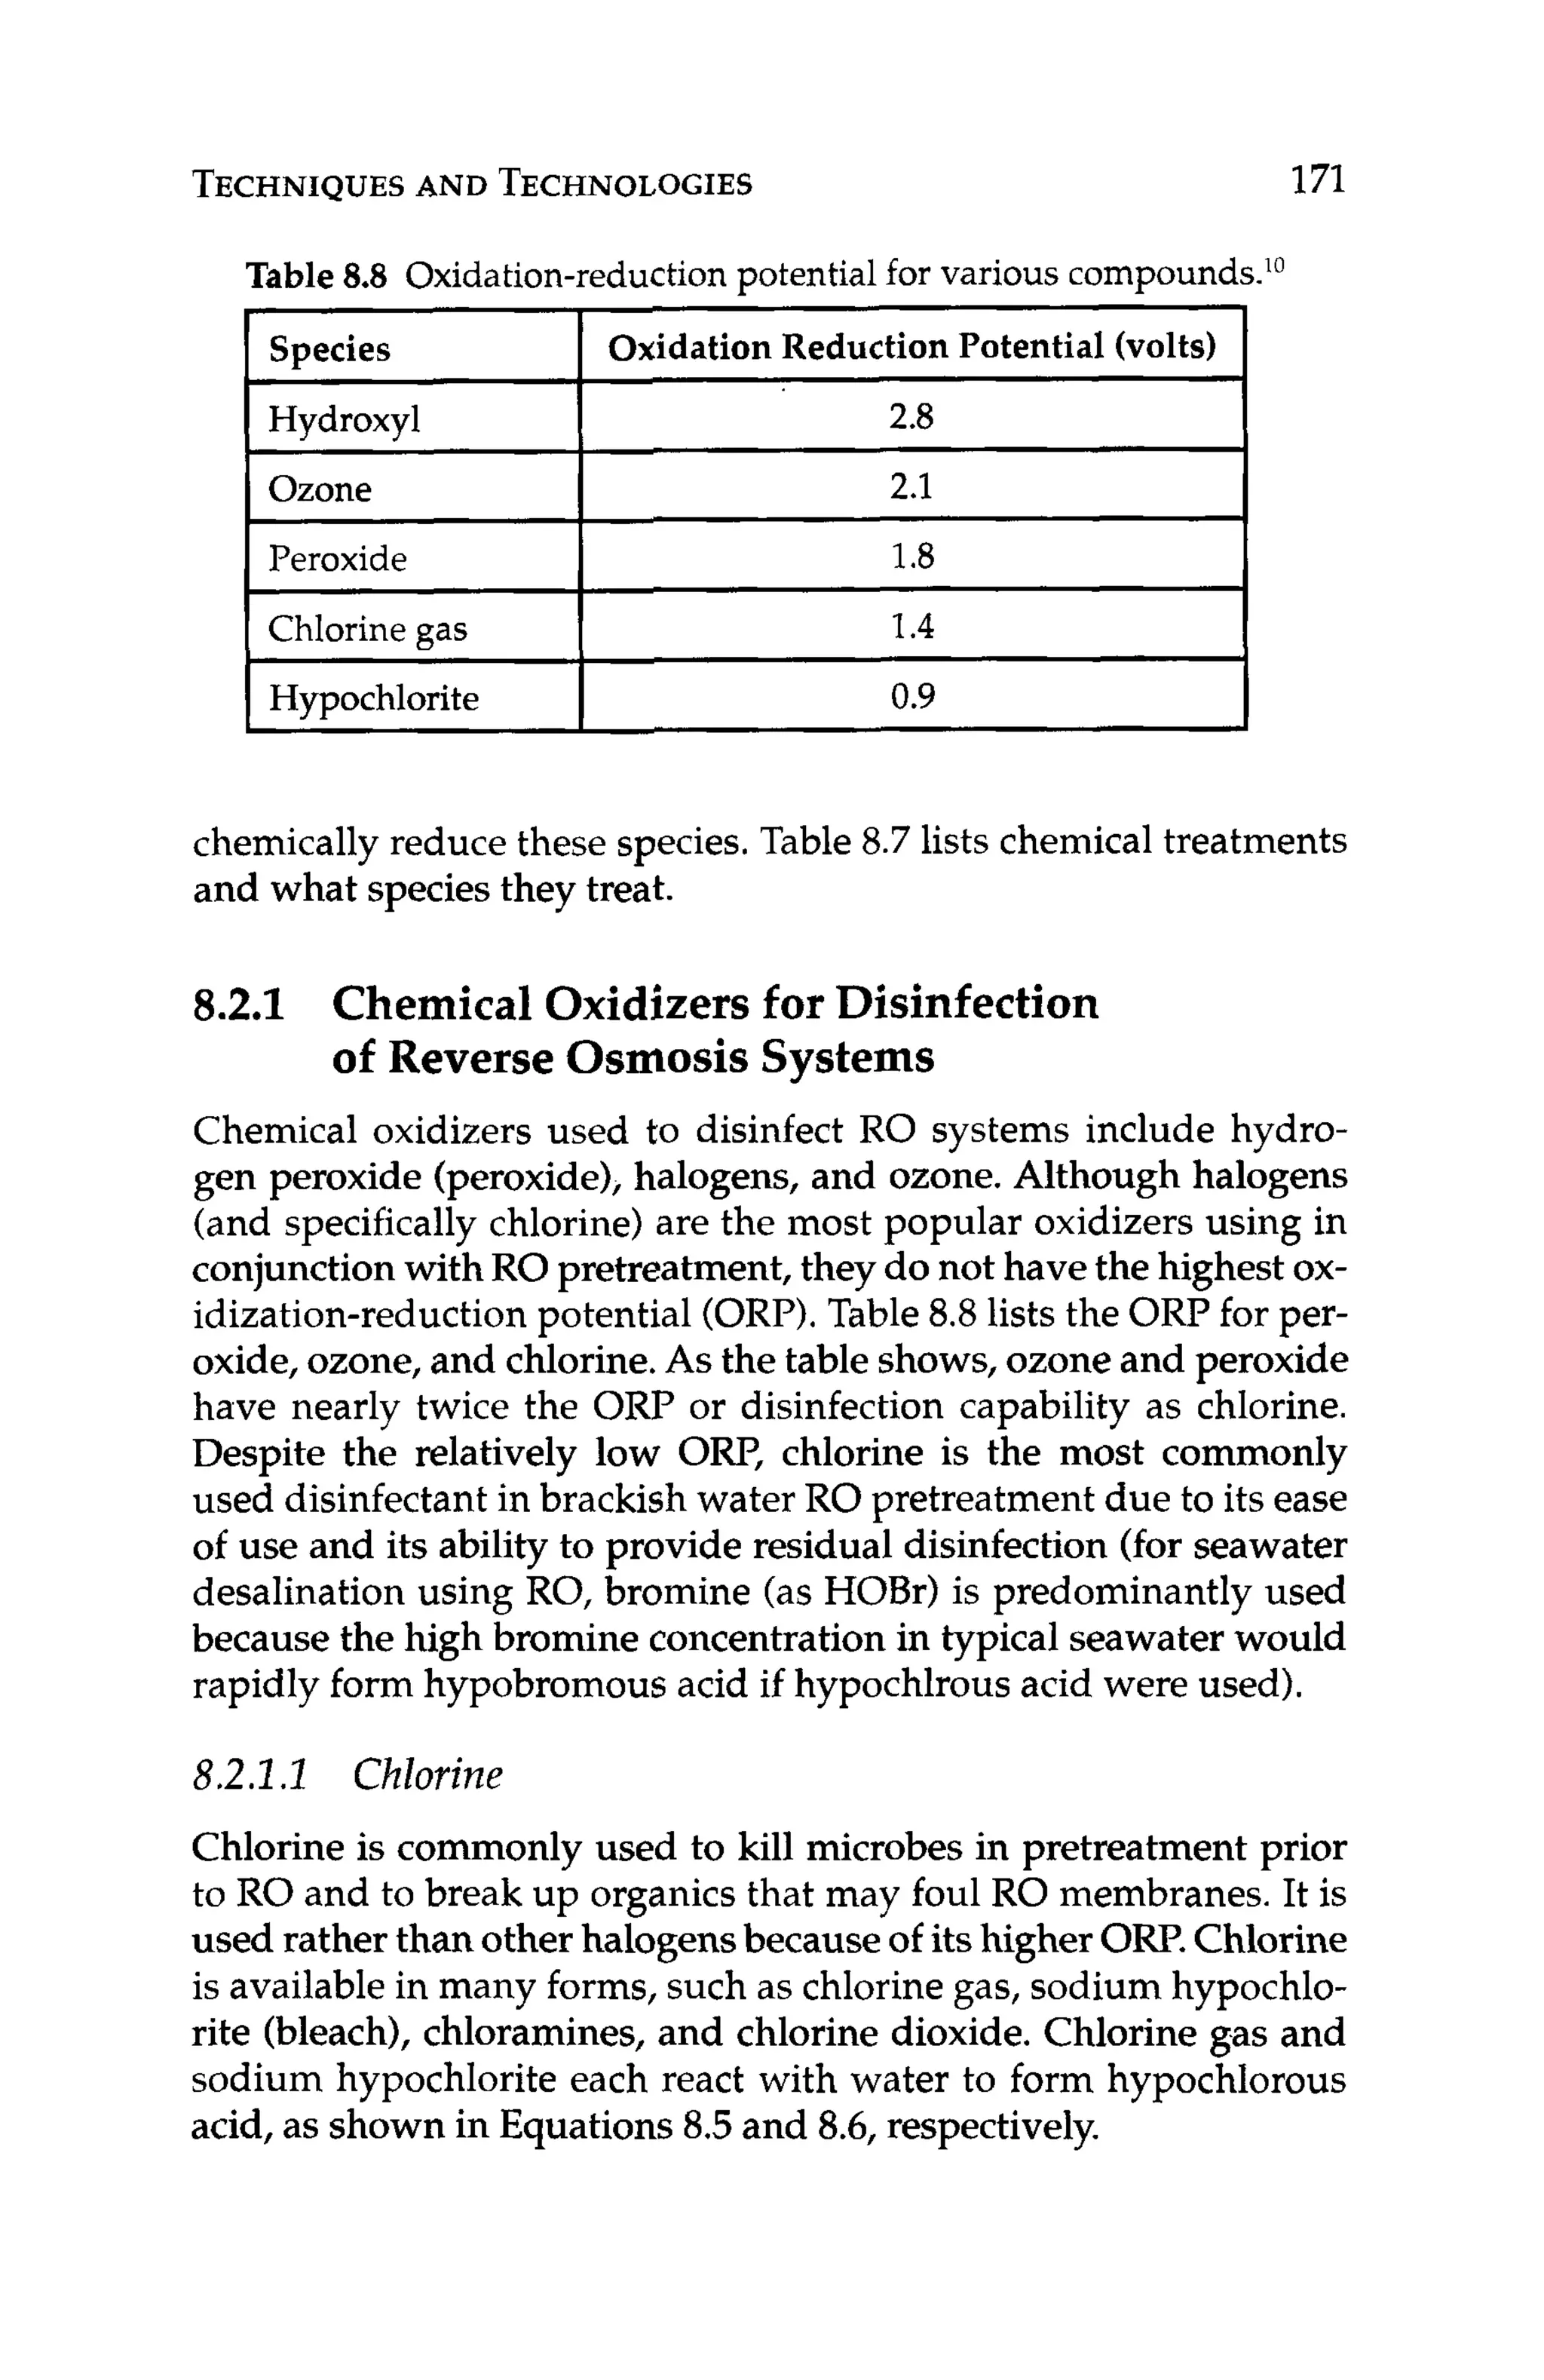
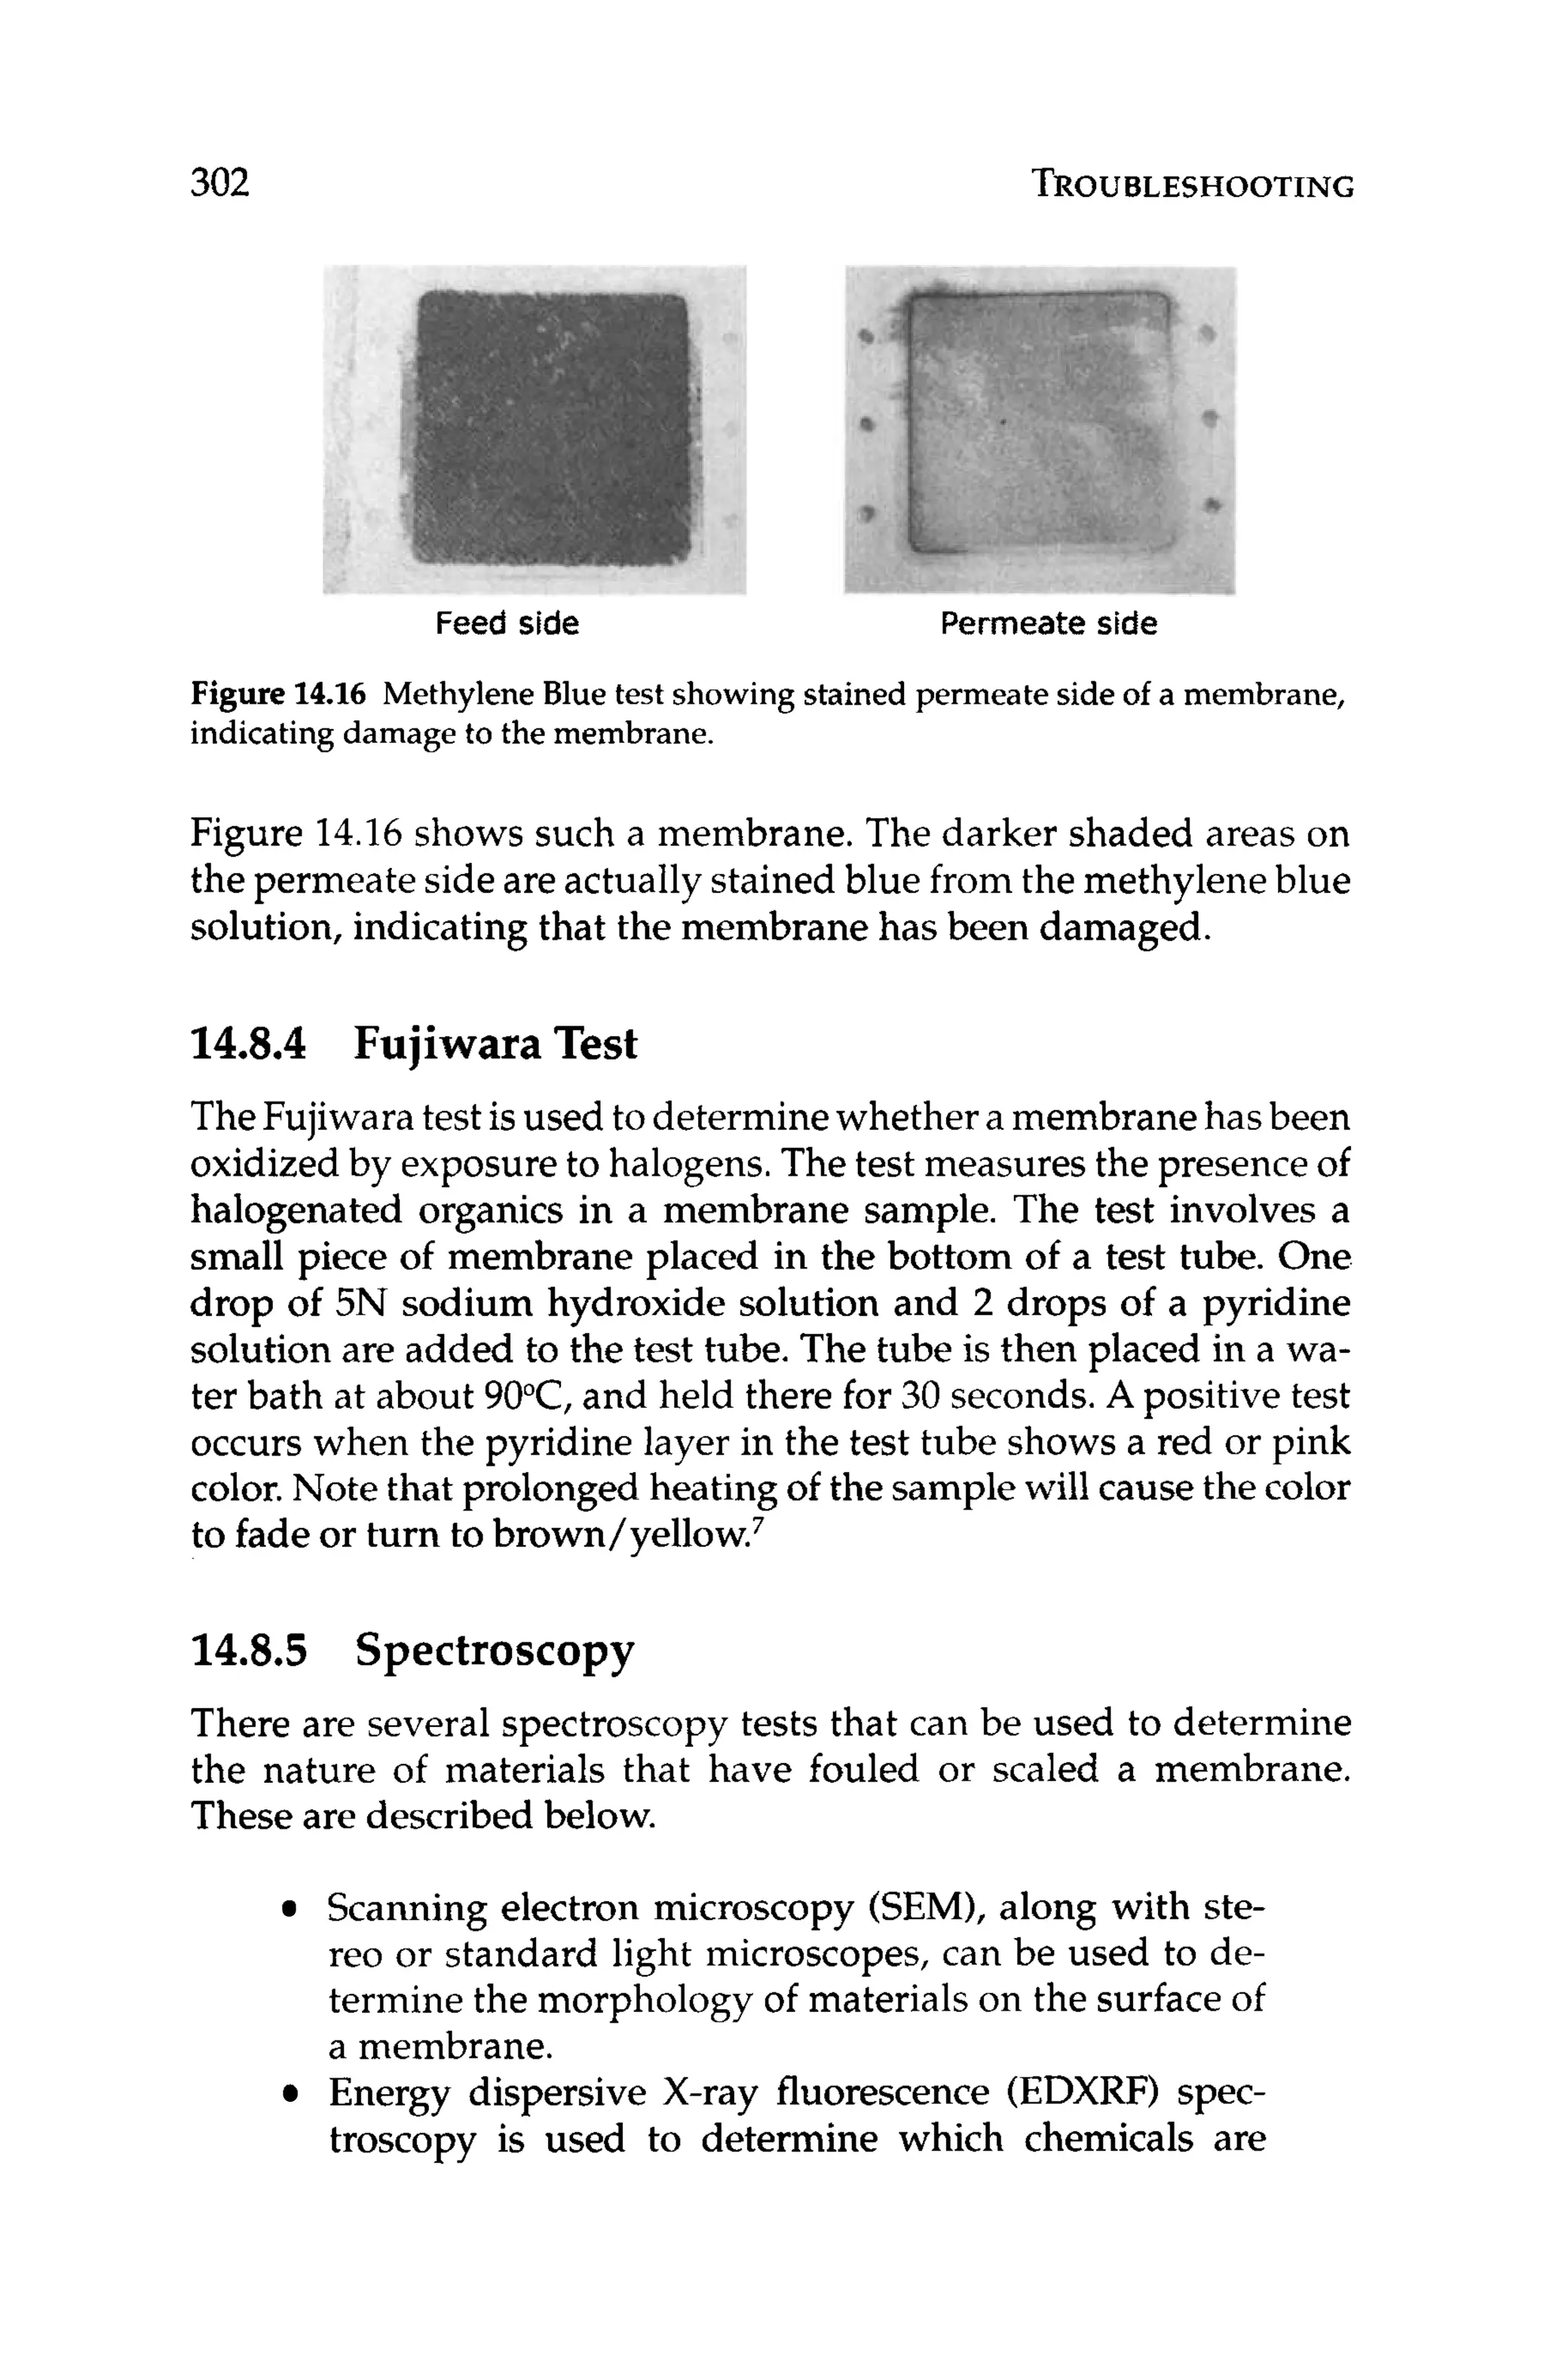
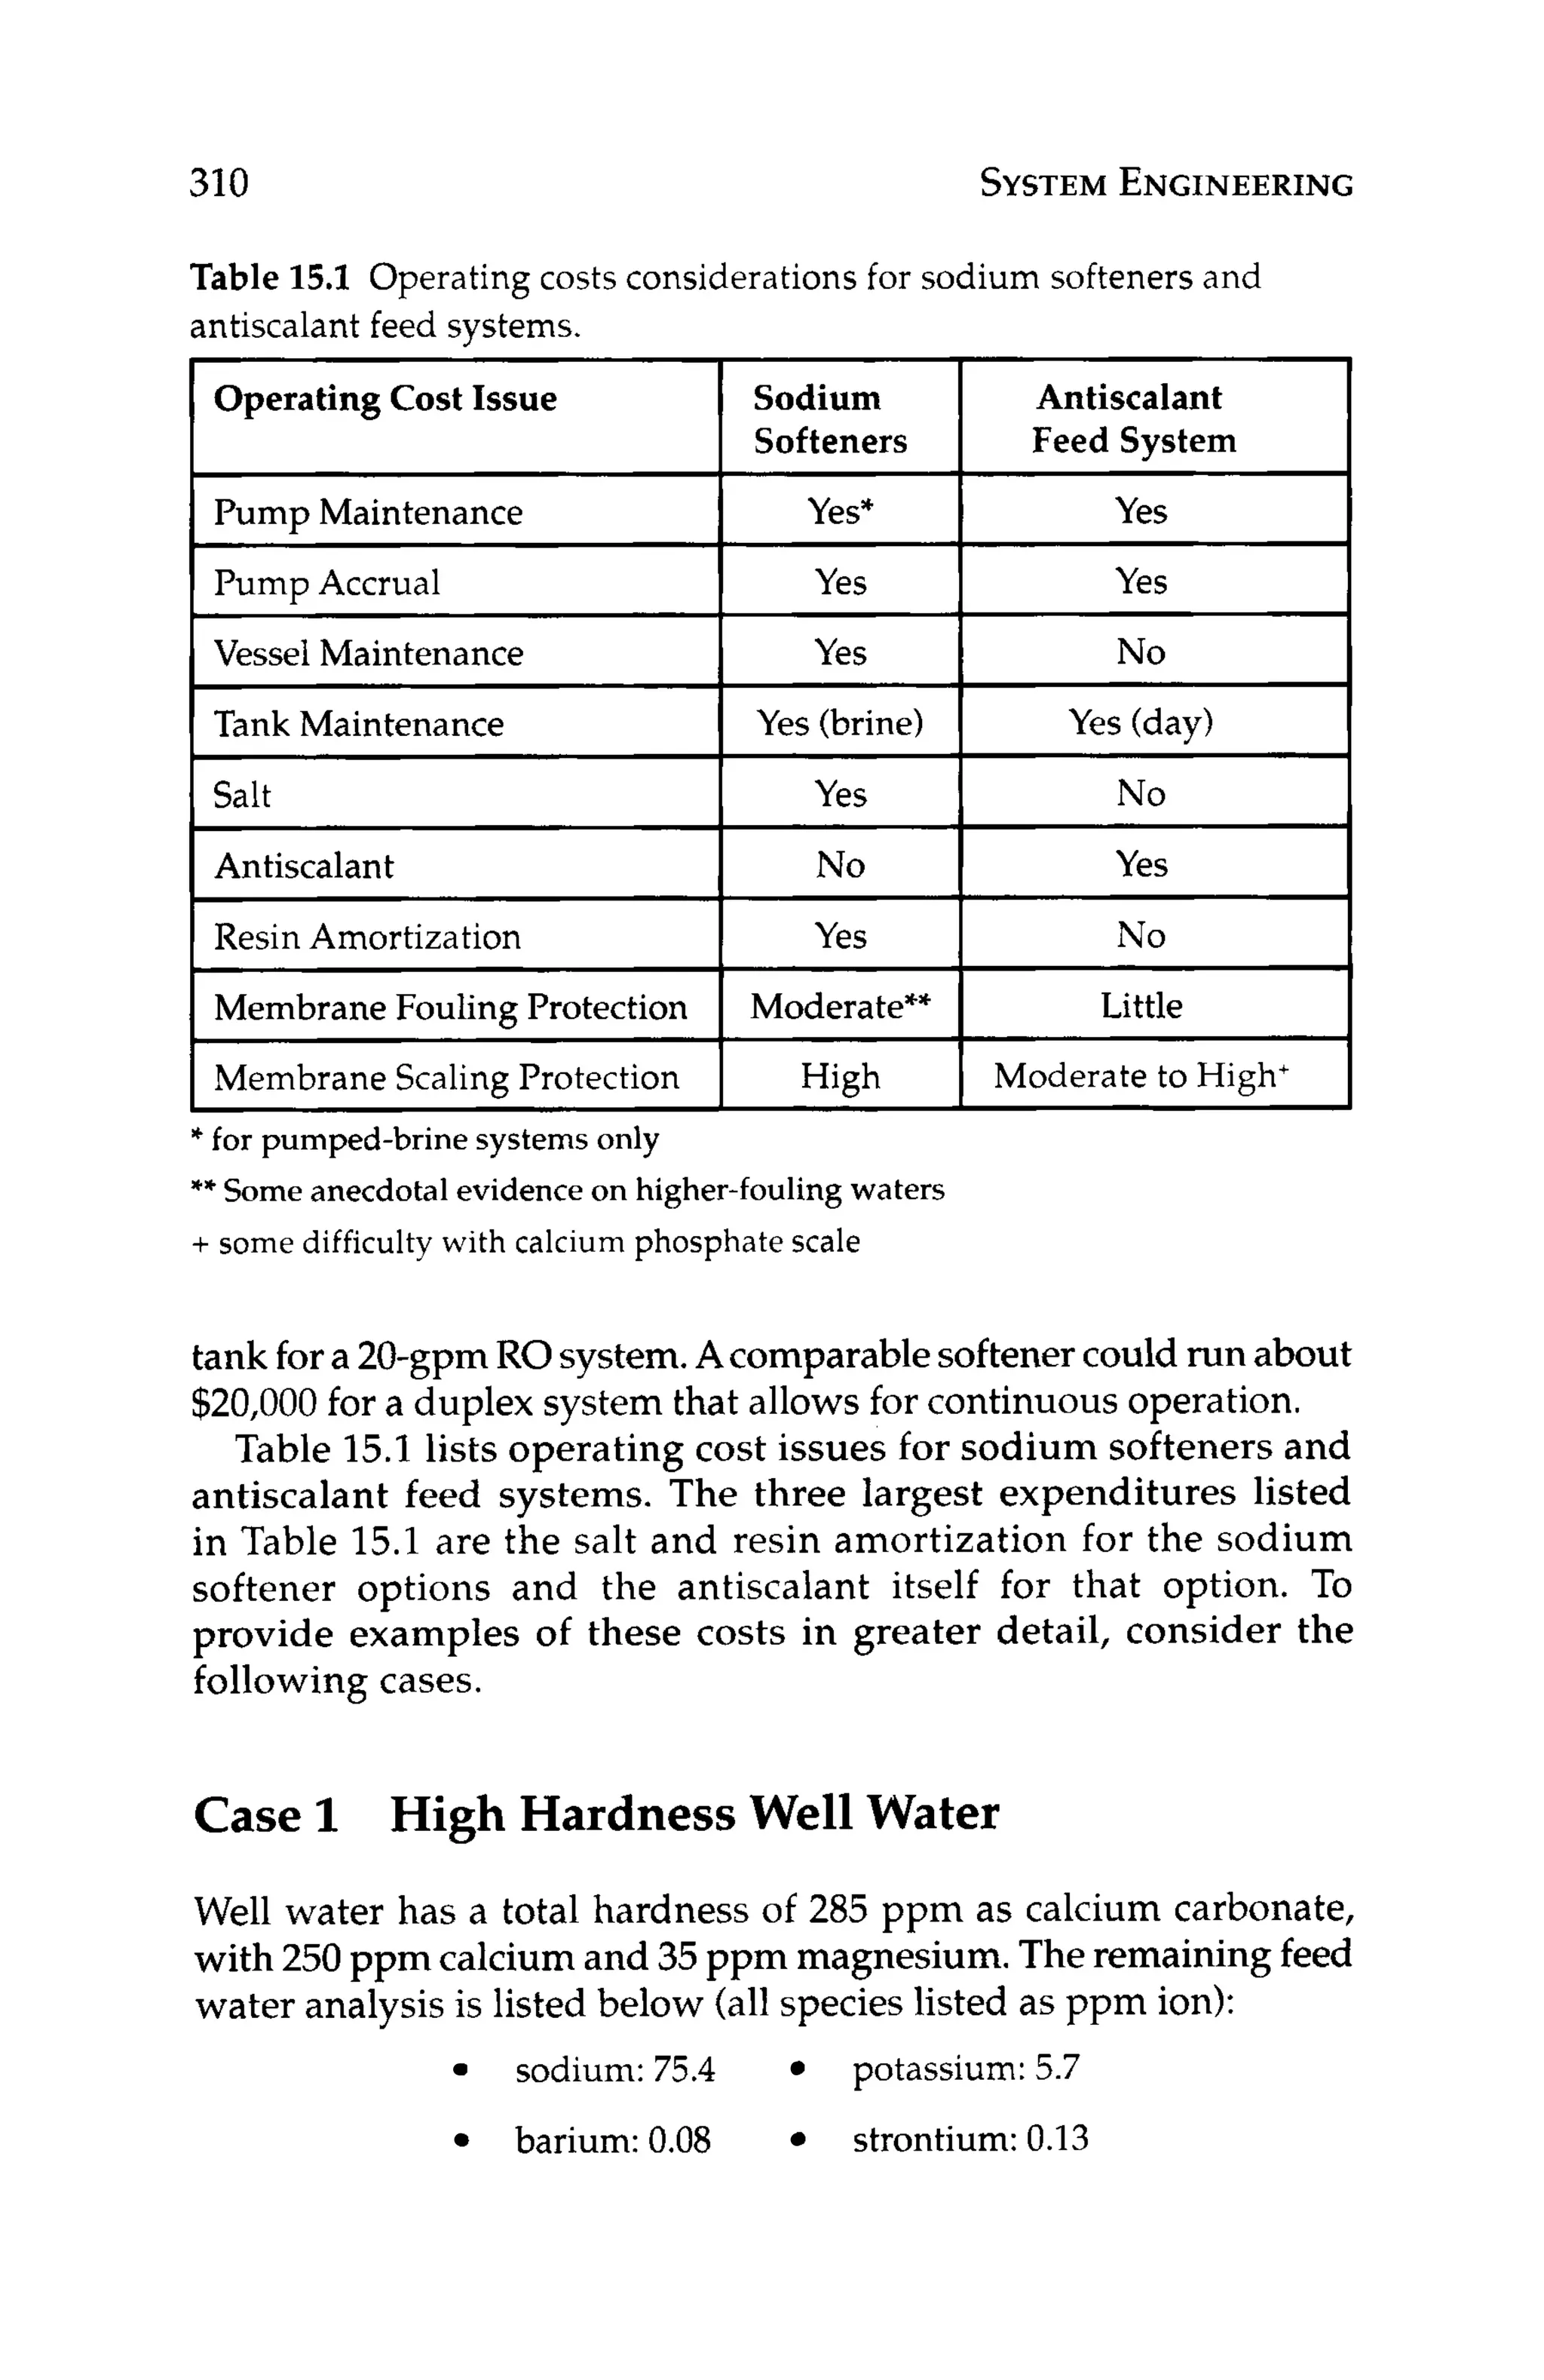
This document provides an overview of reverse osmosis (RO) membrane technology and system design. It discusses the history and development of RO, fundamental principles, membrane materials and configurations, pretreatment techniques, and system design, operation, and troubleshooting. The document is intended to serve as a reference for engineers working with RO systems.


![BASICTERMS
AND DEFINITIONS 23
-
Instantaneous Pppm
Permeate
Concentration
98% Rejection Membrane
Feed / Concentrate 100 ppm 200 400
Concentration
Recovery 0% 50% 75%
-
Figure 3.1 Concentrateand instantaneouspermeate concentration as functions
of recovery.
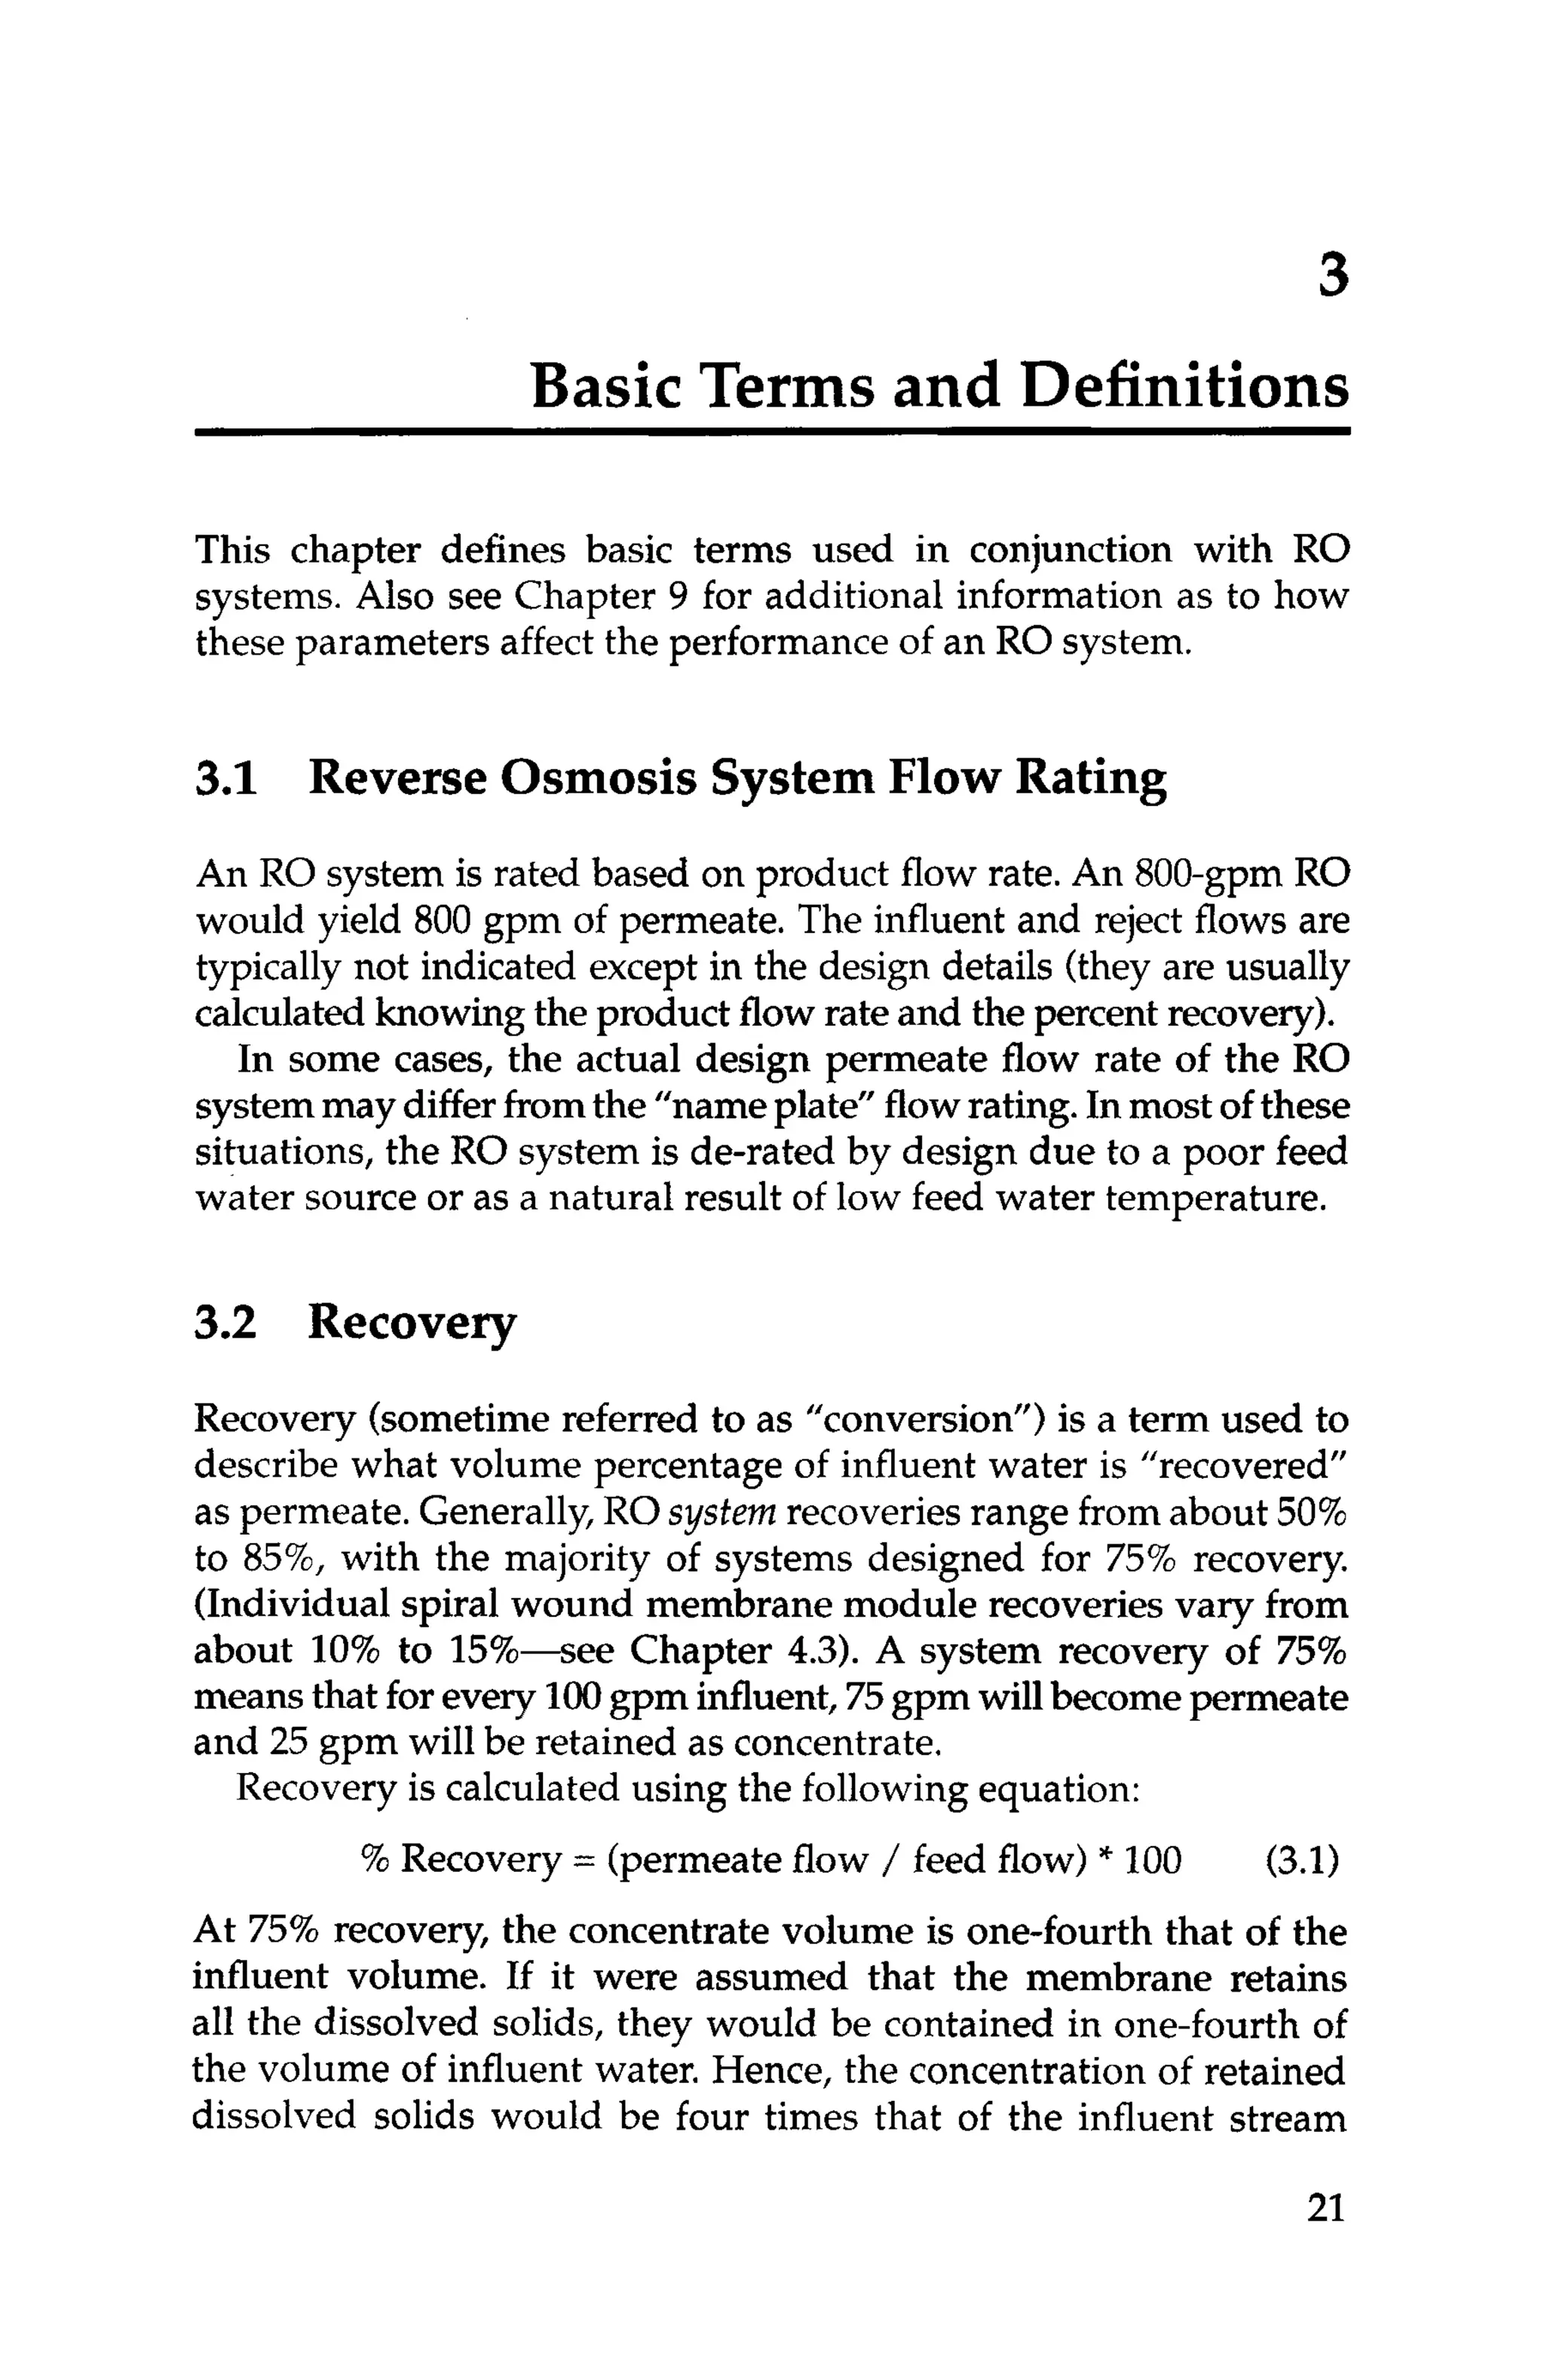
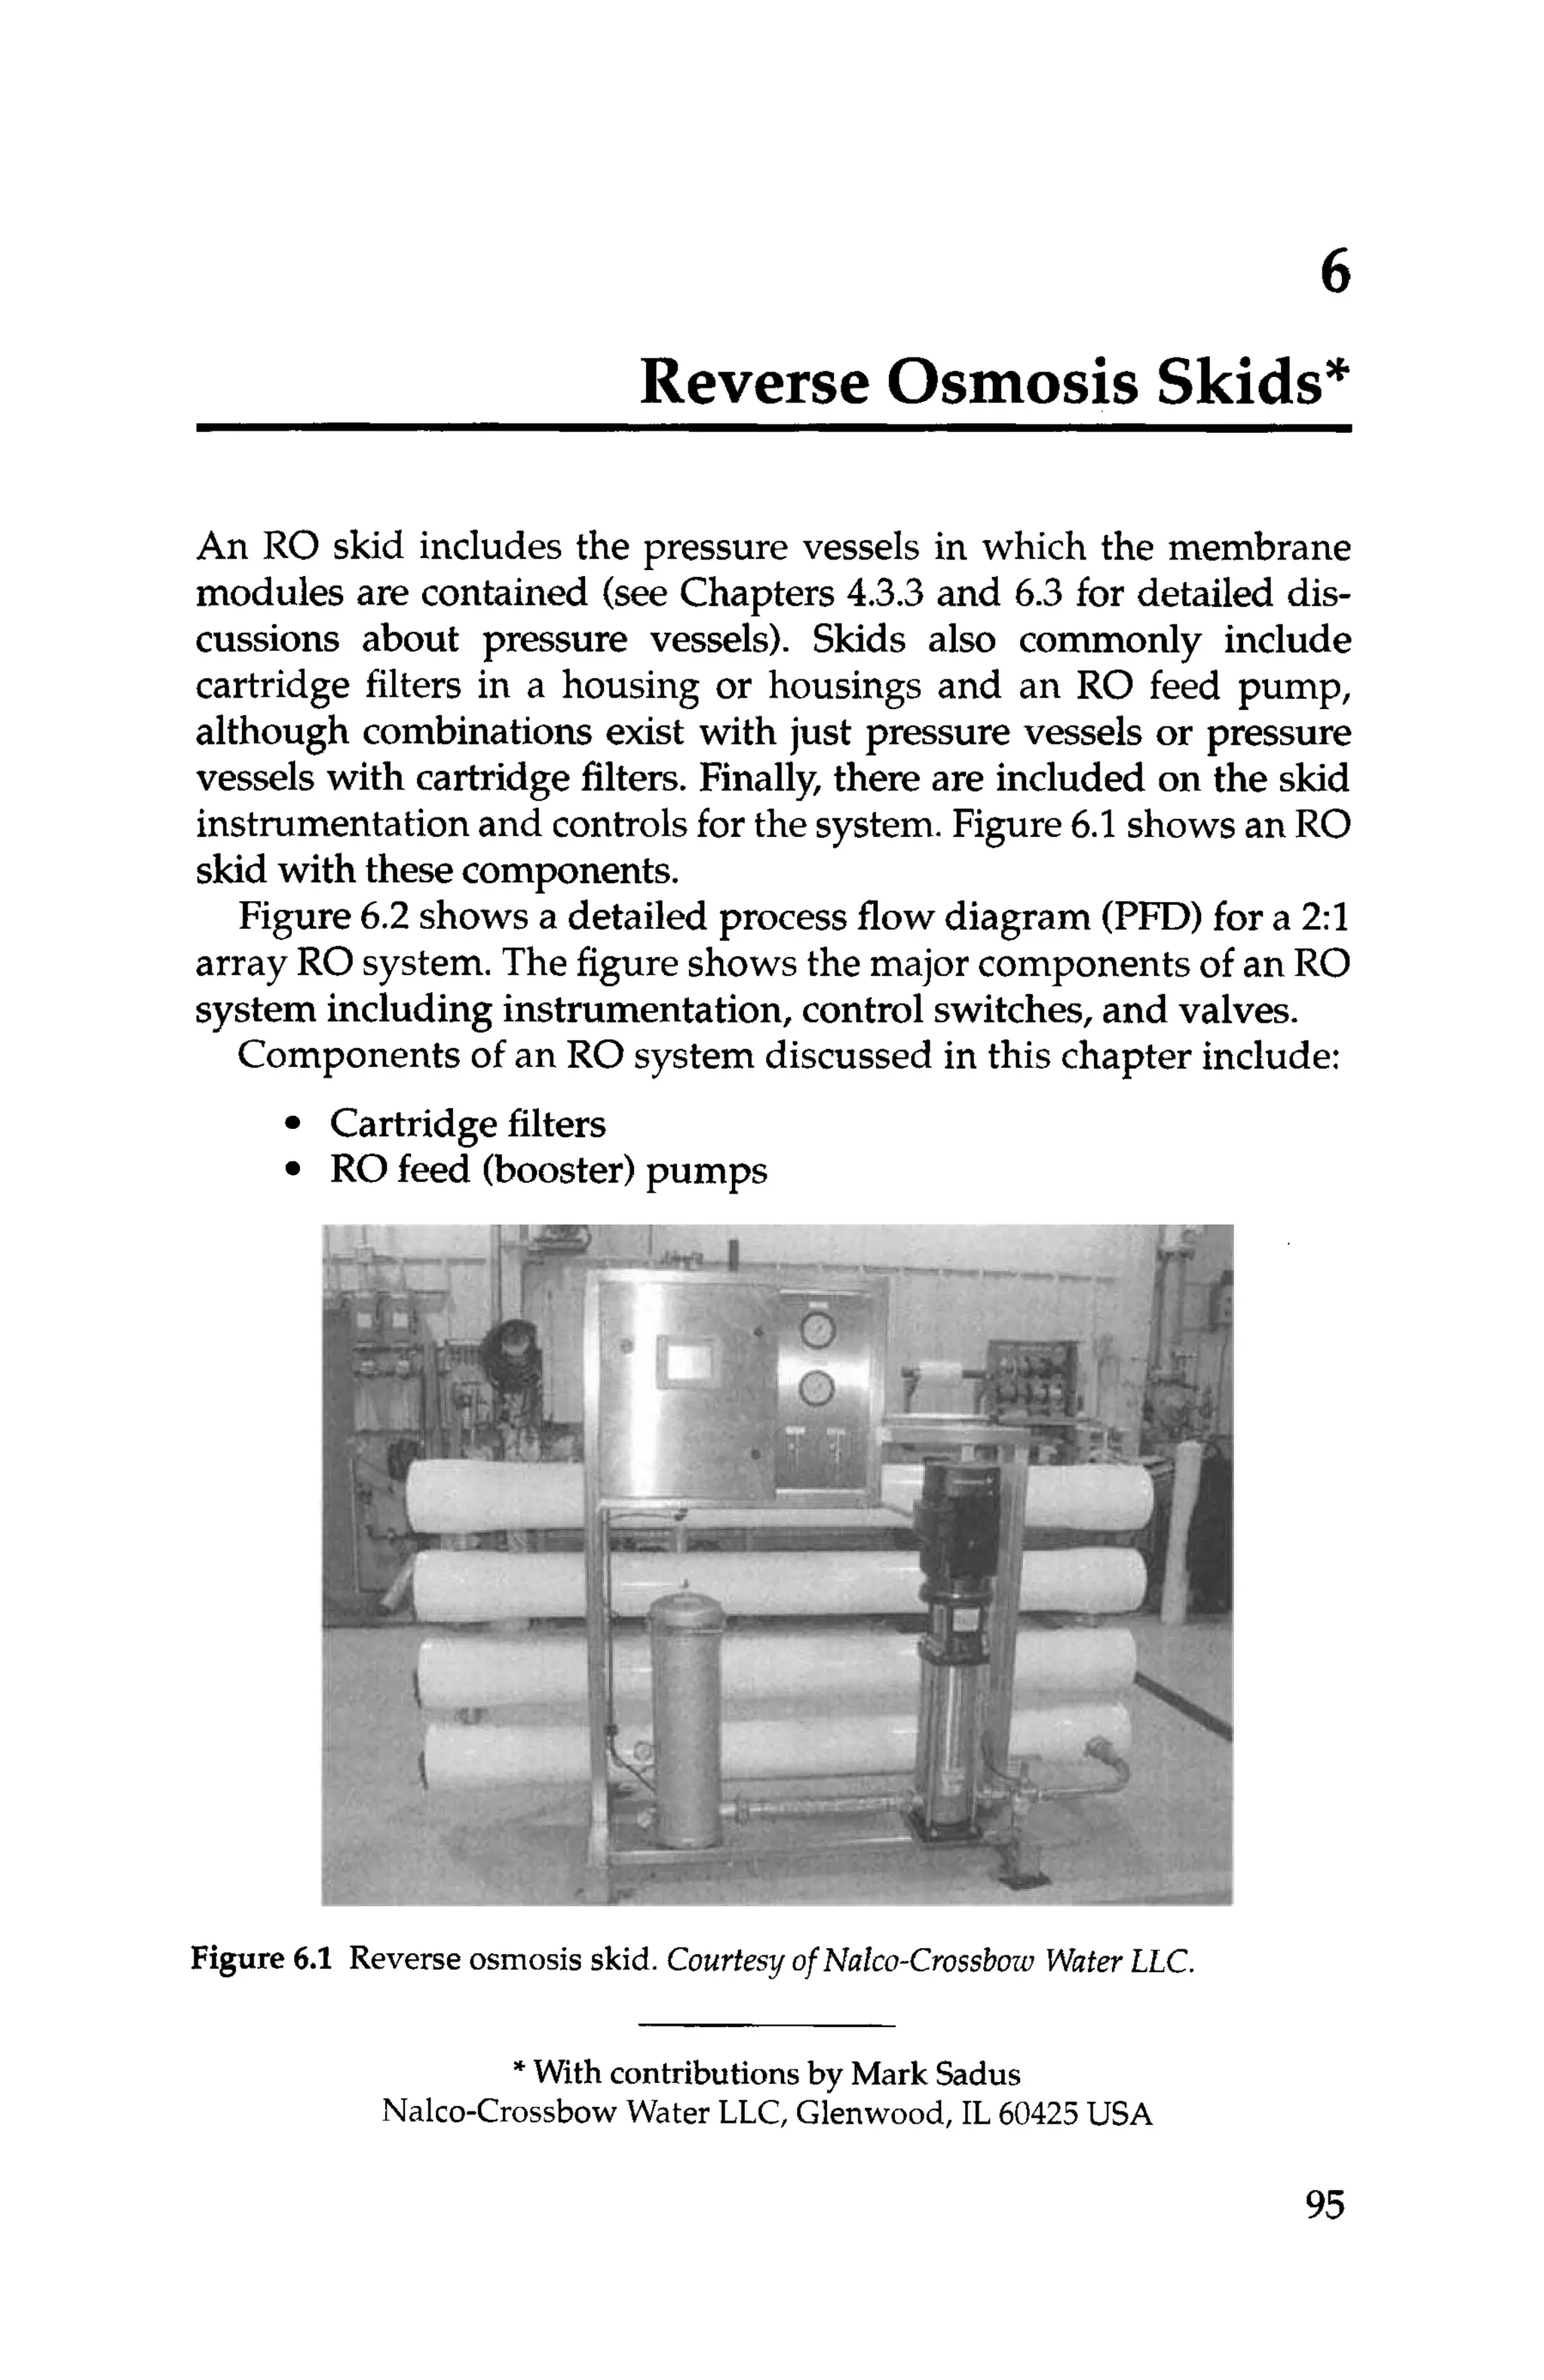
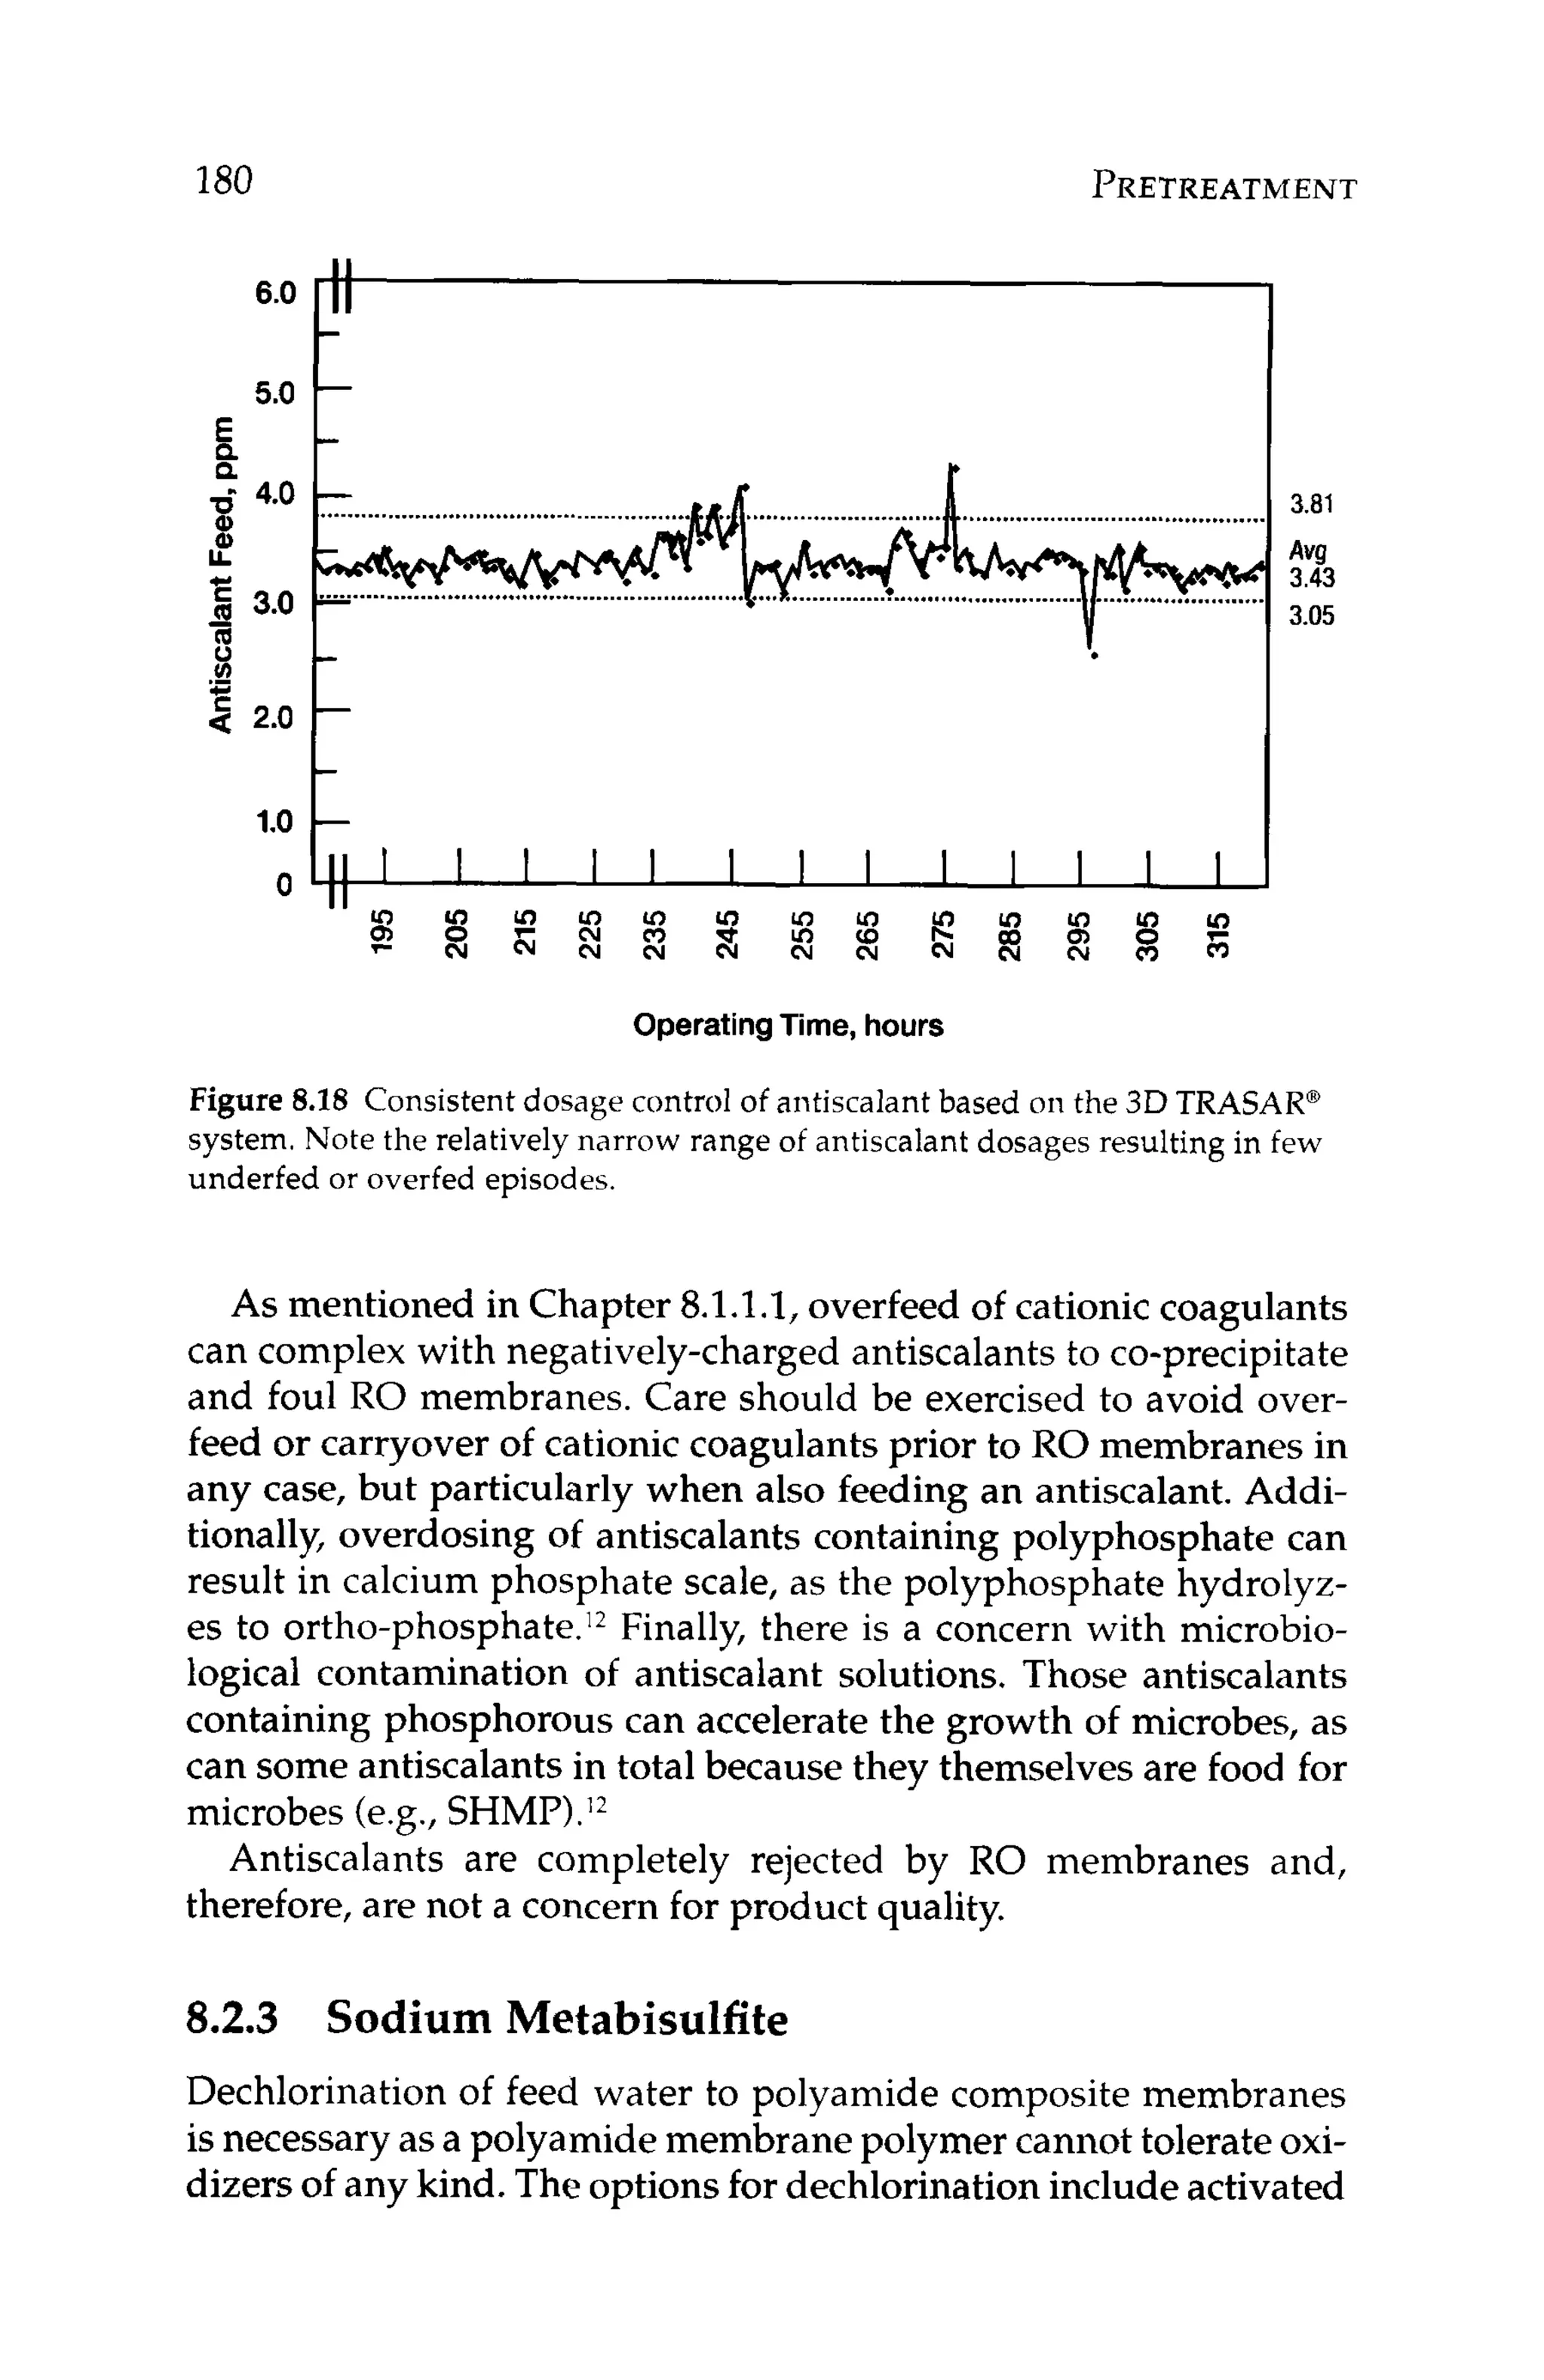
In practice, the recovery of the RO system is adjusted using
the flow control valve located on the RO concentrate stream (see
Figure 2.6).Throttlingthe valve will result in higher operating pres-
sure, which forces more water through the membrane as opposed
to down along the feed/concentrate side of the membrane, and
results in higher recovery.
Therecovery of an ROsystem is fixed by the designer.Exceeding
the design recovery can result in accelerated foulingand scaling of
the membranes, because less water is available to scour the mem-
brane on the concentrate side. Falling below the design recovery
will not adversely impact membrane fouling or scaling, but will
result in higher volumes of wastewater from the RO system.
3.3 Rejection
Rejection is a term used to describe what percentage of an influent
species a membrane retains. For example, 98% rejection of silica
means that the membrane will retain 98% of the influent silica. It
alsomeans that 2%of influentsilica will pass through the membrane
into the permeate (known as "salt passage").
Rejection of a given species is calculated using the following
equation:
(3.2)
% Rejection = [(C,
- Cp)/C,]
* 100
C,= influent concentrationof a specific component
Cp= permeate concentrationof a specific component
where:](https://image.slidesharecdn.com/reverseosmosispdf-230430025016-321d174f/75/Reverse_Osmosis_pdf-pdf-45-2048.jpg)


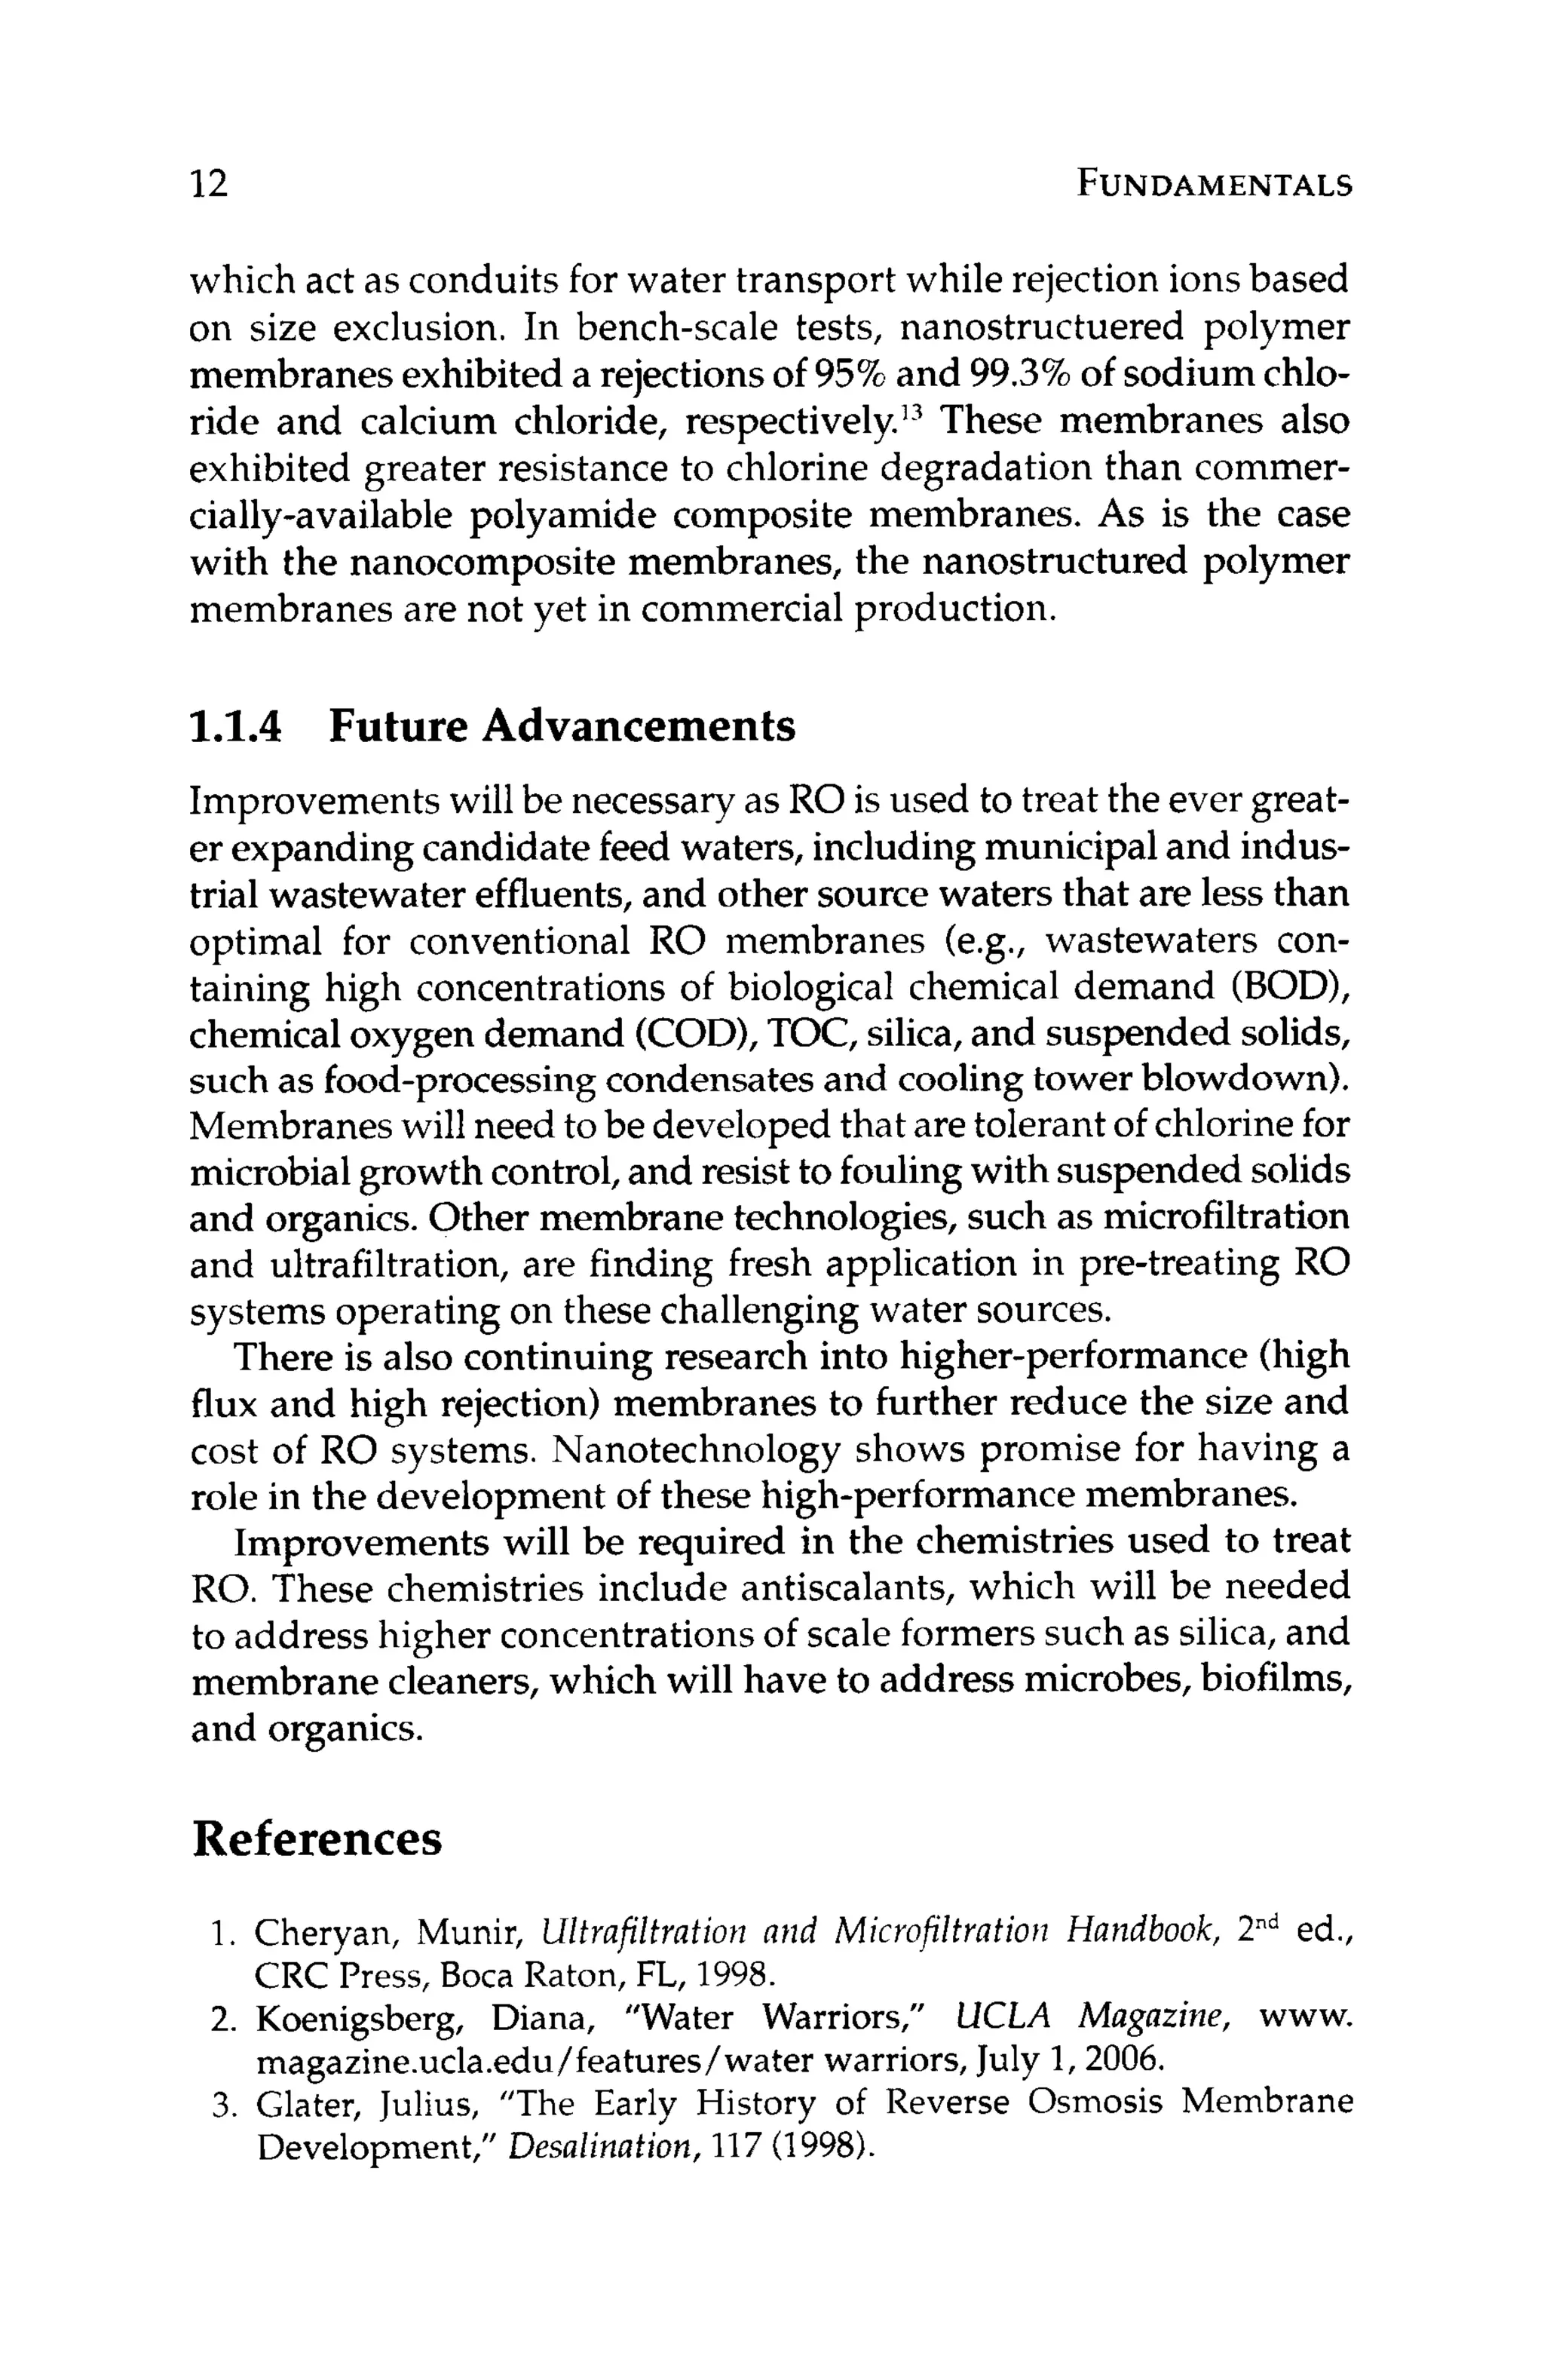
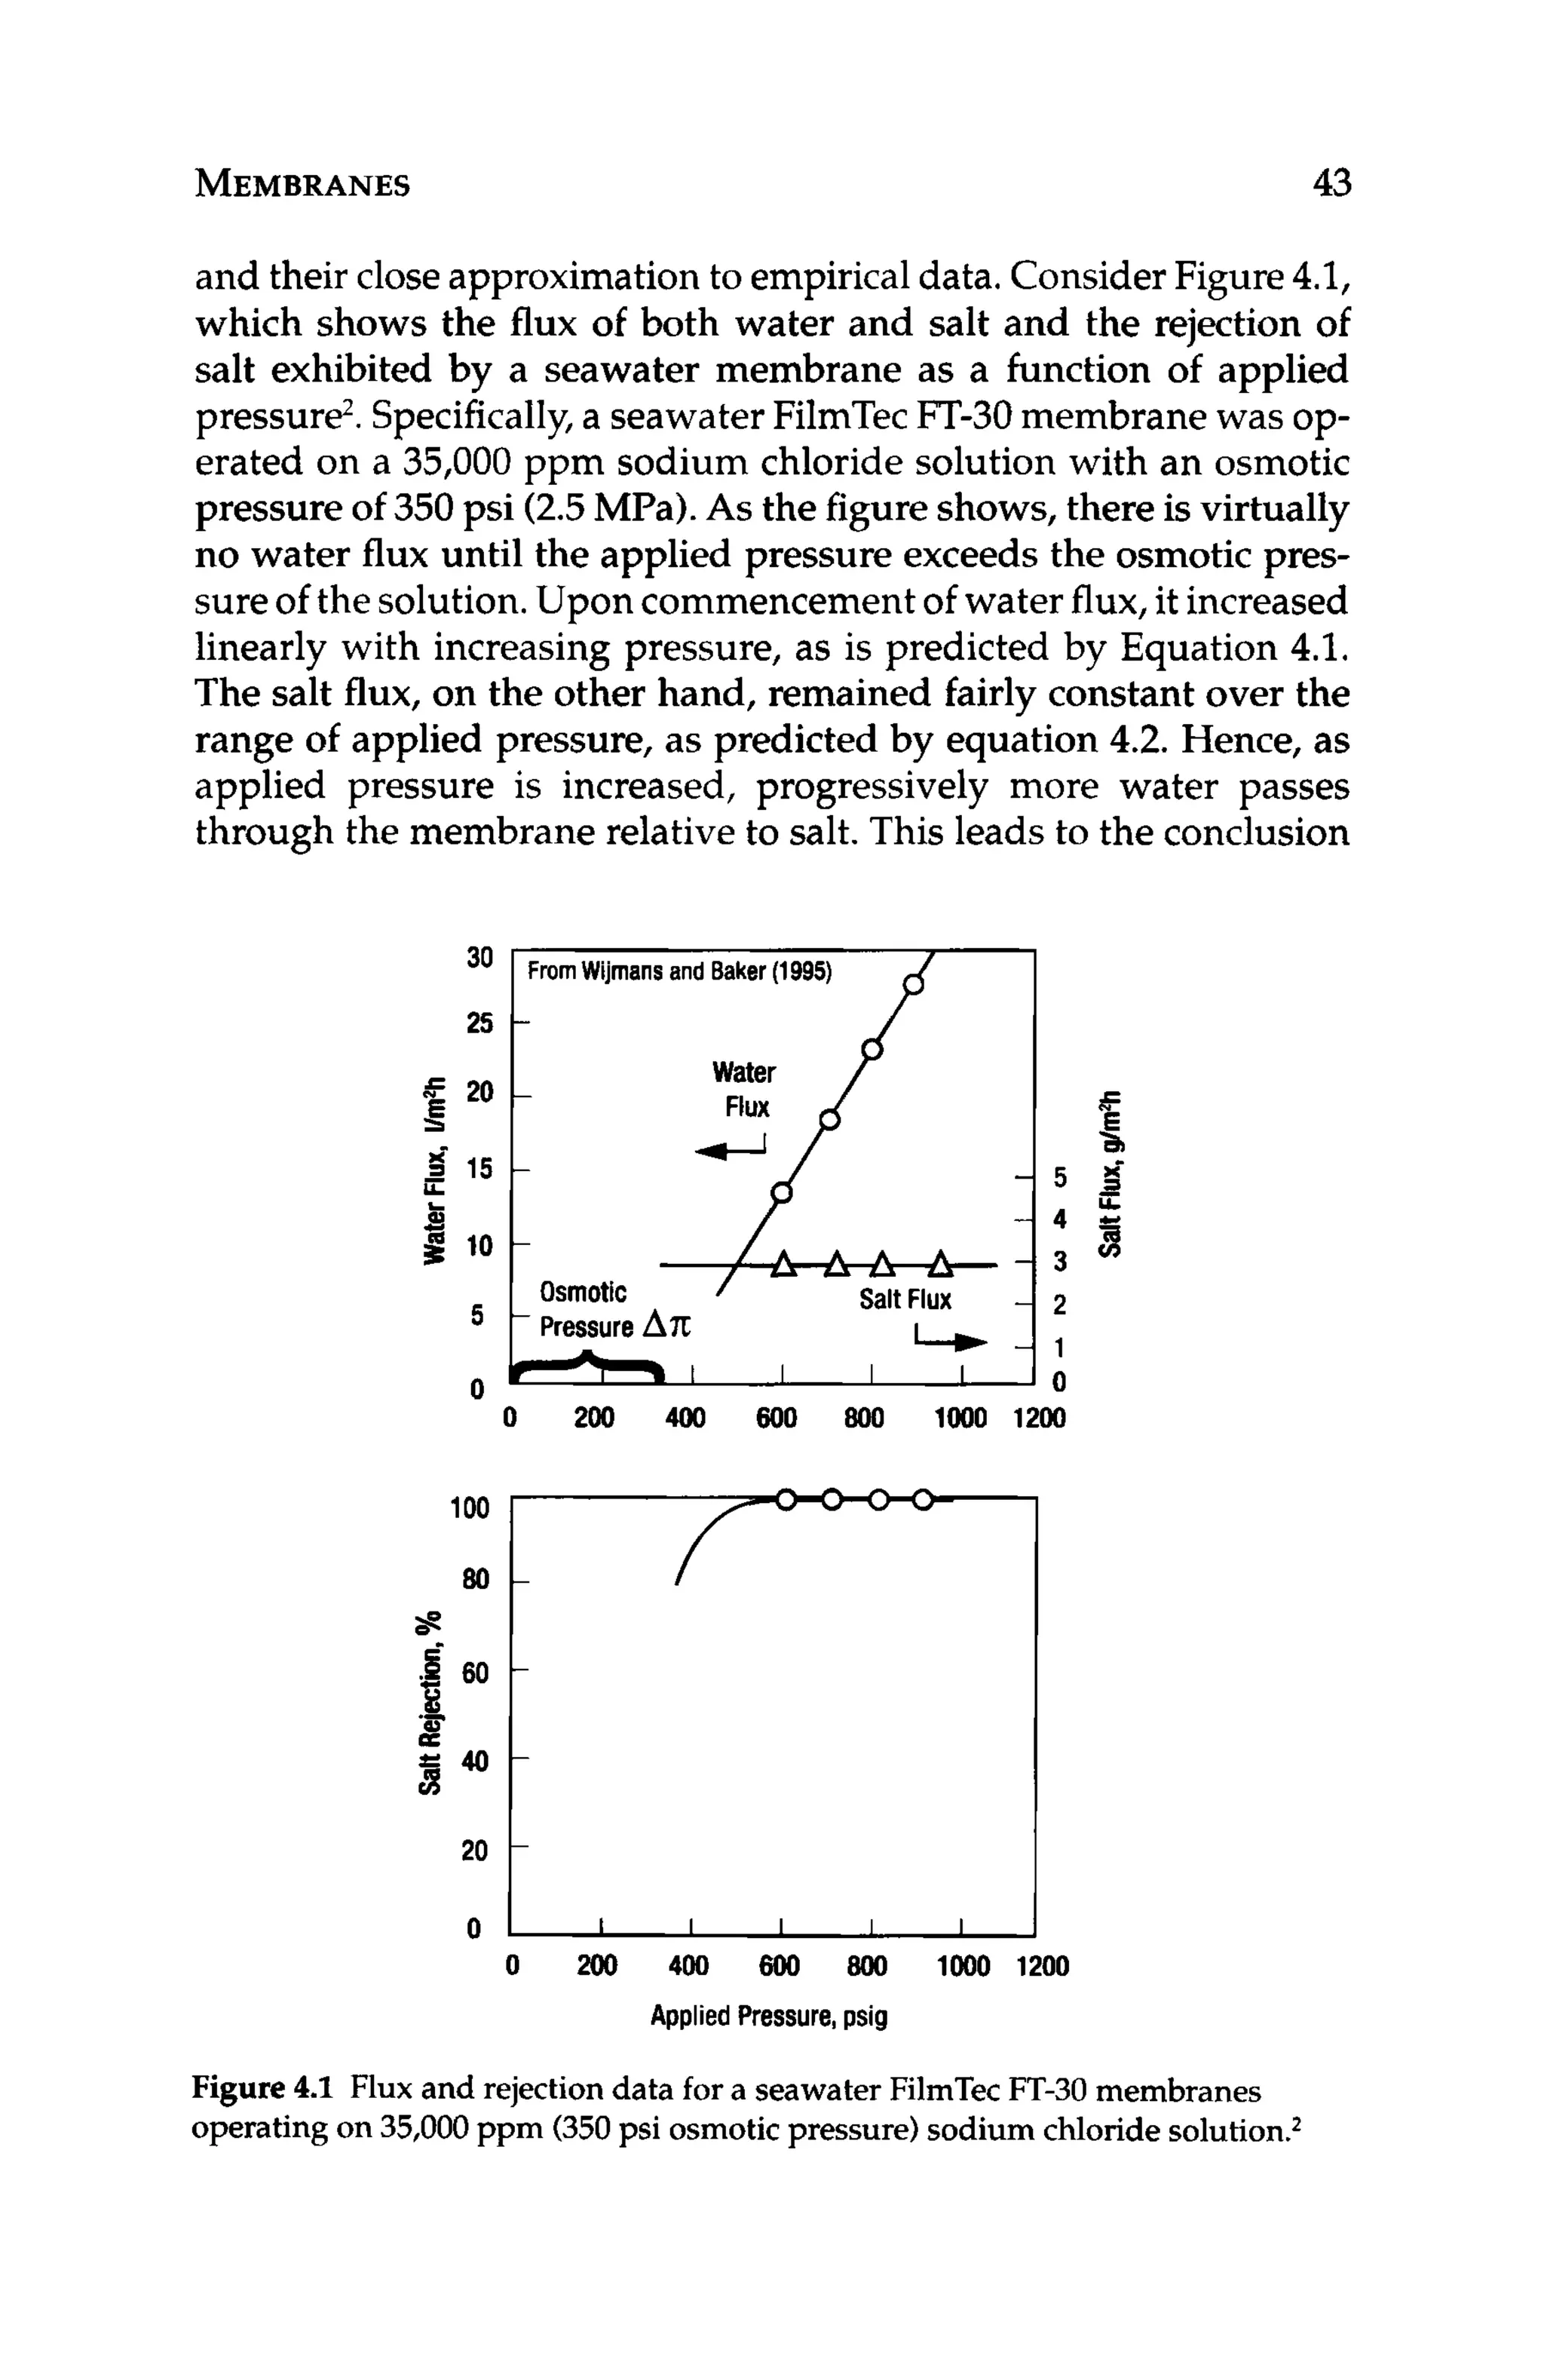
![34 FUNDAMENTALS
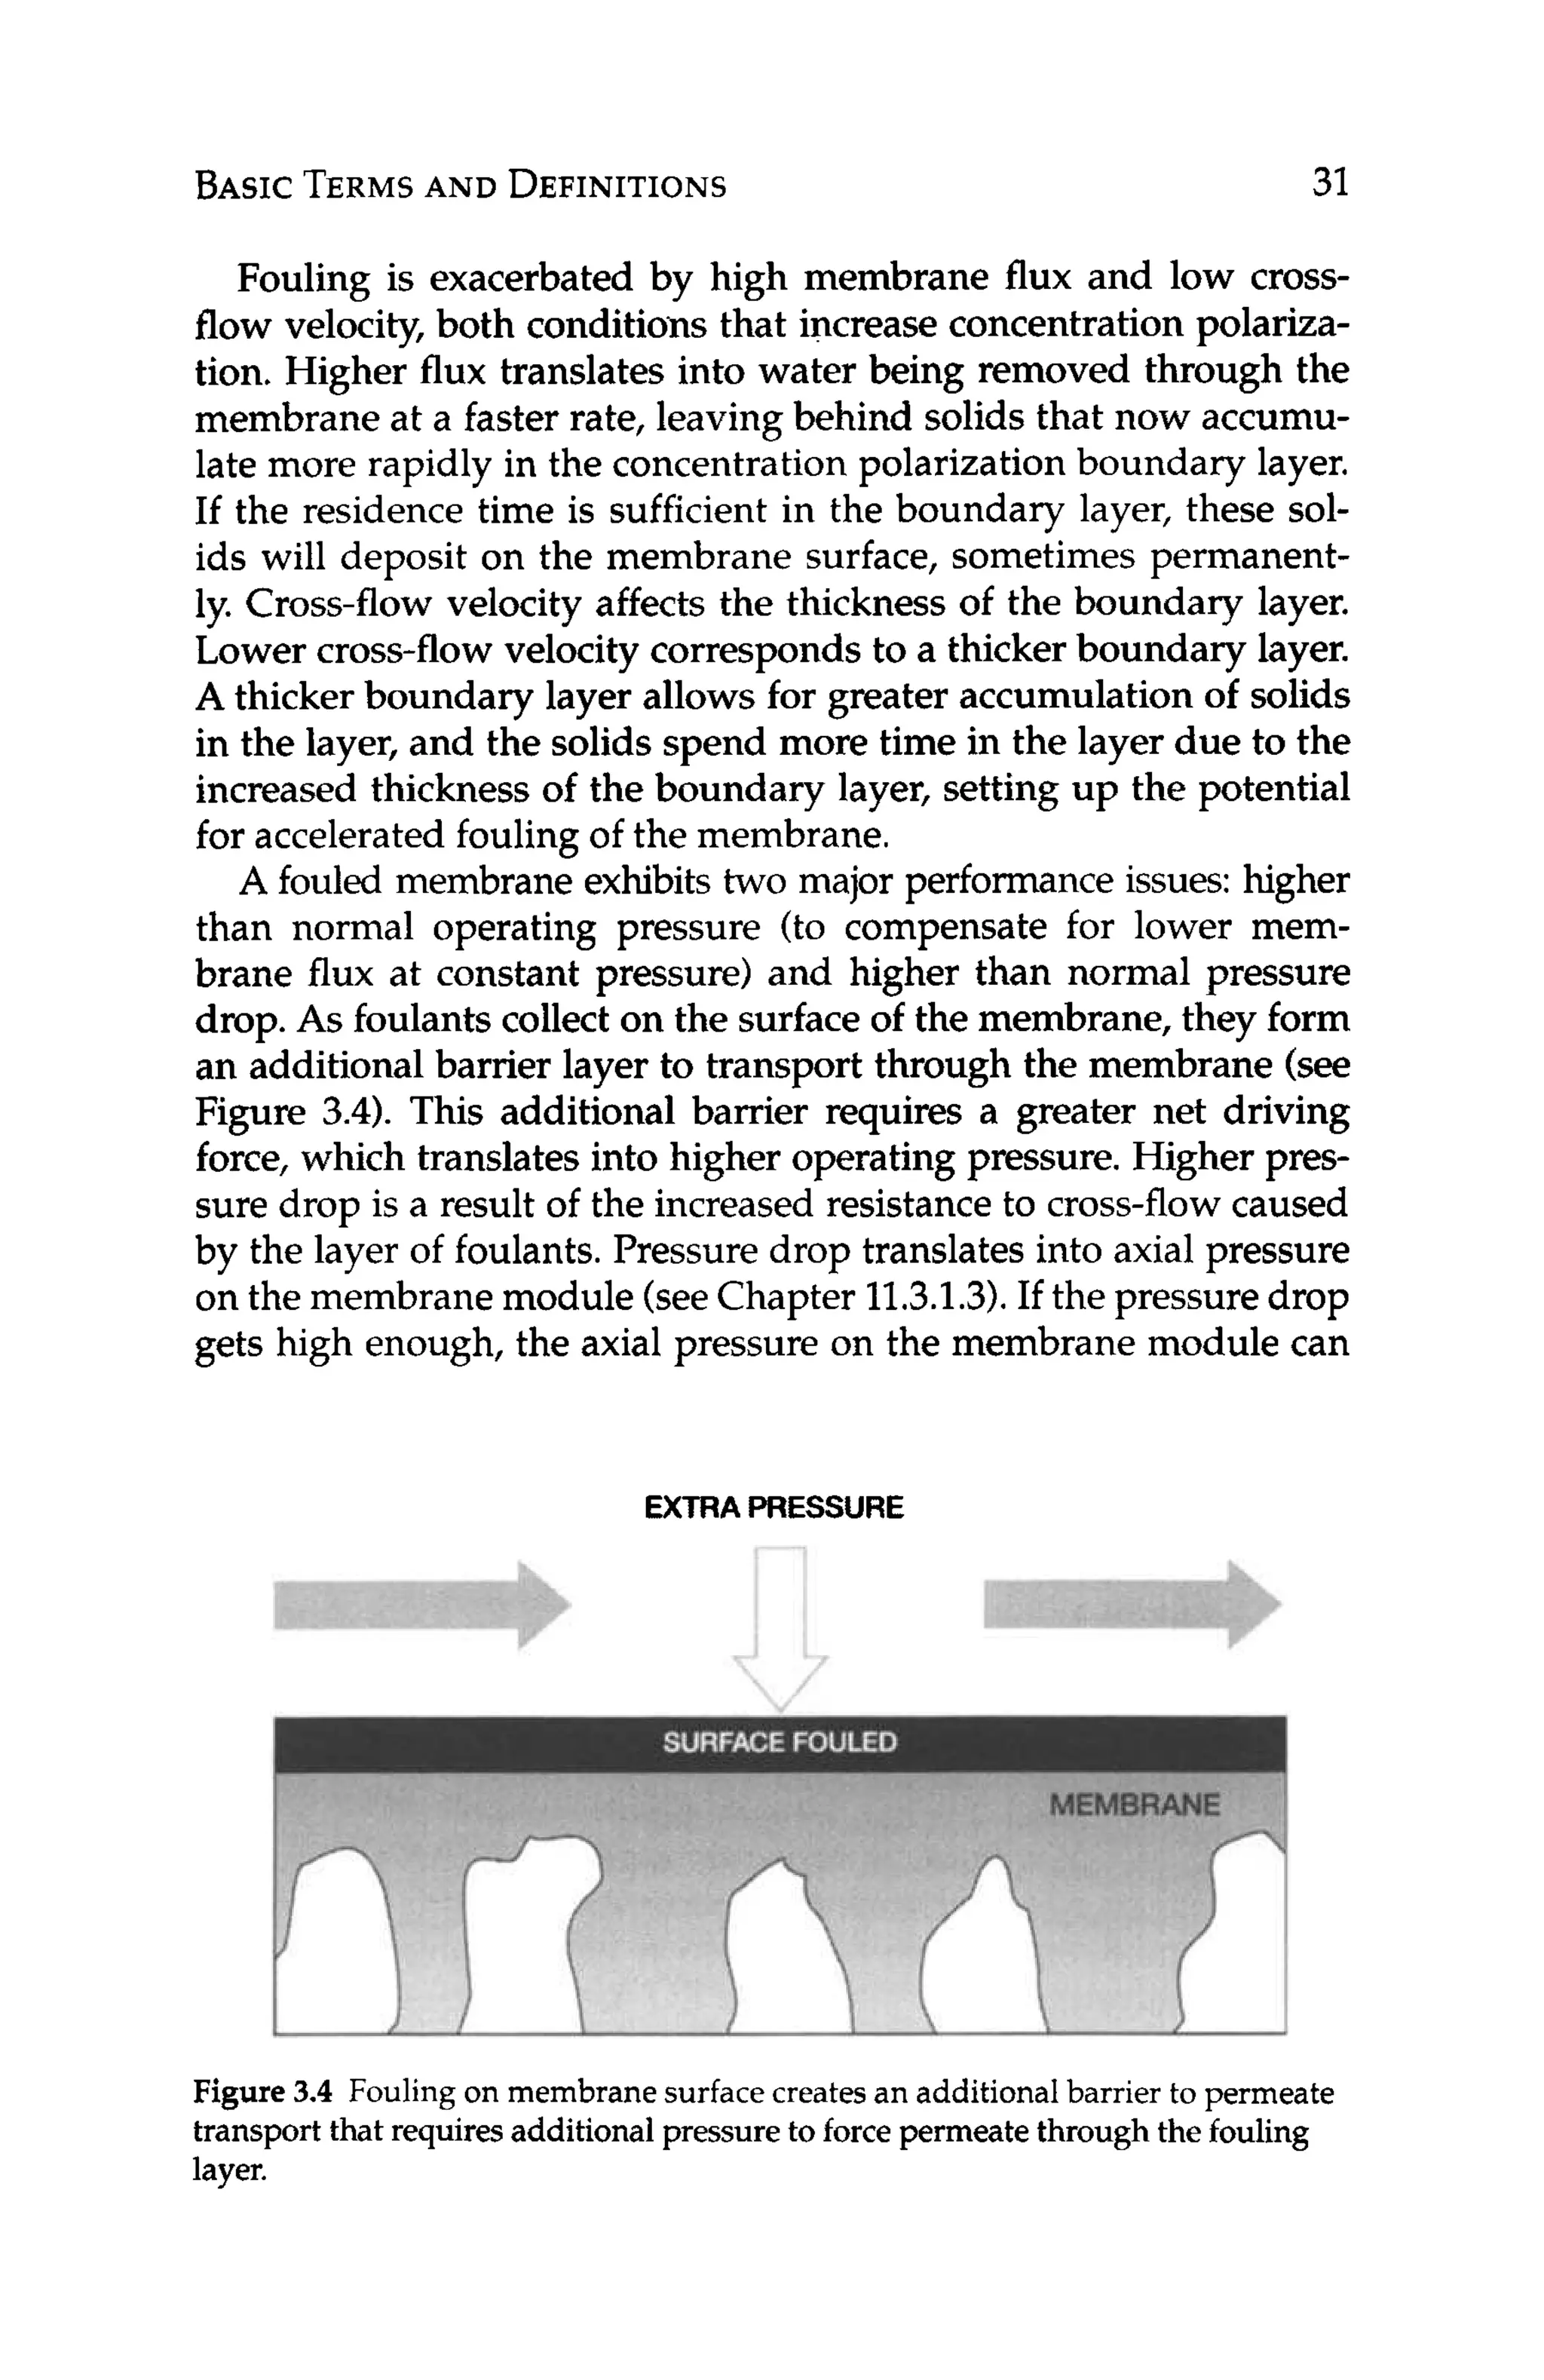
Ascaledmembraneexhibitsthreemajorperformanceissues:high-
er than normal operating pressure (to compensate for lower flux at
constant pressure), higher pressure drop, and lower than expected
salt rejection. As with fouled membranes, scale forms an additional
barrier layer through which water has to travel. Additional driving
force is required to push water through this barrier layer if the same
productivity is to be maintained. Higher pressure drop is due to re-
sistance of the scale to cross flow. Lower salt rejection is a function
of concentrationpolarization,in that the concentrationof the scaled
mineral is higher at the membrane surfacethan in the bulk solution.
Thus, the membrane "sees" a higher concentration, and, although
the intrinsicrejection by the membrane remains constant,the actual
amount of a solute that passes through the membrane is greater (see
Equation 4.2, which predicts that the flux of a solute through an RO
membrane is a functionof the concentrationdifferencebetween the
solute in the boundary layer and in the permeate).Hence, the appar-
ent rejection is lower and product purity is lower.
Since scaling is a concentration phenomenon, it goes to reason
that scale would be most likely found in the last stages of an RO
system where the concentrationof salts is the highest. To determine
the potential for a salt to form scale, the ion product of the salt in
question (taken in the reject stream) is compared with the solubility
product for the salt under the conditions in the reject.
Equation 3.7defines the ion product at any degree of saturation:
IP = [cati~n]~[anion]~ (3.7)
Where:
IP = ion product
[cation]= cation concentration
[anion] = anion concentration
Superscripts:
a = the quantity of cation present within the salt
b = the quantity of anion present within the salt.
Equation 3.8defines the solubility product at saturation:
KSp= [cationIa[anionlb
where:
KSP
= solubility product
[cation]= cation concentration
[anion]= anion concentration
(3.8)](https://image.slidesharecdn.com/reverseosmosispdf-230430025016-321d174f/75/Reverse_Osmosis_pdf-pdf-56-2048.jpg)
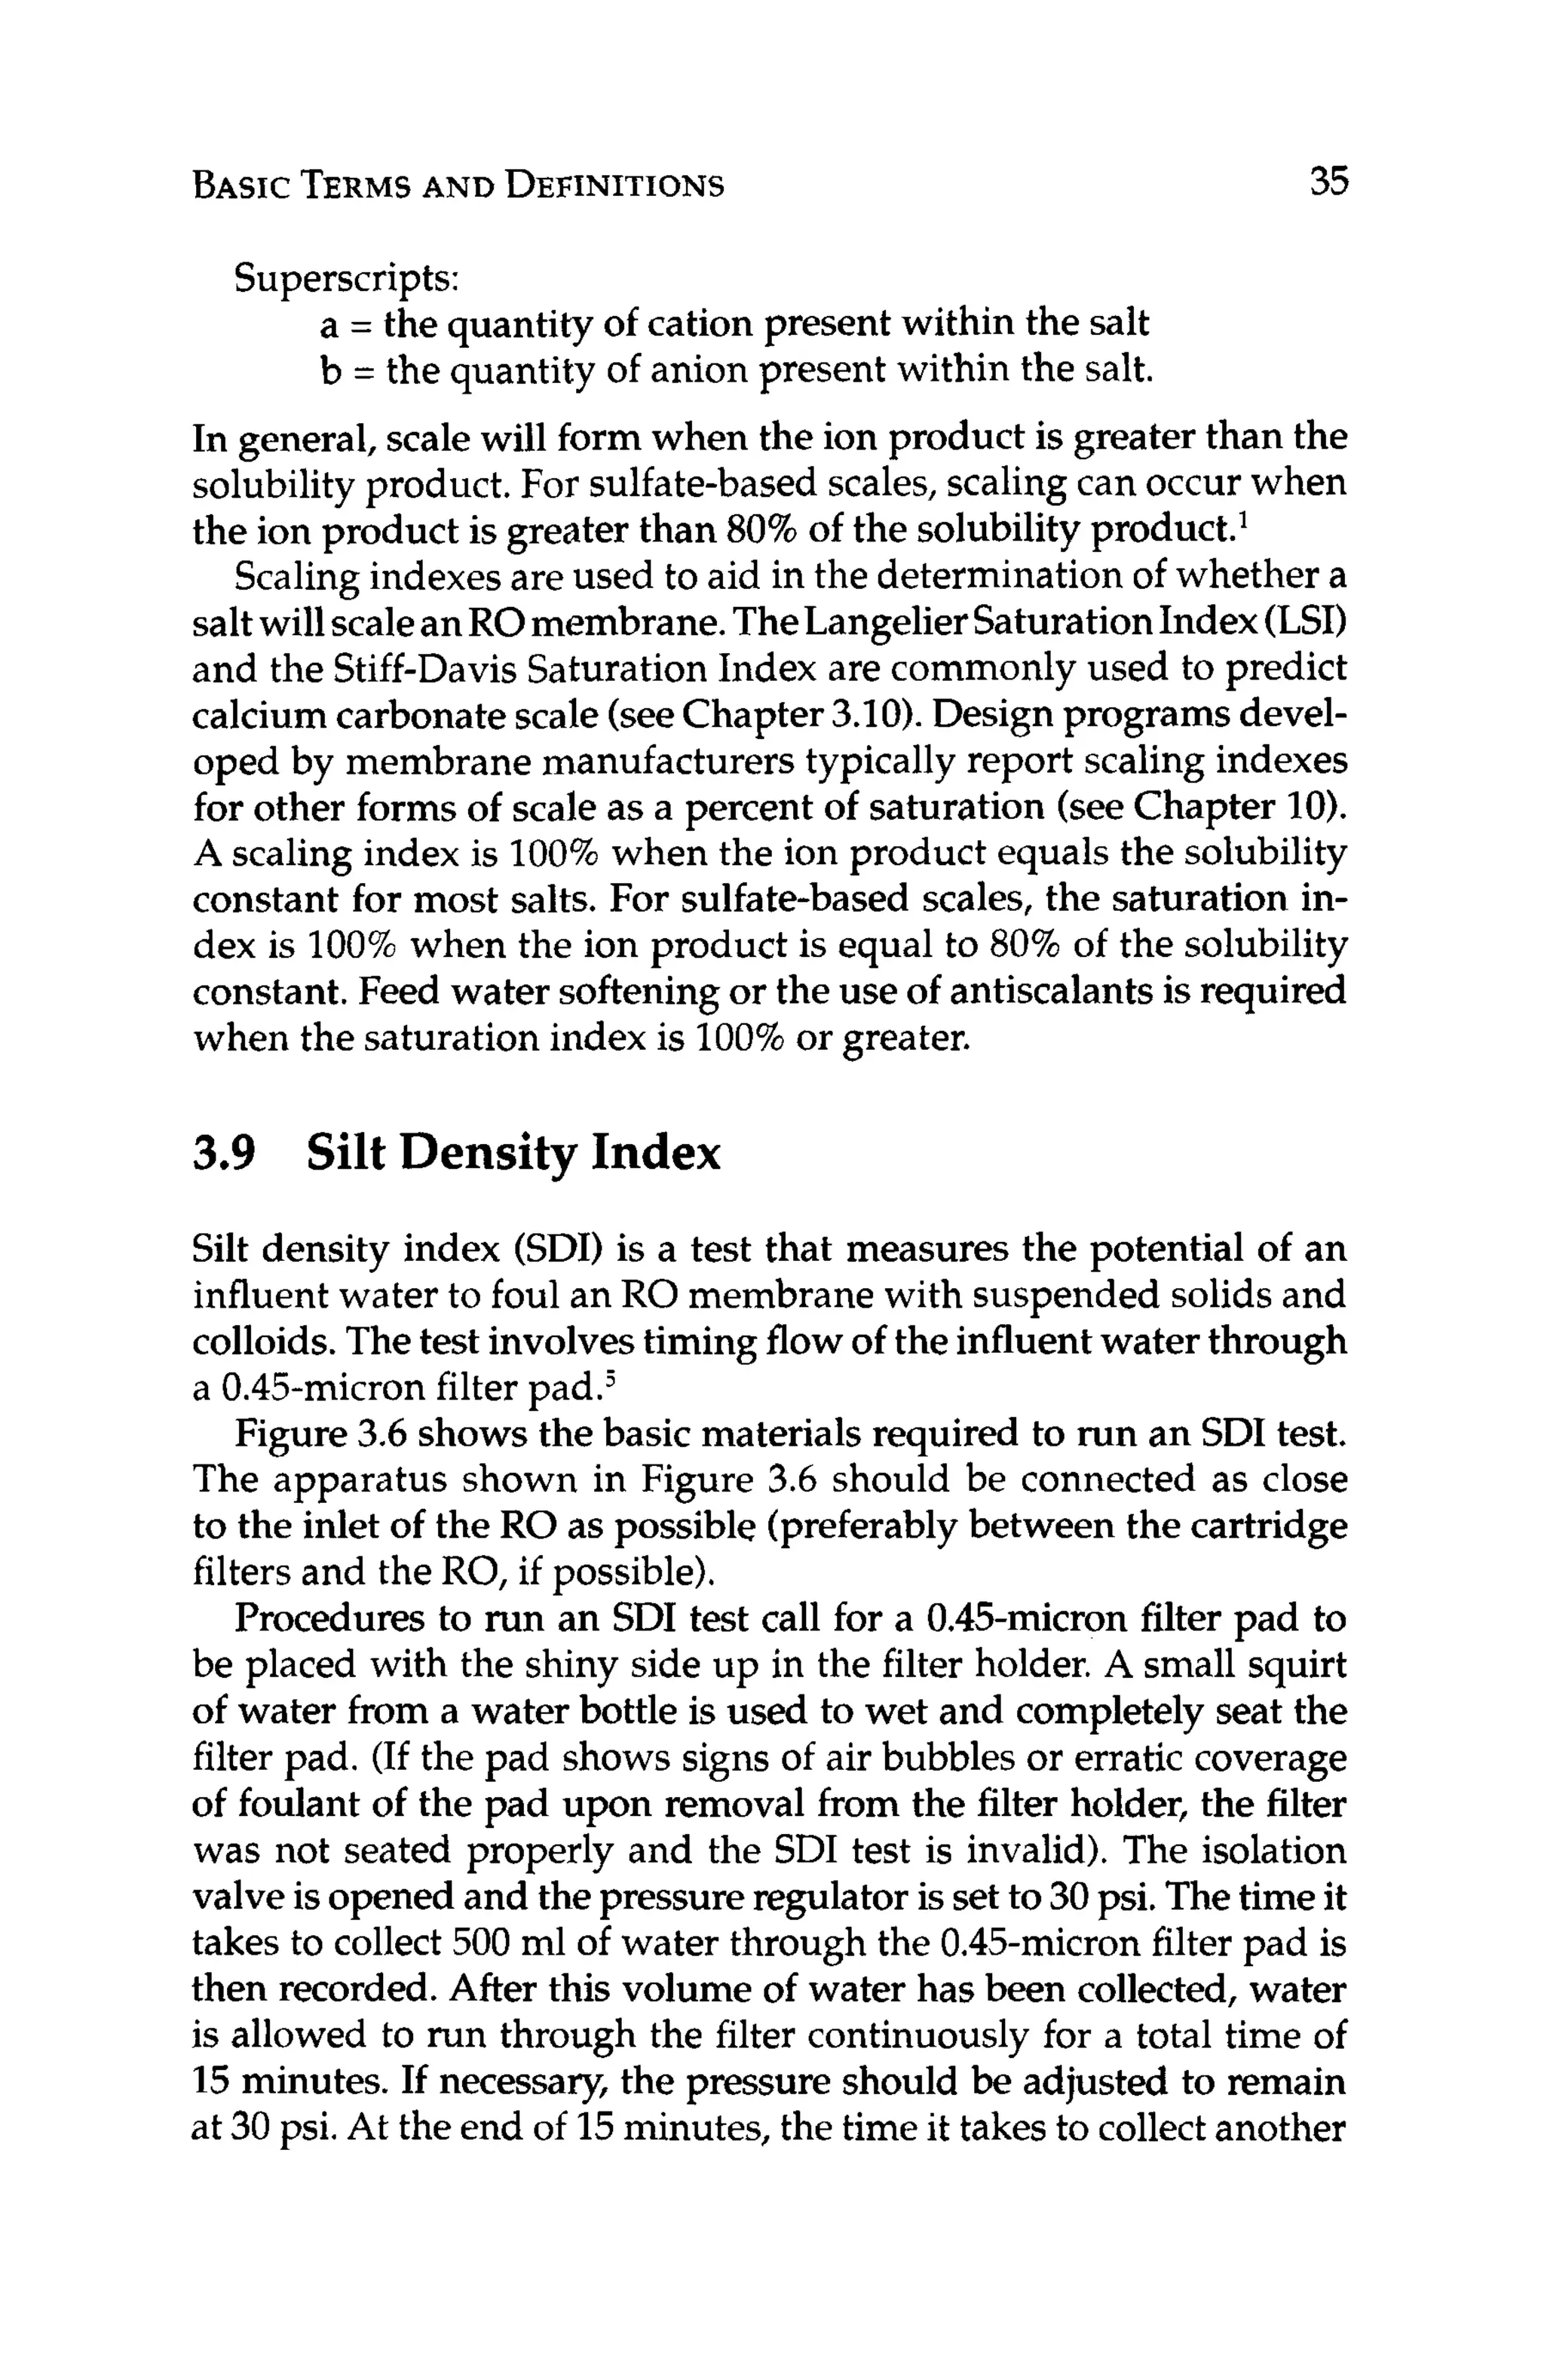
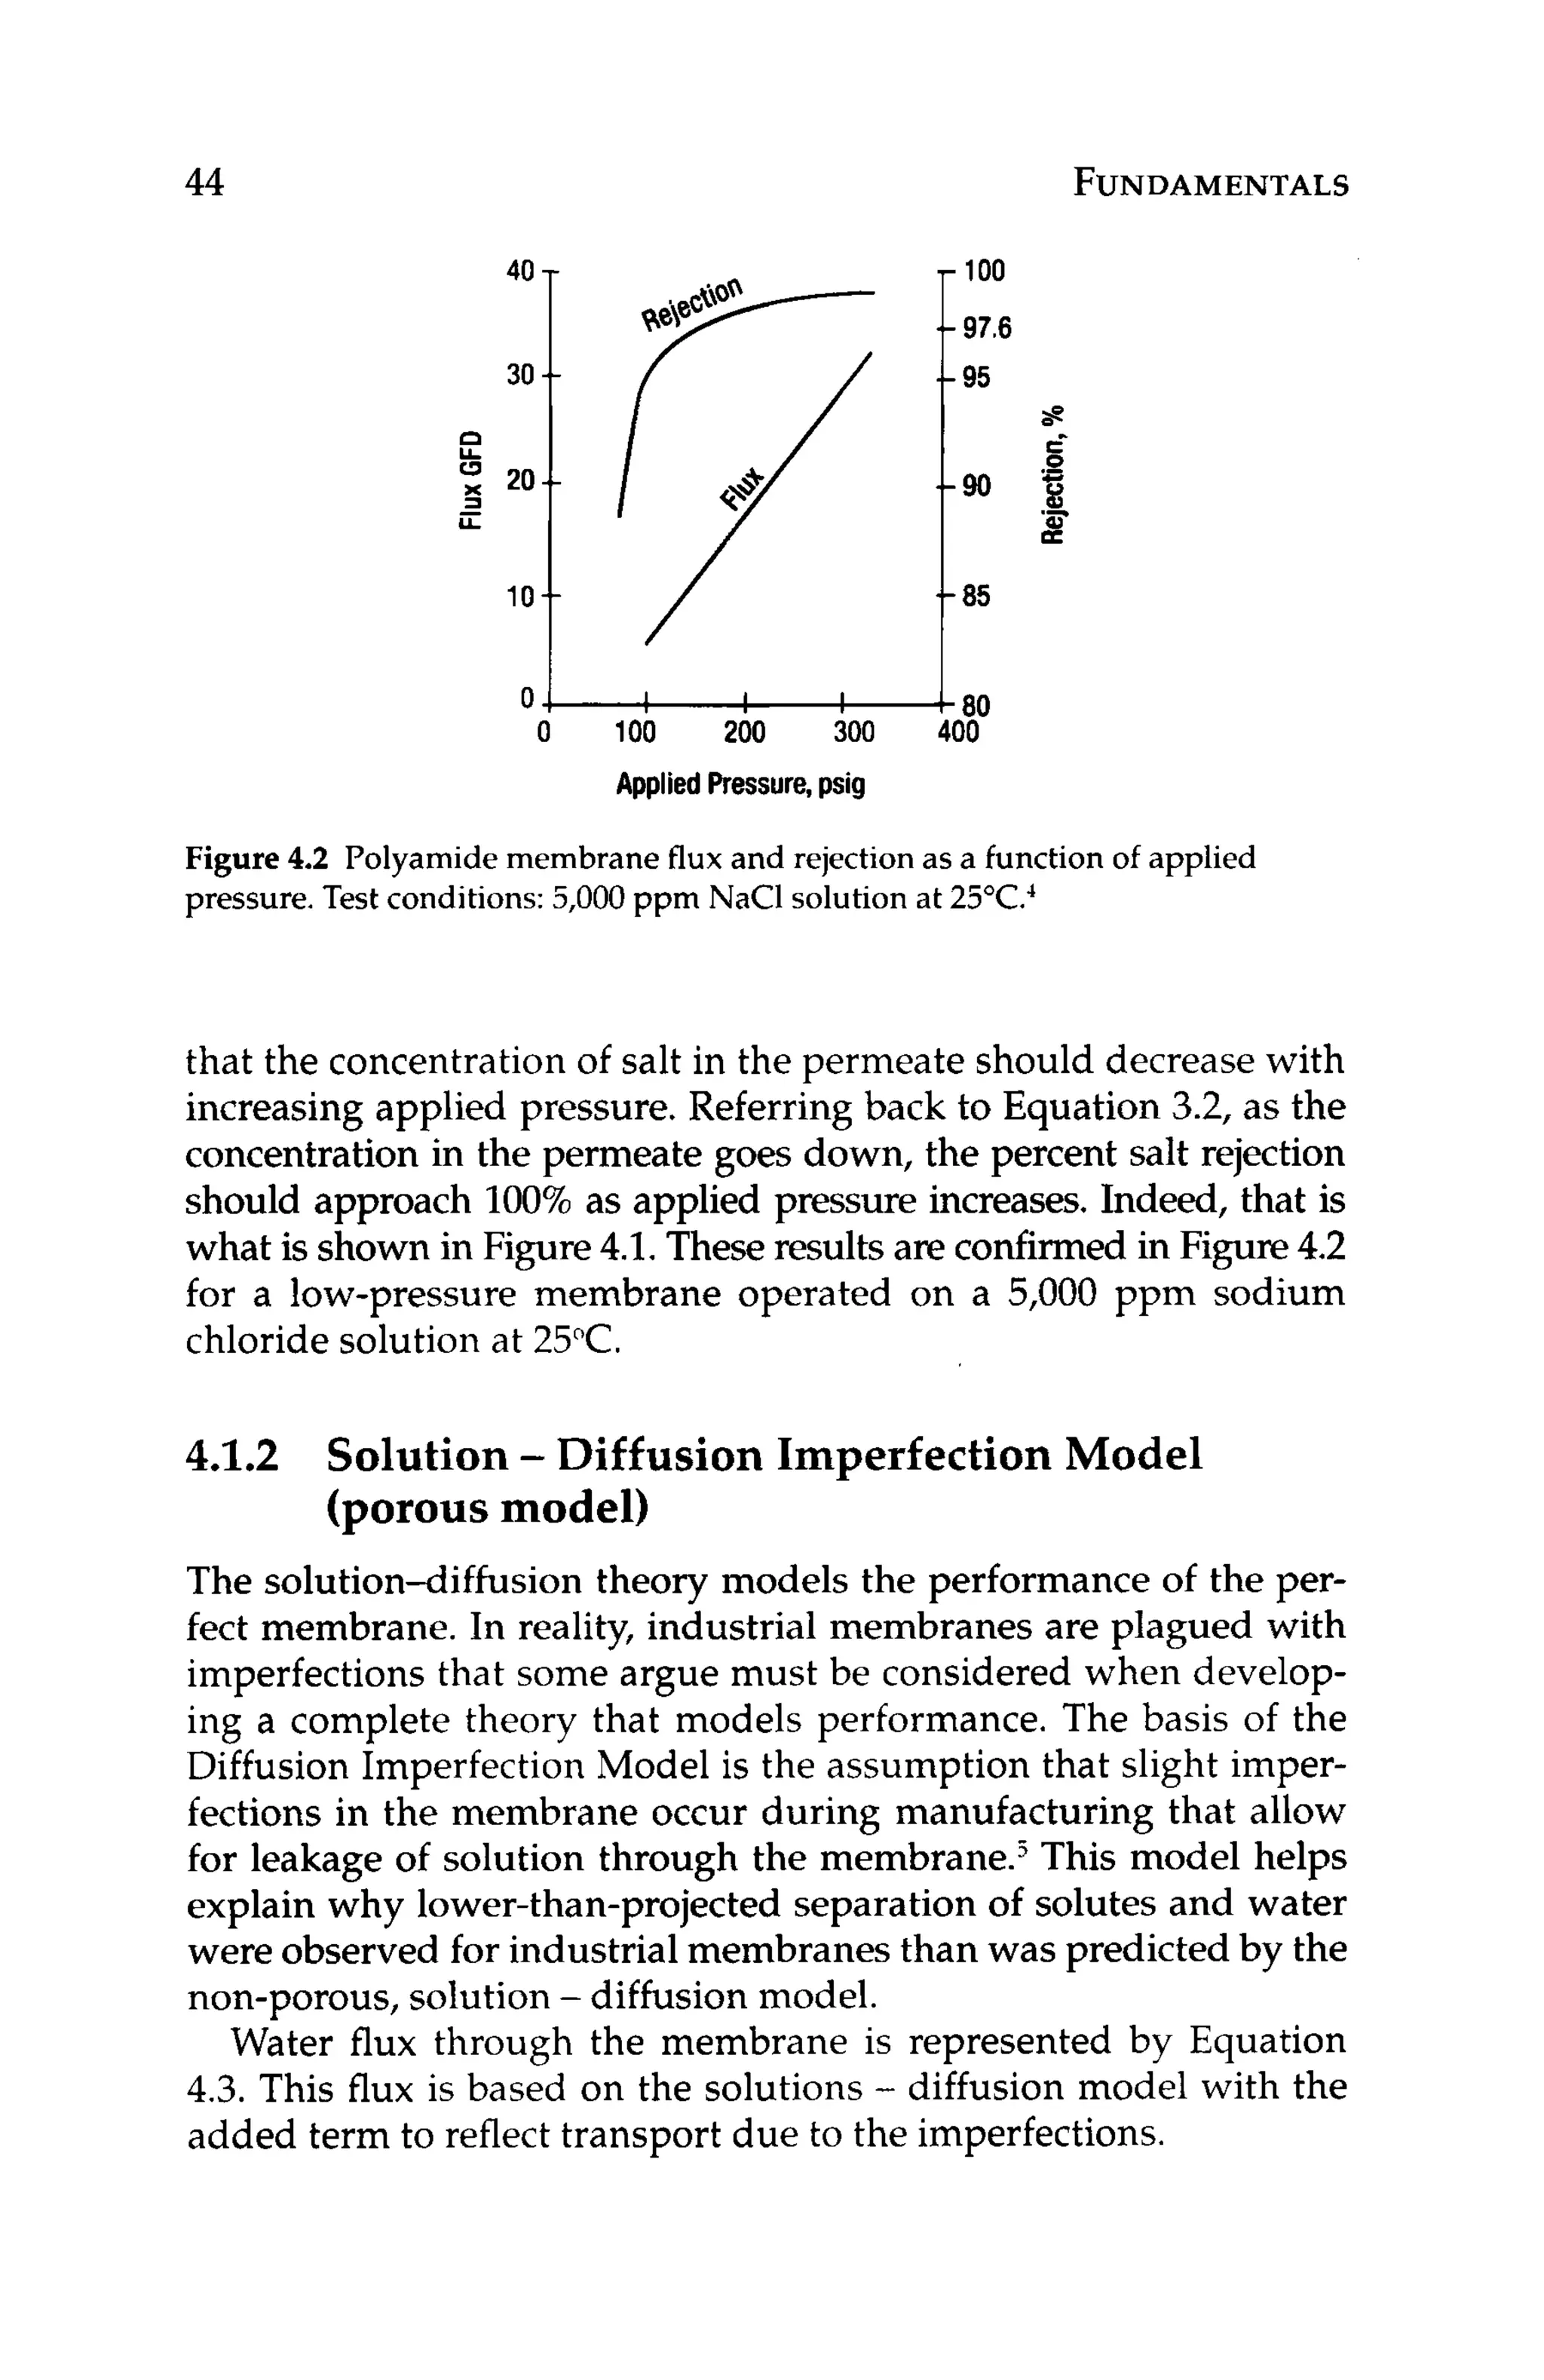
![38 FUNDAMENTALS
I
Figure 3.7 Silt density index pads taken before and after a filter treating RO
influent water.
The SDI filter pads can also be sent into a lab for analysis of the
deposit. The results of the deposit analysis will aid in the devel-
opment of an appropriate pretreatment scheme, as specific species
contributing to the suspended solids loading can be targeted for
treatment to reduce their concentration in the feed water to the RO.
3.10 Langelier Saturation Index
The Langelier Saturation Index (LSI) is a method for quantifying
the scalingor corrosion tendency of water. It was originally applied
to cooling water. The LSI is based on the pH and temperature of
the water in question as well as the concentrations of TDS, calcium
hardness, and alkalinity.
Langelier Saturation Index is calculated using equation 3.10:
LSI = pH - pHa
pH, = (9.30+ A + B) - (C + D)
(3.10)
where:
(3.11)
and:
A = (Log,,[TDSl - 1)/ 10, where [TDSIis in ppm
C = Log,,[Ca2+]
- 0.4, where [Ca”] is in ppm CaCO,
D = Log,,[alkalinityl, where [alkalinity]is in pprn CaCO,
B = -13.12 x Log,,(OC+ 273) + 34.55](https://image.slidesharecdn.com/reverseosmosispdf-230430025016-321d174f/75/Reverse_Osmosis_pdf-pdf-60-2048.jpg)
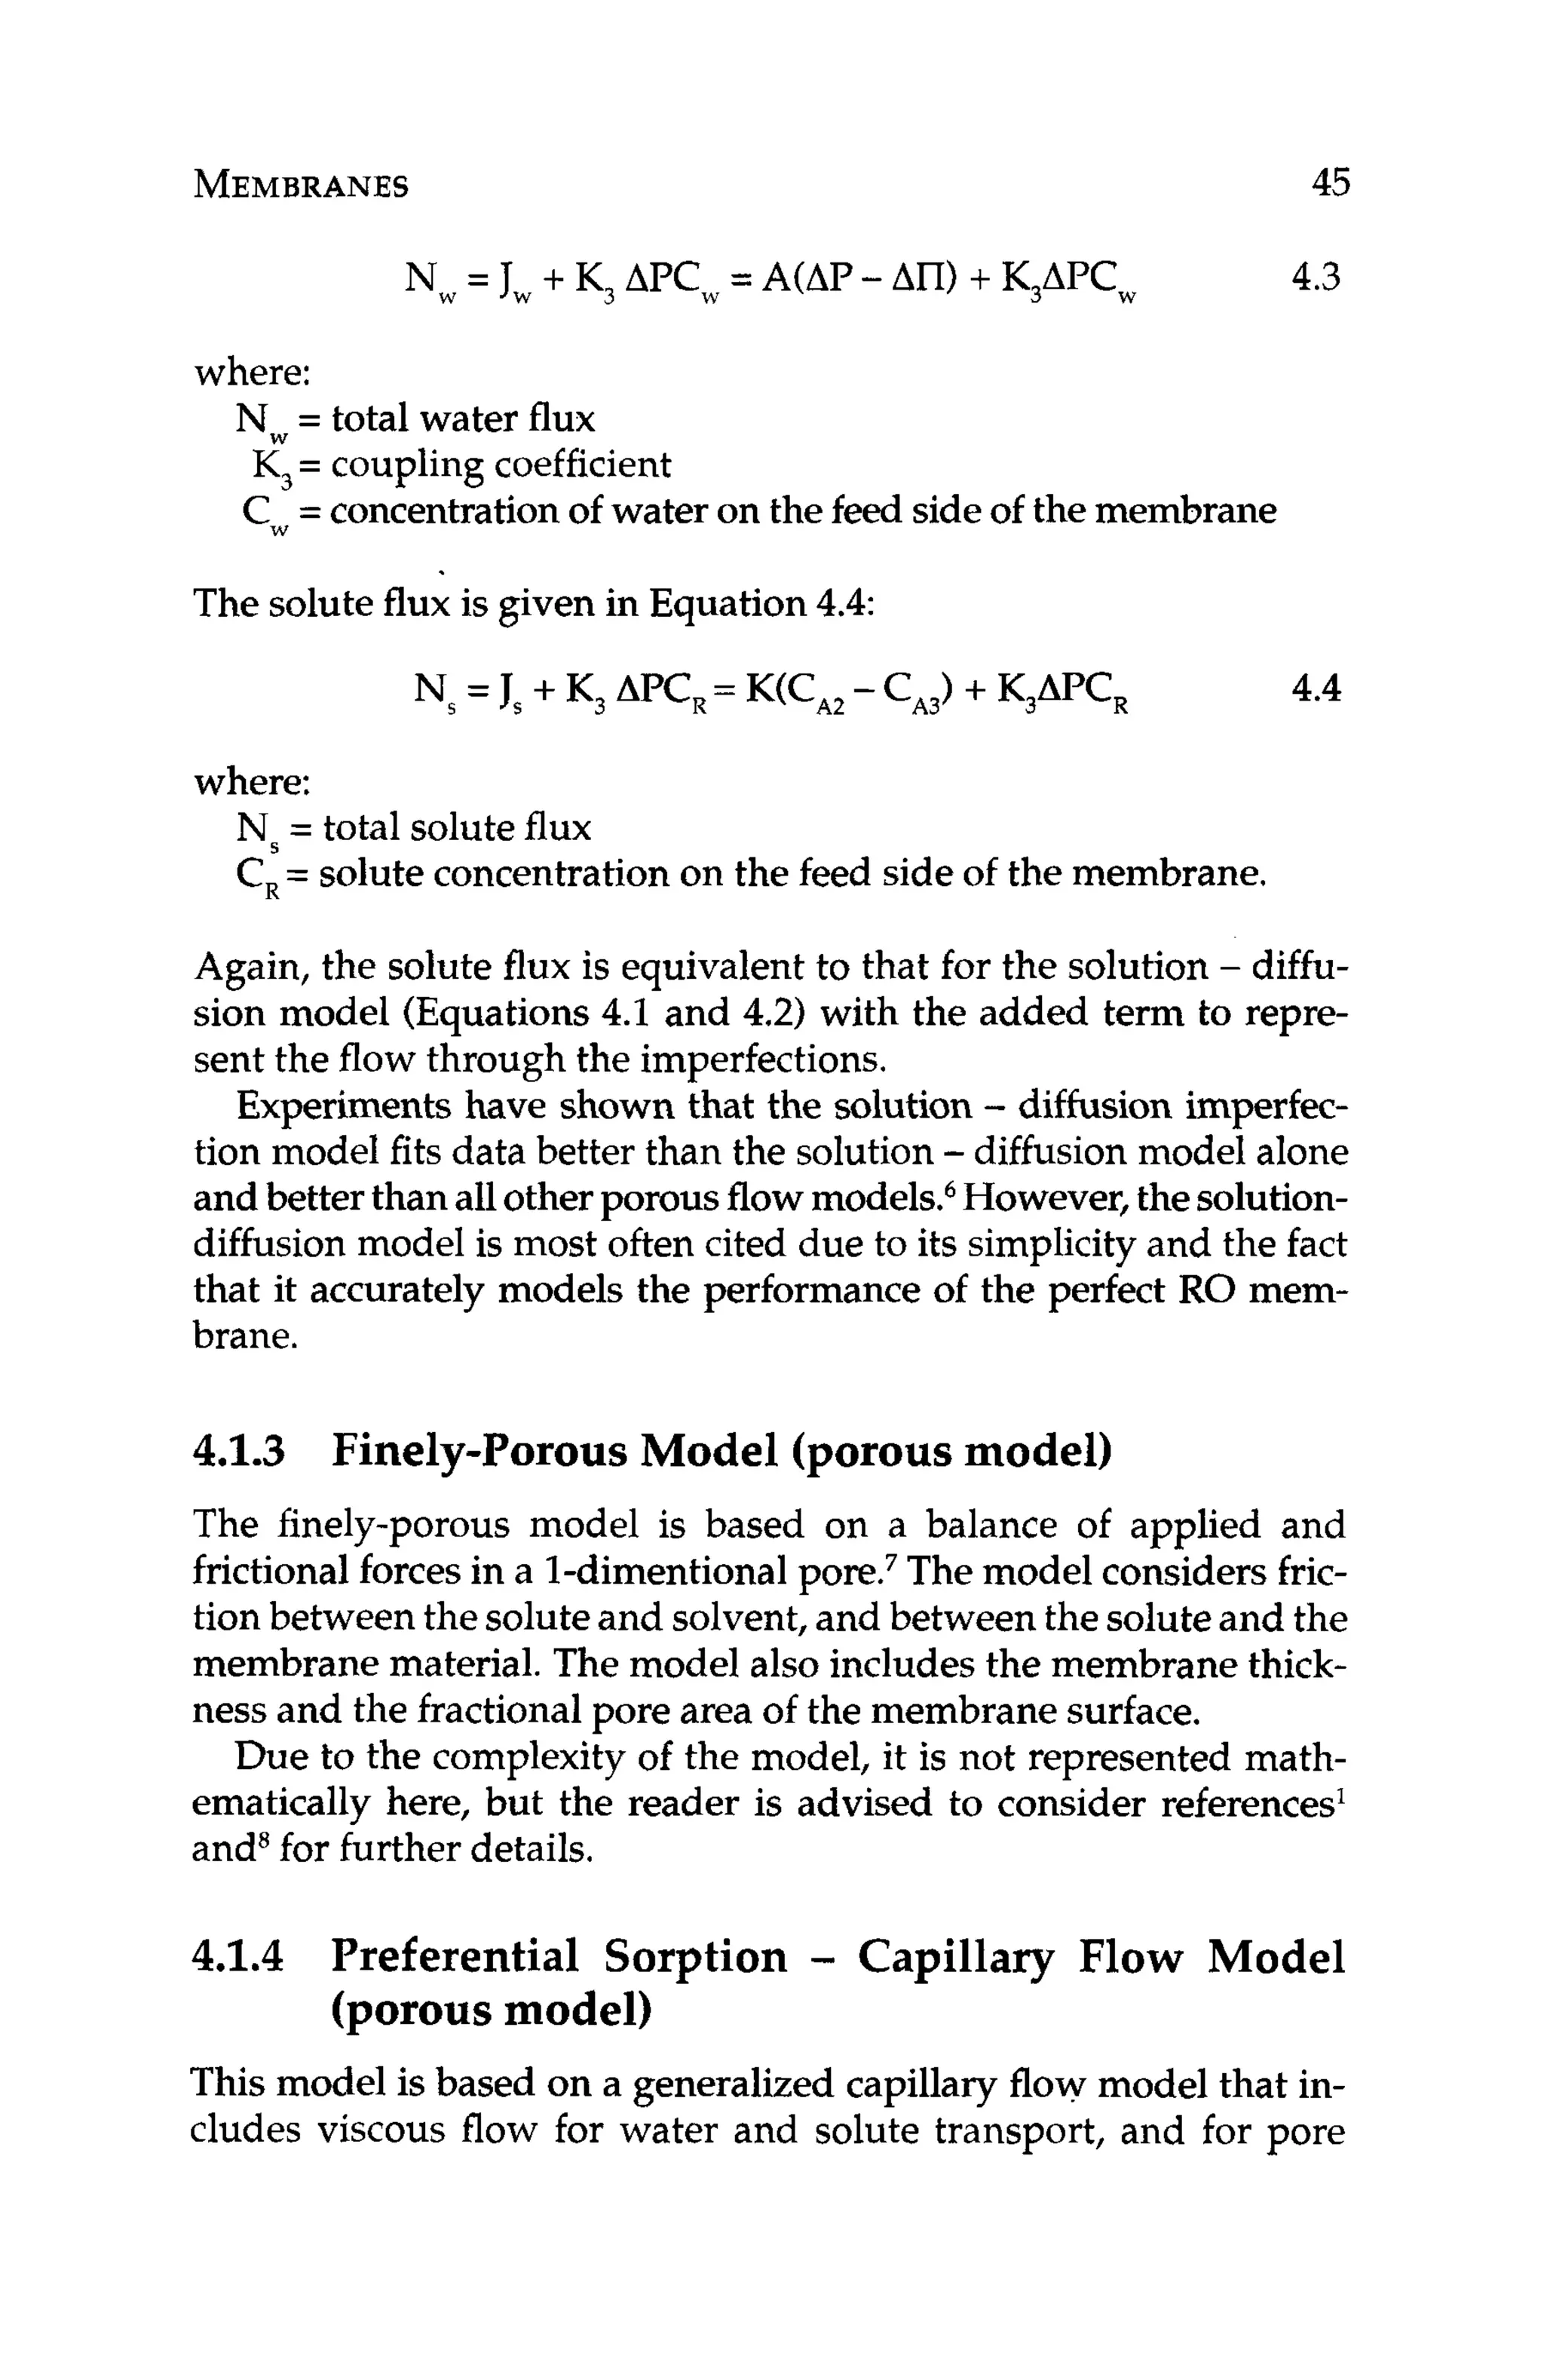
![BASICTERMS
AND DEFINITIONS 39
LSI
3.0
2.0
1.o
0.5
0.2
0.0
-0.2
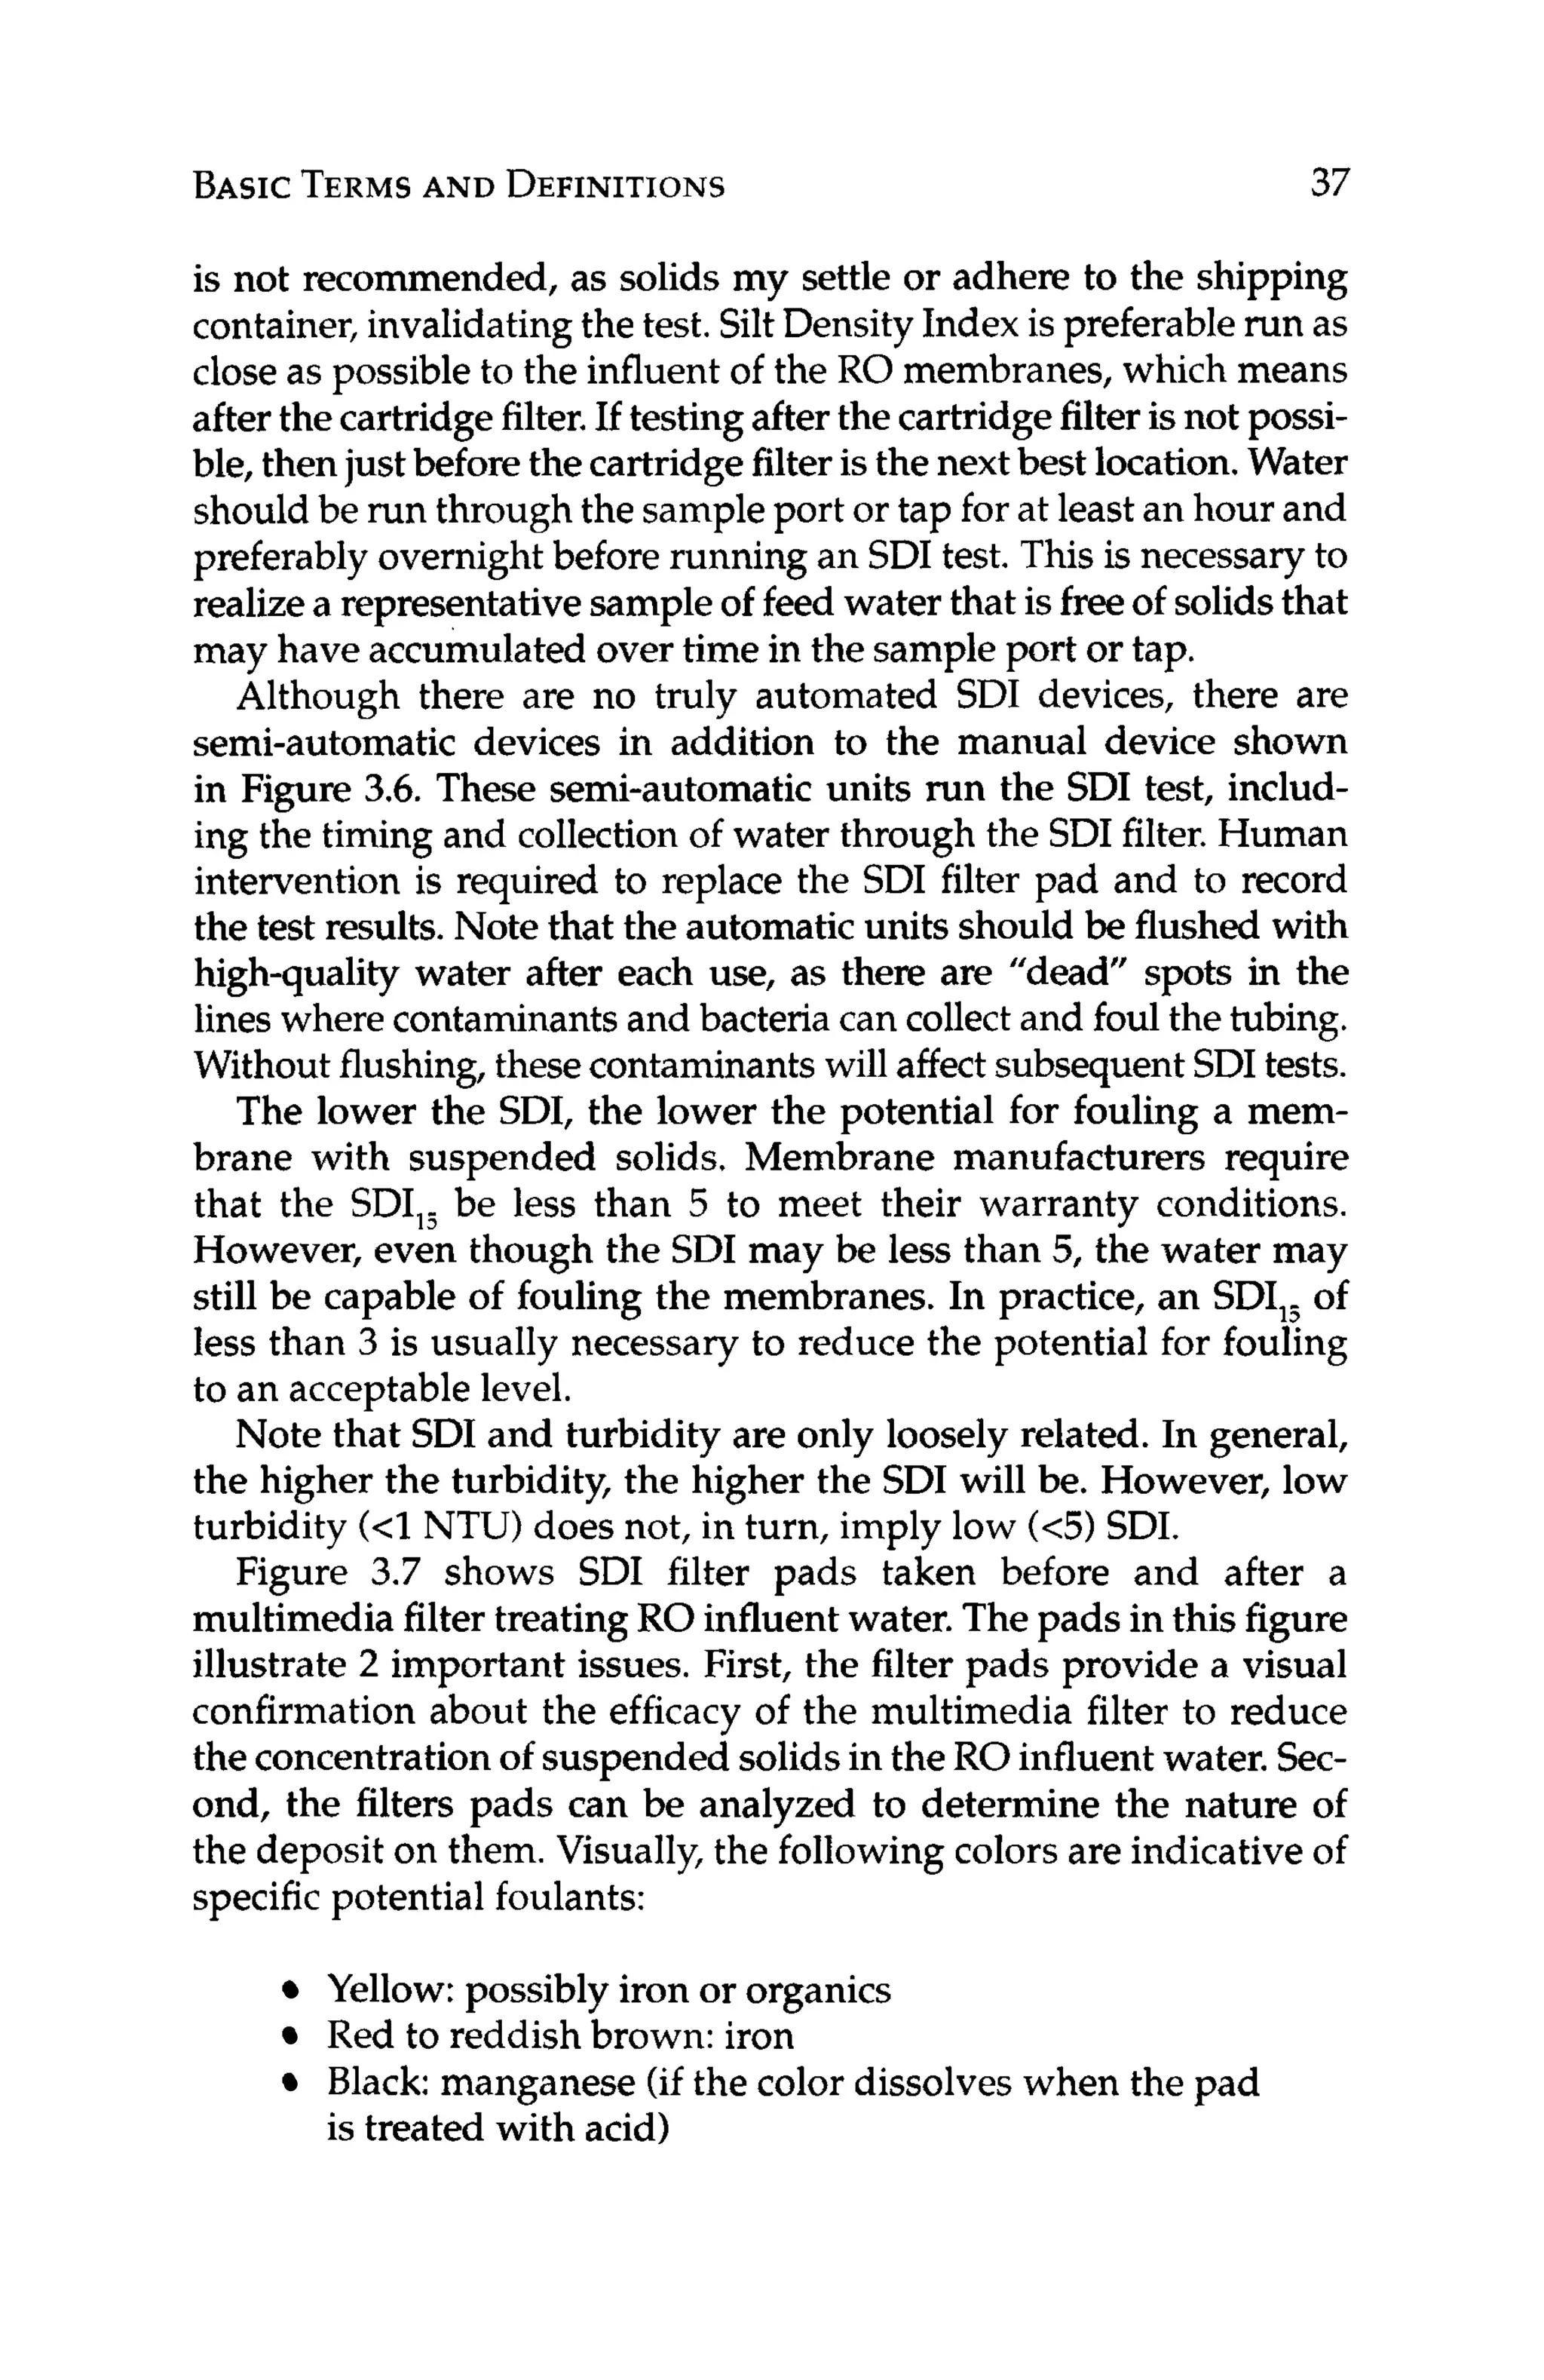
Table 3.6 Langelier saturation index.
Condition
Extremely severe scaling
Very severe scaling
Severescaling
Moderate scaling
Slight scaling
Stable water (noscale)
No scale, very slight tendency to dissolve scale
If LSI is greater than 0, the water has the tendency to form
calcium carbonate scale. If the LSI is equal to 0, the water is in
chemical balance. If the LSI is less than 0, the water is corrosive
(refer to Table 3.6).
Langelier Saturation Index is valid up to about 4,000 ppm TDS.
At higher TDS concentrations, the Stiff-Davis Saturation Index
(SDSI)is used, Equation 3.12:
SDSI = pH -pCa - pArK
- K (3.12)
where:
pCa =-Log10[Ca2+],
where [Ca2+l
is in ppm
pAlk
= -LoglO[total alkalinity],where alkalinity is in ppm
K = a constant based on the total ionic strength and
temperature
For RO applications,a positive LSI or SDSIindicates that the influ-
ent water has a tendency to form calcium carbonate scale. In these
cases, pretreatment in the form of softening(eitherwith lime or ion
exchange),or via the use of antiscalantsand/or acid is required.
References
1. Dow Chemical Company, FilmTec Reuerse Osmosis Membranes Technical
Manual, Form no. 609-00071-0705, Dow Liquid Separations,2007.](https://image.slidesharecdn.com/reverseosmosispdf-230430025016-321d174f/75/Reverse_Osmosis_pdf-pdf-61-2048.jpg)


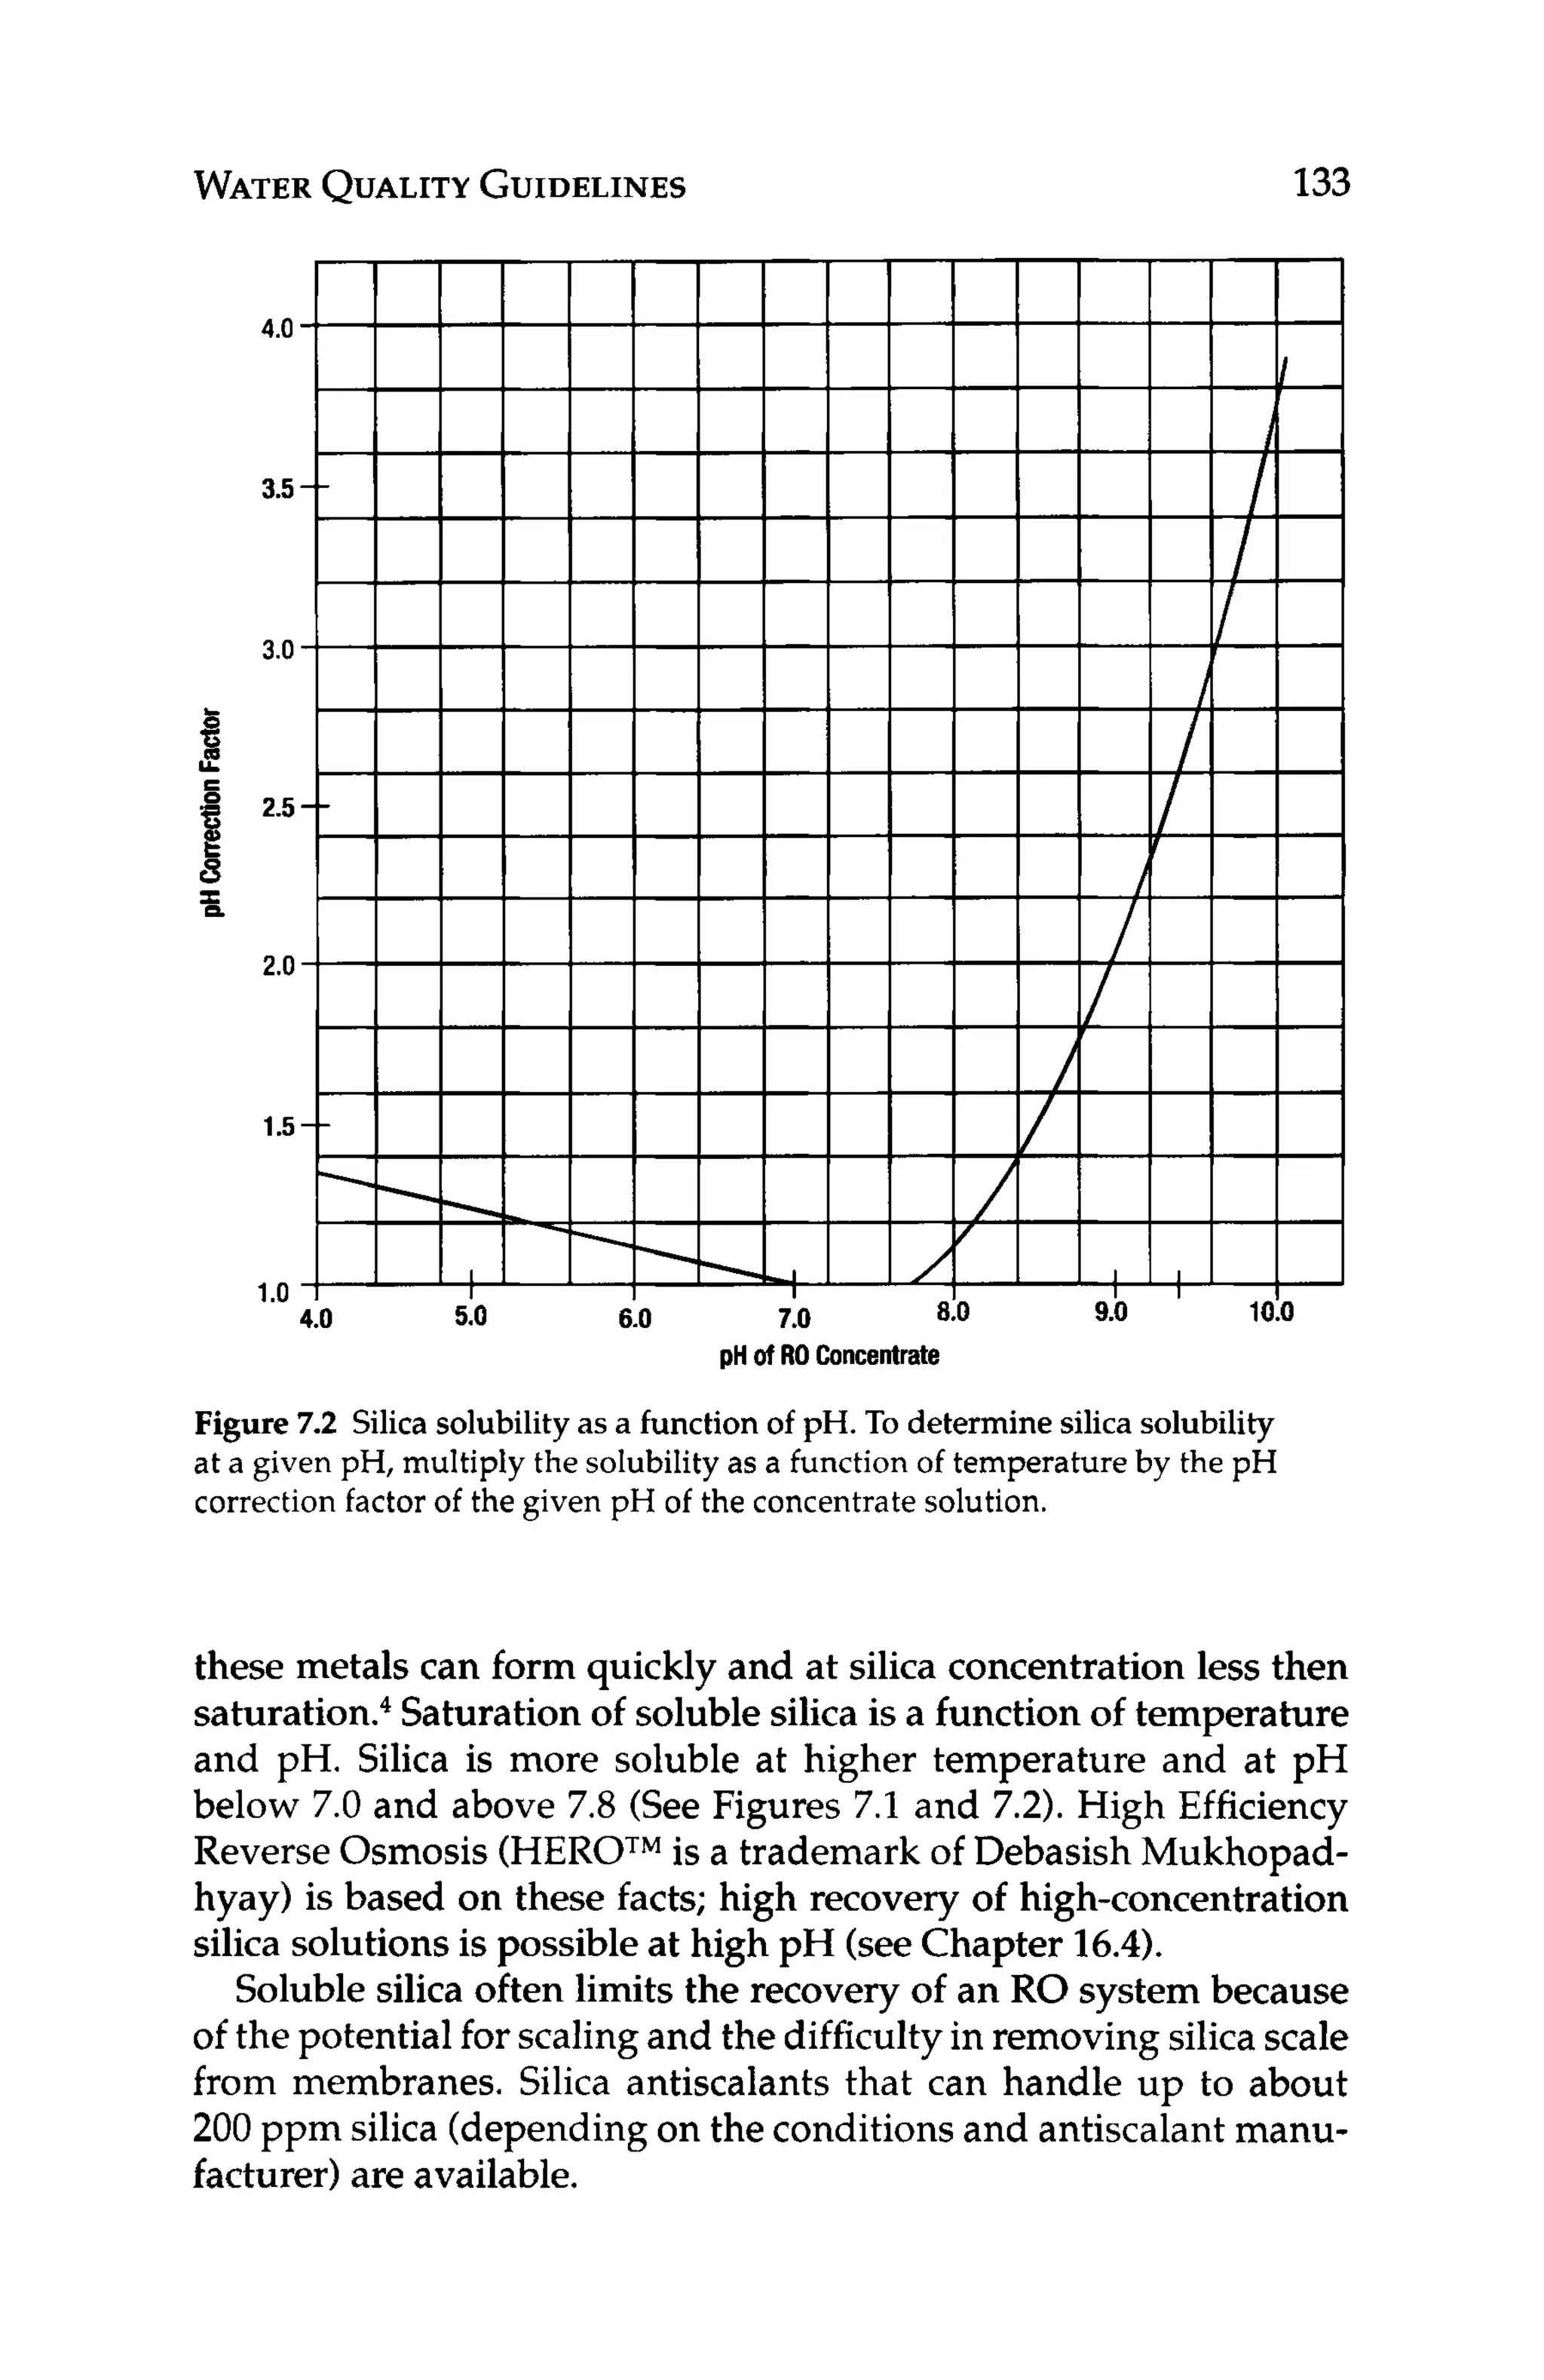
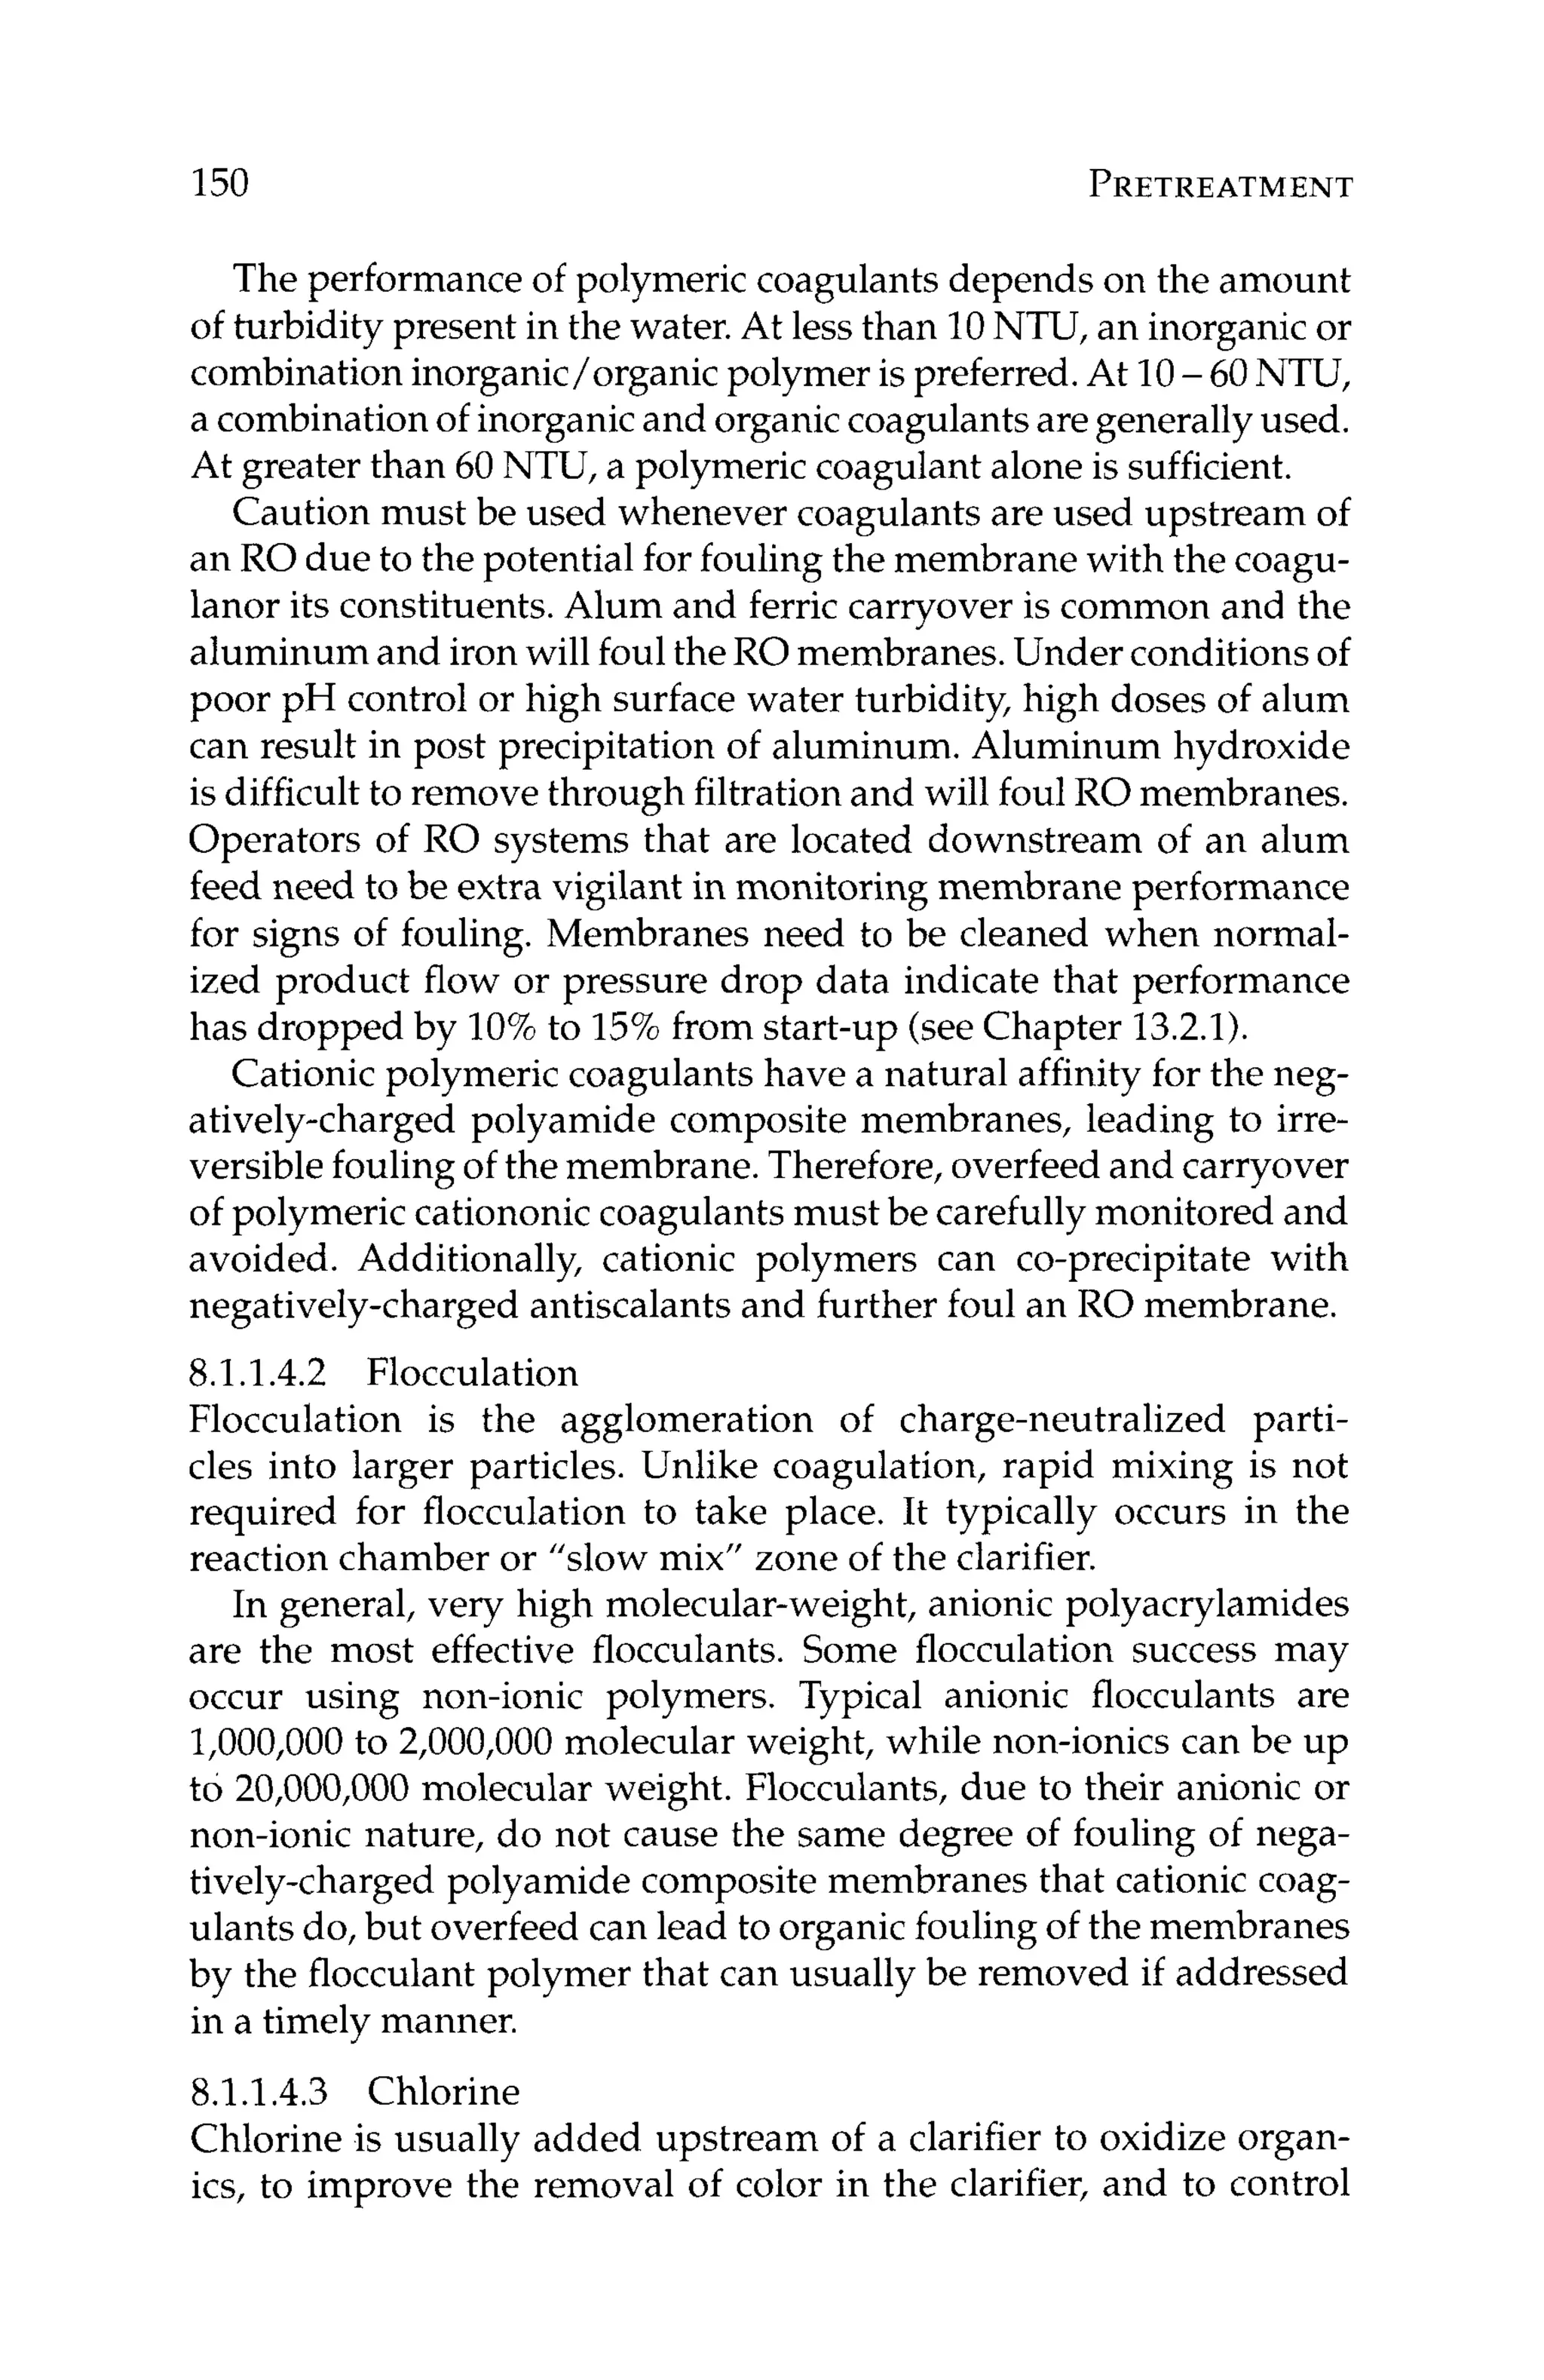
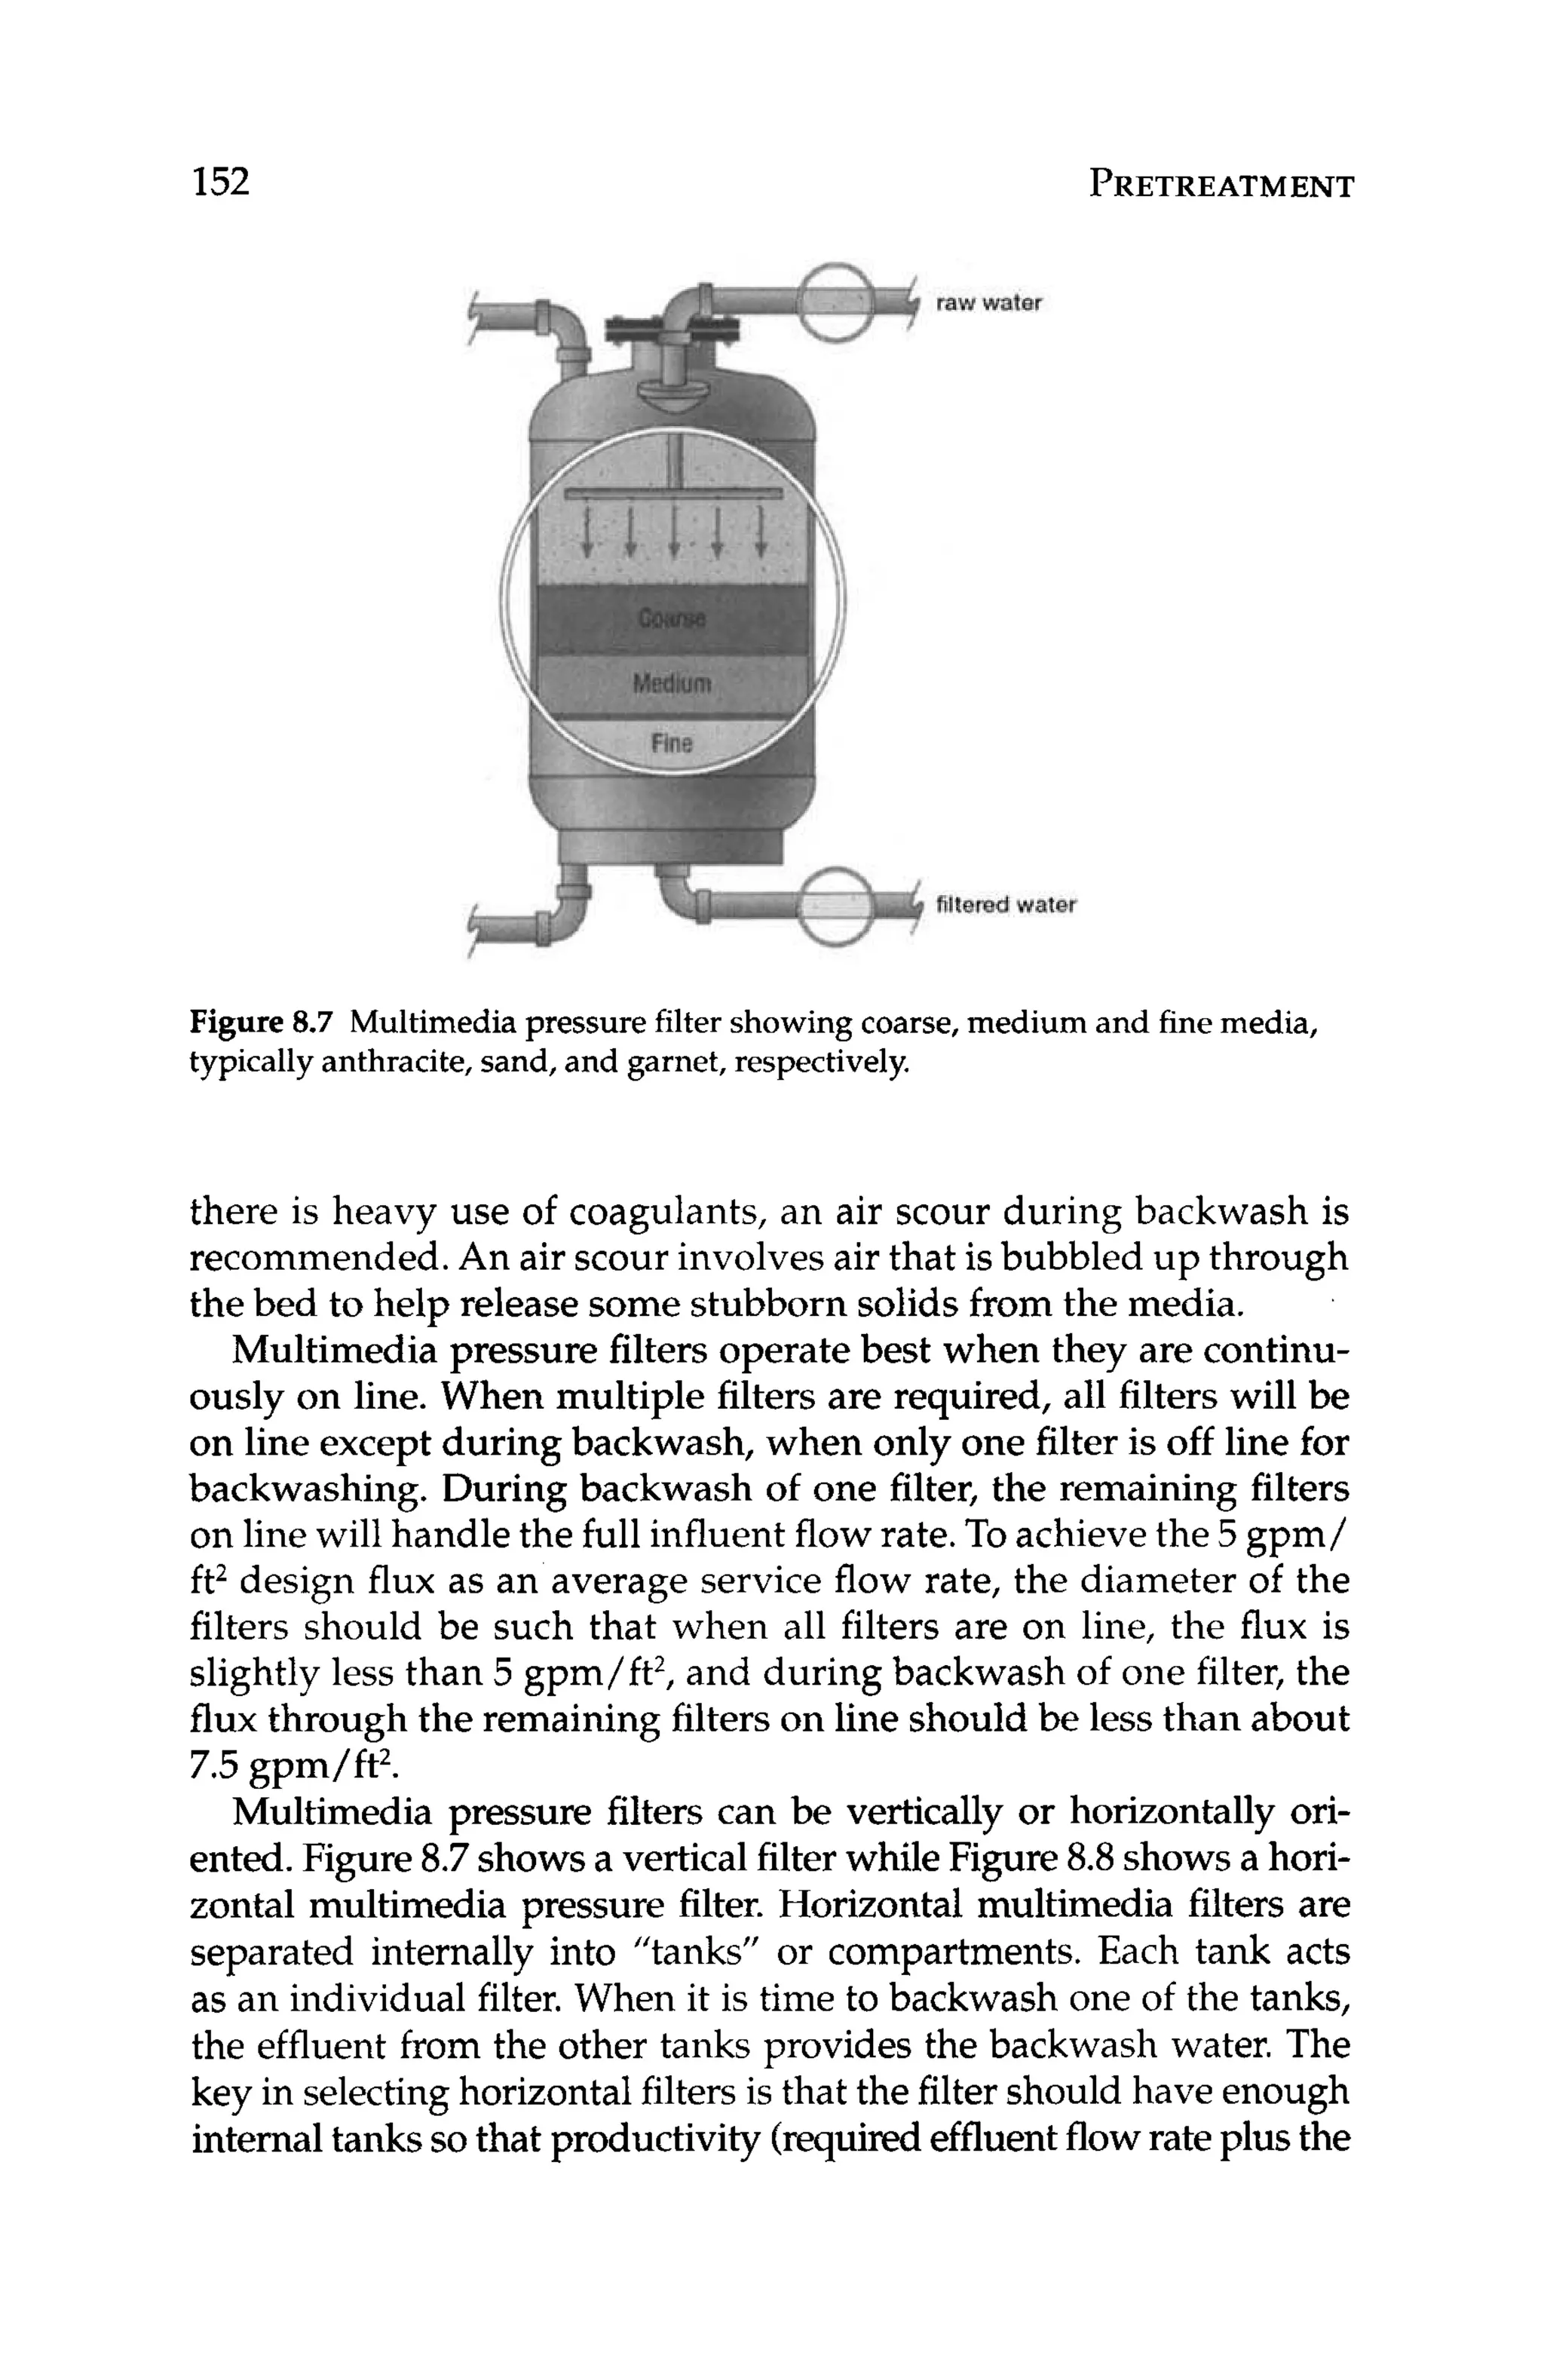
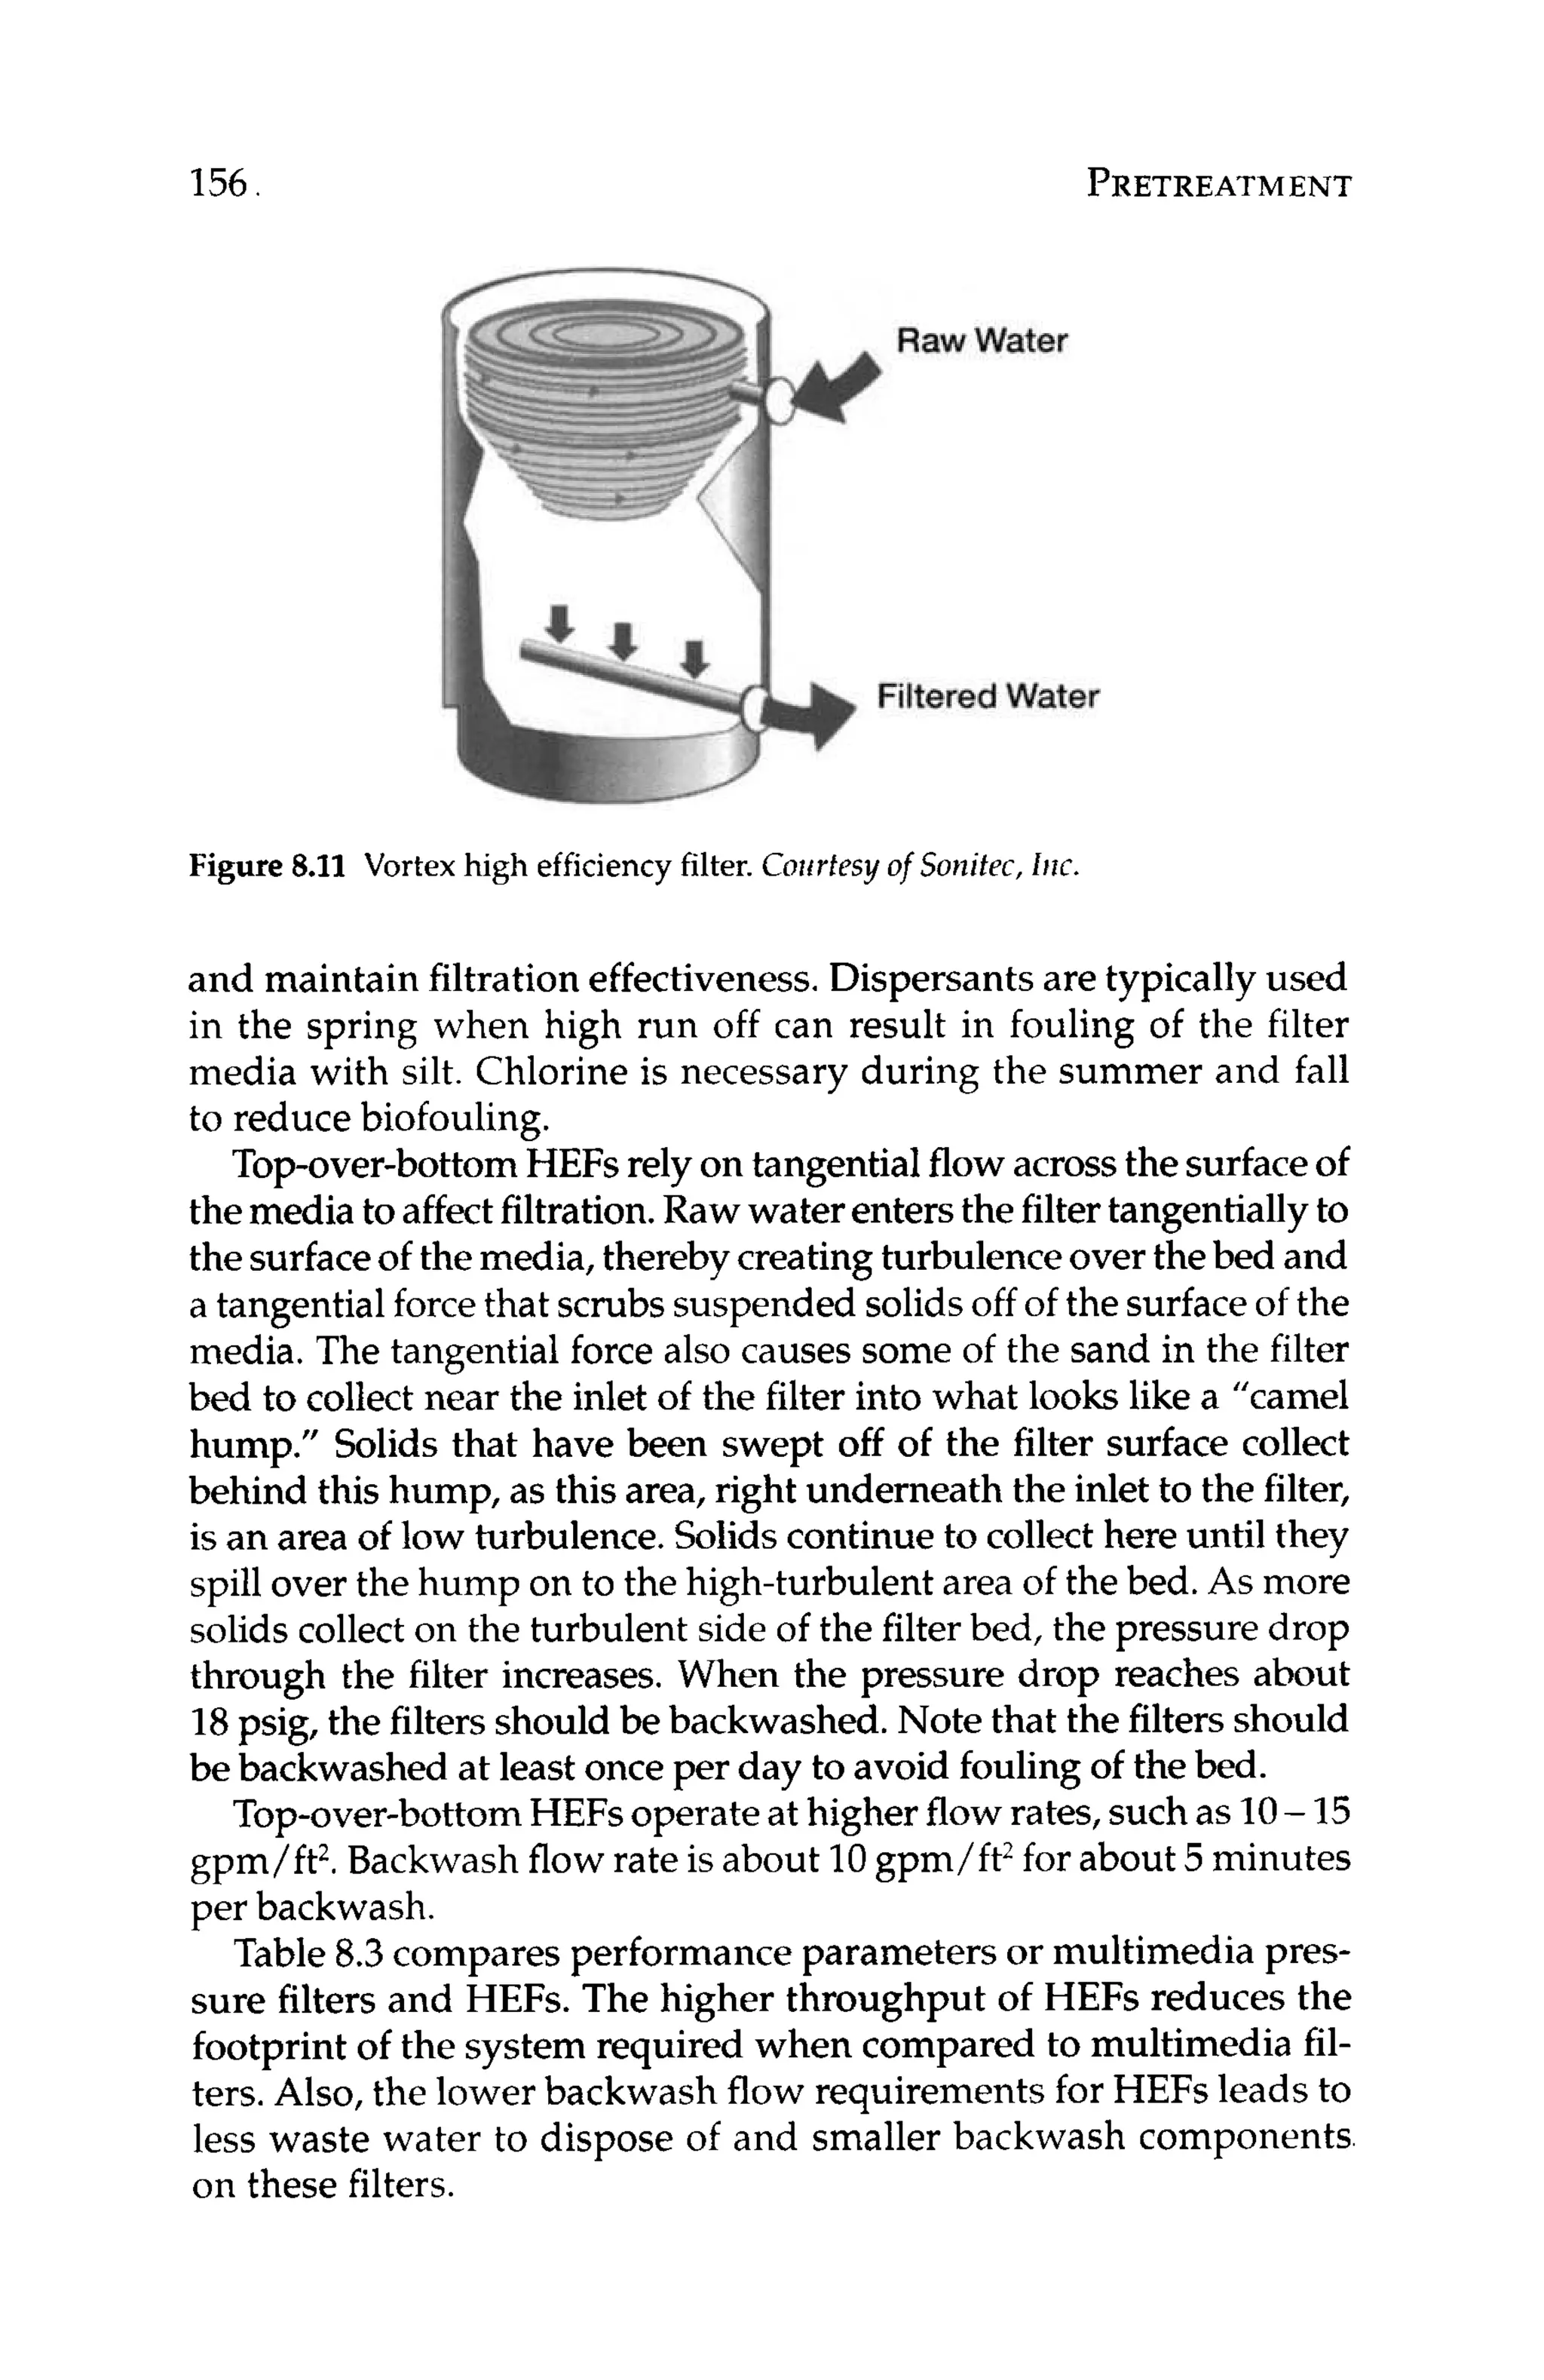
![134 PRETREATMENT
Silica fouling causes high pressure drop and low productivity.Silica
scalingcauses low rejection of silica and perhaps other ions as well.
Colloidal silica can be removed or reduced in RO feed water us-
ing coagulation/clarification (see Chapter 8.1.1). Soluble silica is
typically dealt with using high pH, elevated temperature, antiscal-
ants (see Chapter 8.2.3),or the HEROTM
process. Sometimes, the
recovery of the RO system is adjusted to minimize the potential for
forming silica scale.
7.8 Calcium Carbonate
Calcium carbonate scalingis perhaps the most common type of prob-
lem, with the possible exception of microbial fouling, that RO mem-
branes experience. Fortunately,it is fairly easy to detect and handle.
Basically, if the ion product (IP)of calcium carbonate in the RO re-
ject is greater than the solubility constant (KSJ under reject conditions,
then calciumcarbonate scalewill form. If IP < K ,scalingin unlikely.
The ion product at any degree of saturation is def%ed as:
IP = [cationla[anionlb (7.3)
where:
IP = ion product
[cation]= cation concentration
[anion]= anion concentration
superscripts:
a = quantity of cation within the salt
b = quantity of anion within the salt
The solubility product at saturation is defined as:
KSp= [cationla[anionlb
where:
KSp= solubility product
(7.4)
Langelier Saturation Index (LSI) is used to determine the scaling
potential of calcium carbonate. (Note that LSI is used up to about
4,000 ppm TDS; higher concentrations rely on the Stiff-Davis Satu-
ration Index.) The LSI is calculated using the following formulas](https://image.slidesharecdn.com/reverseosmosispdf-230430025016-321d174f/75/Reverse_Osmosis_pdf-pdf-156-2048.jpg)
![WATER
QUALITY GUIDELINES 135
(notethat the concentrateconcentrationis used to calculatethe LSI,
as this is where the concentrationsof solutes is the greatest):
(7.5)
(7.6)
LSI = pH - pHa
where:
pHa= (9.30+ A+ B) - (C +D)
where:
A = (log,,[TDS] -11/10
B = -13.12 x lOg,,(OC+273) + 34.55
C = log,,[Ca2+]
-0.4, where [Ca2+l
is in ppm as CaCO,
D = log,,[alkalinity], where [alkalinity]is in ppm as CaCO,
A positiveLSI means that scalingis favored;a negativeLSI means that
corrosionisfavored.It isdesirableto keeptheLSI near zero(orbelow)
in the RO concentrate to minimize calcium carbonate scaling. This
is usually accomplished by feeding acid to lower the pH or feeding
an antiscalant(seeChapter 8.2.3).Care must be given if sulfuricacid
is used to adjust the pH, as this may exacerbatesulfate-based scales,
such as calcium sulfate,barium sulfate,and strontiumsulfate.
Alternatively,antiscalantscan be used to control calcium carbonate
scaleatLSIvaluesashigh as2.0-2.5,dependingon thespecificantiscal-
ants. Calcium also forms scales with fluoride, sulfate, and phosphate.
TheLSIwillnothelppredictthesescales;analysisof waterquality,using
theionproductand solubilityconstants,isrequiredtodeterminethepo-
tentialforscalingwithcalciumfluorideorcalciumphosphate.Antiscal-
ants currently availablecan addresscalcium fluorideand calcium sul-
fatescale;theydonotaddresscalciumphosphatescale(althoughnewer
antiscalantswillbe availablein thenearfutureto addressthisscale).
Scaled membranes exhibit lower productivity and lower salt re-
jection. This lower salt rejection is a function of the concentration
polarization phenomenon (seeChapter 3.4).When membranes are
scaled, the surface of the membrane has a higher concentration of
solutes than in the bulk solution. Sincethe membrane rejects when
the membrane “sees,” the passage of salts will be higher, even
though the absolute or true rejection stays constant.
Calcium is removed from RO feed water using sodium soften-
ing, or reduced using lime softening(seeChapters 8.1.6and 8.3,re-
spectively).Dropping the LSI using acid is used to address calcium
scaling without removingor reducing the concentrationof calcium.
Antiscalantsarealsoused to address the issue without reducing the
amount of calcium present (seeChapter 8.2.3).](https://image.slidesharecdn.com/reverseosmosispdf-230430025016-321d174f/75/Reverse_Osmosis_pdf-pdf-157-2048.jpg)


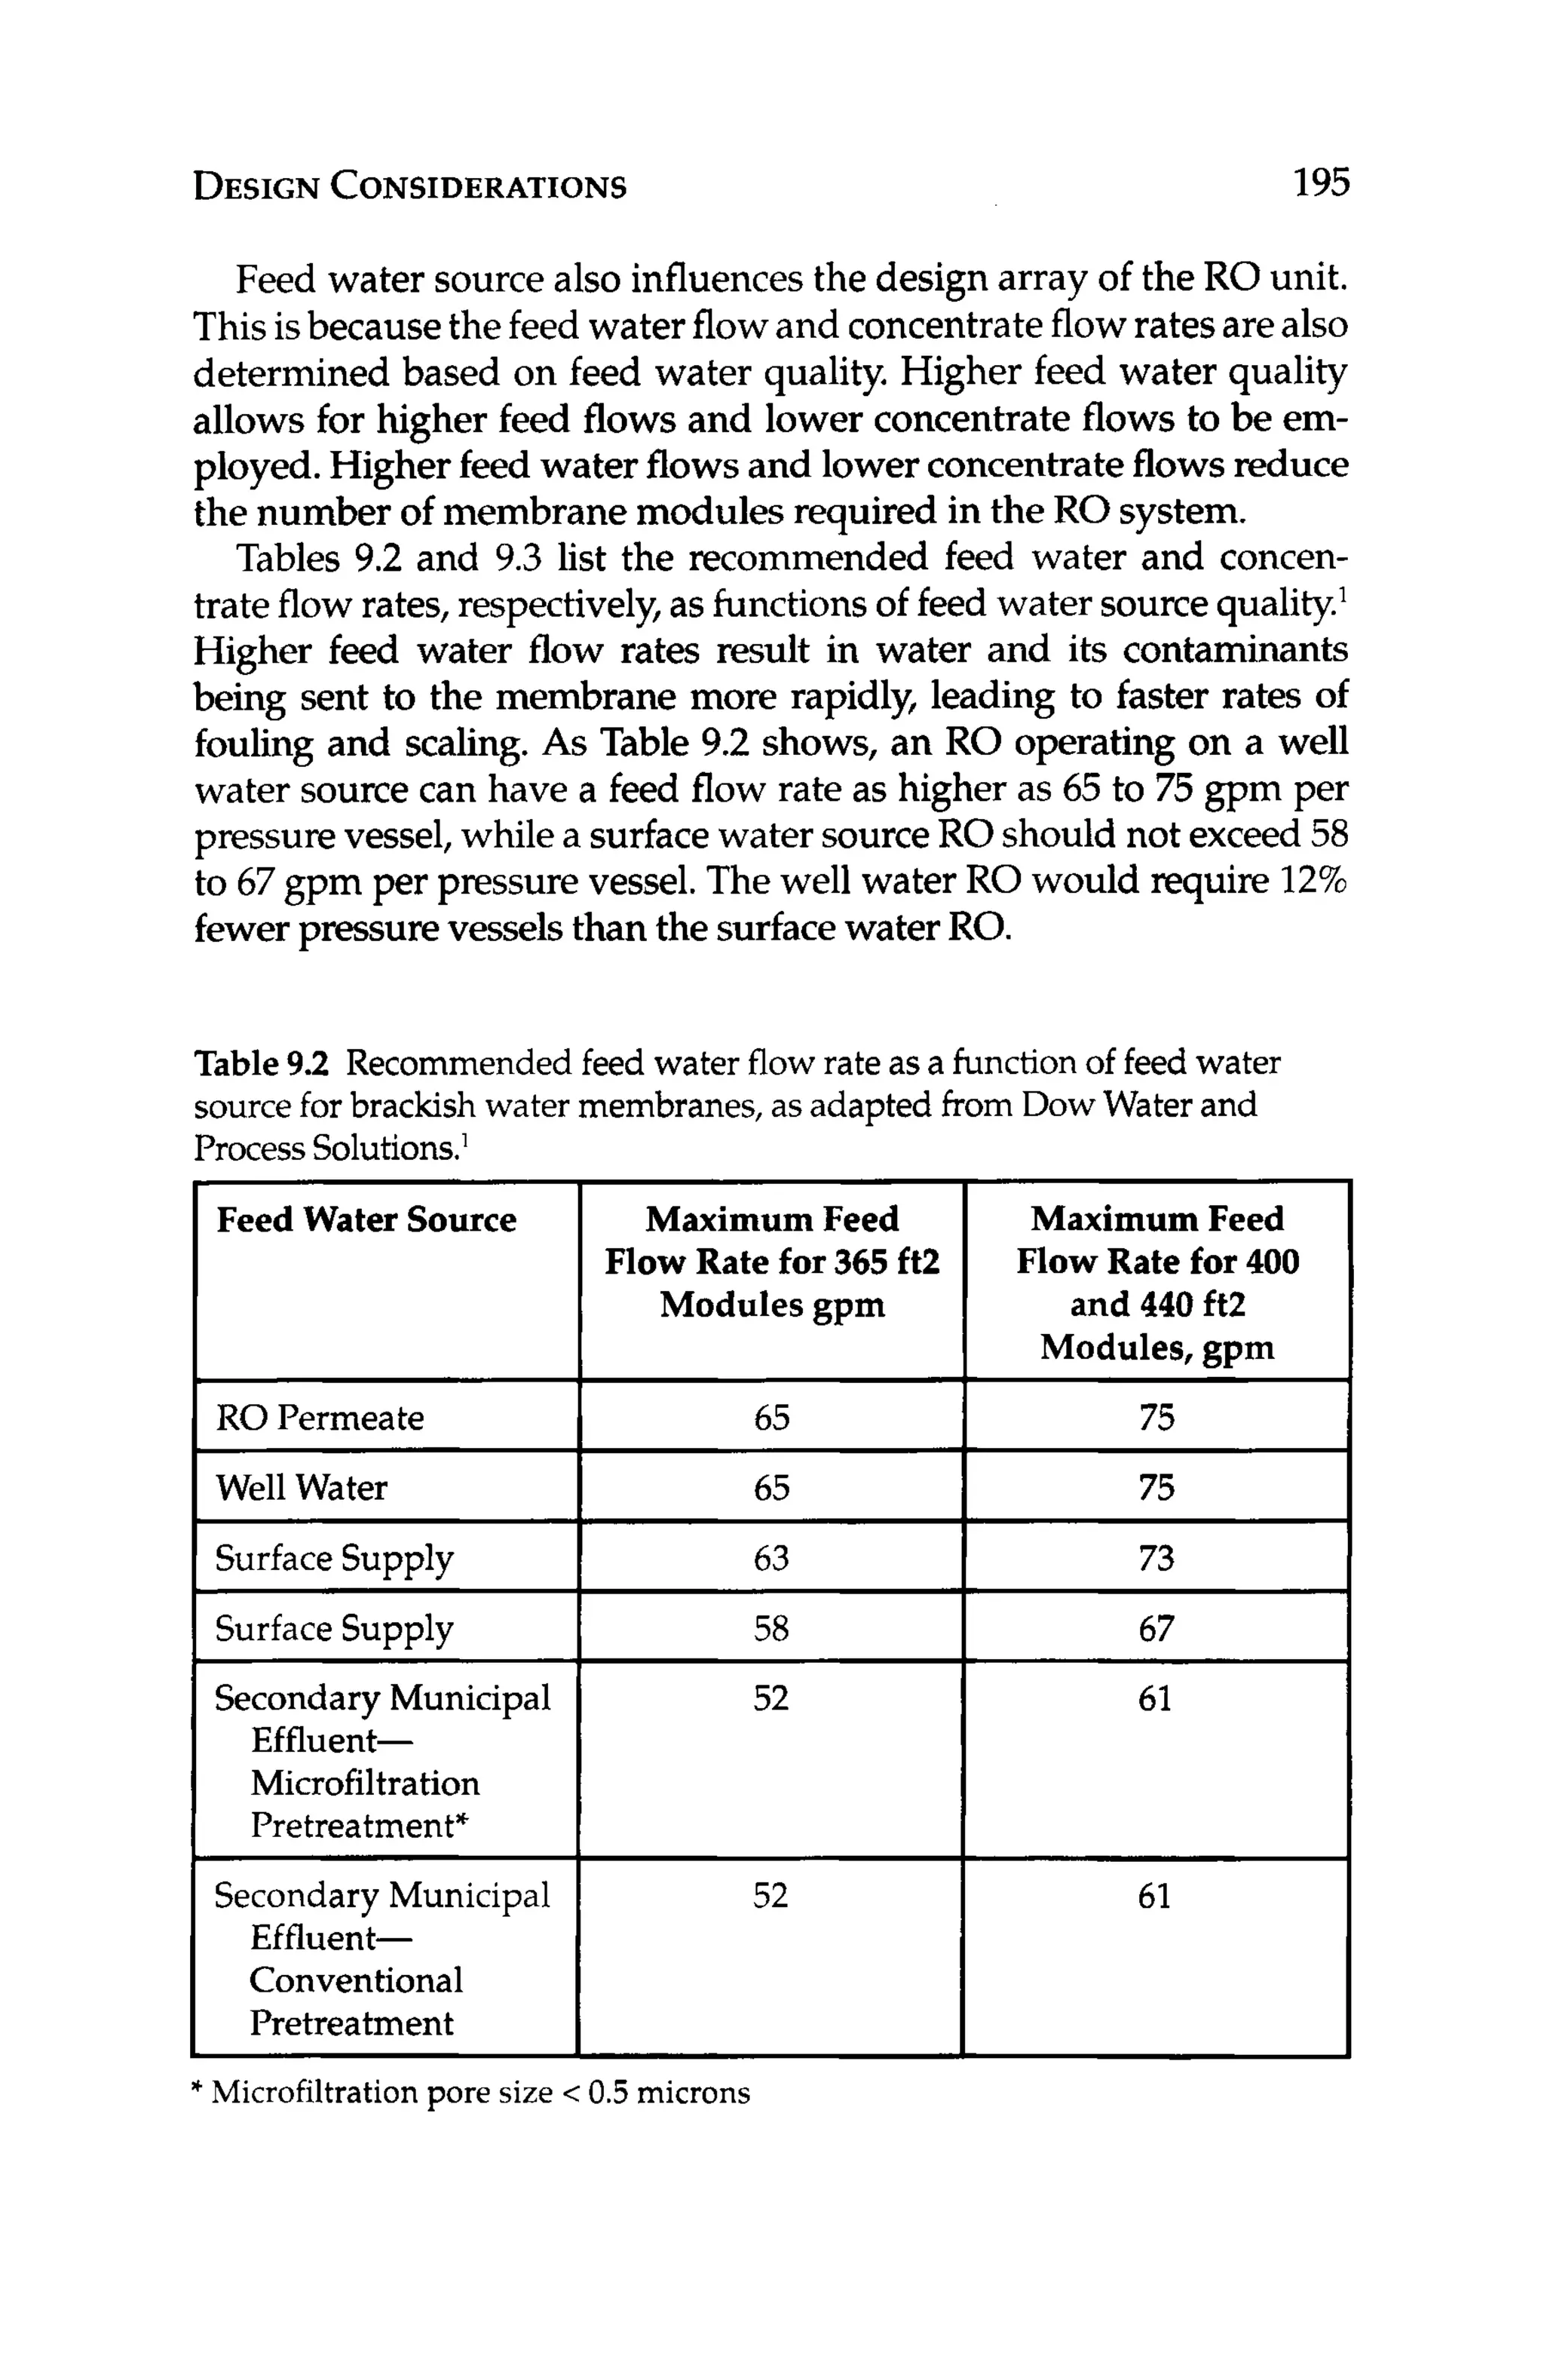

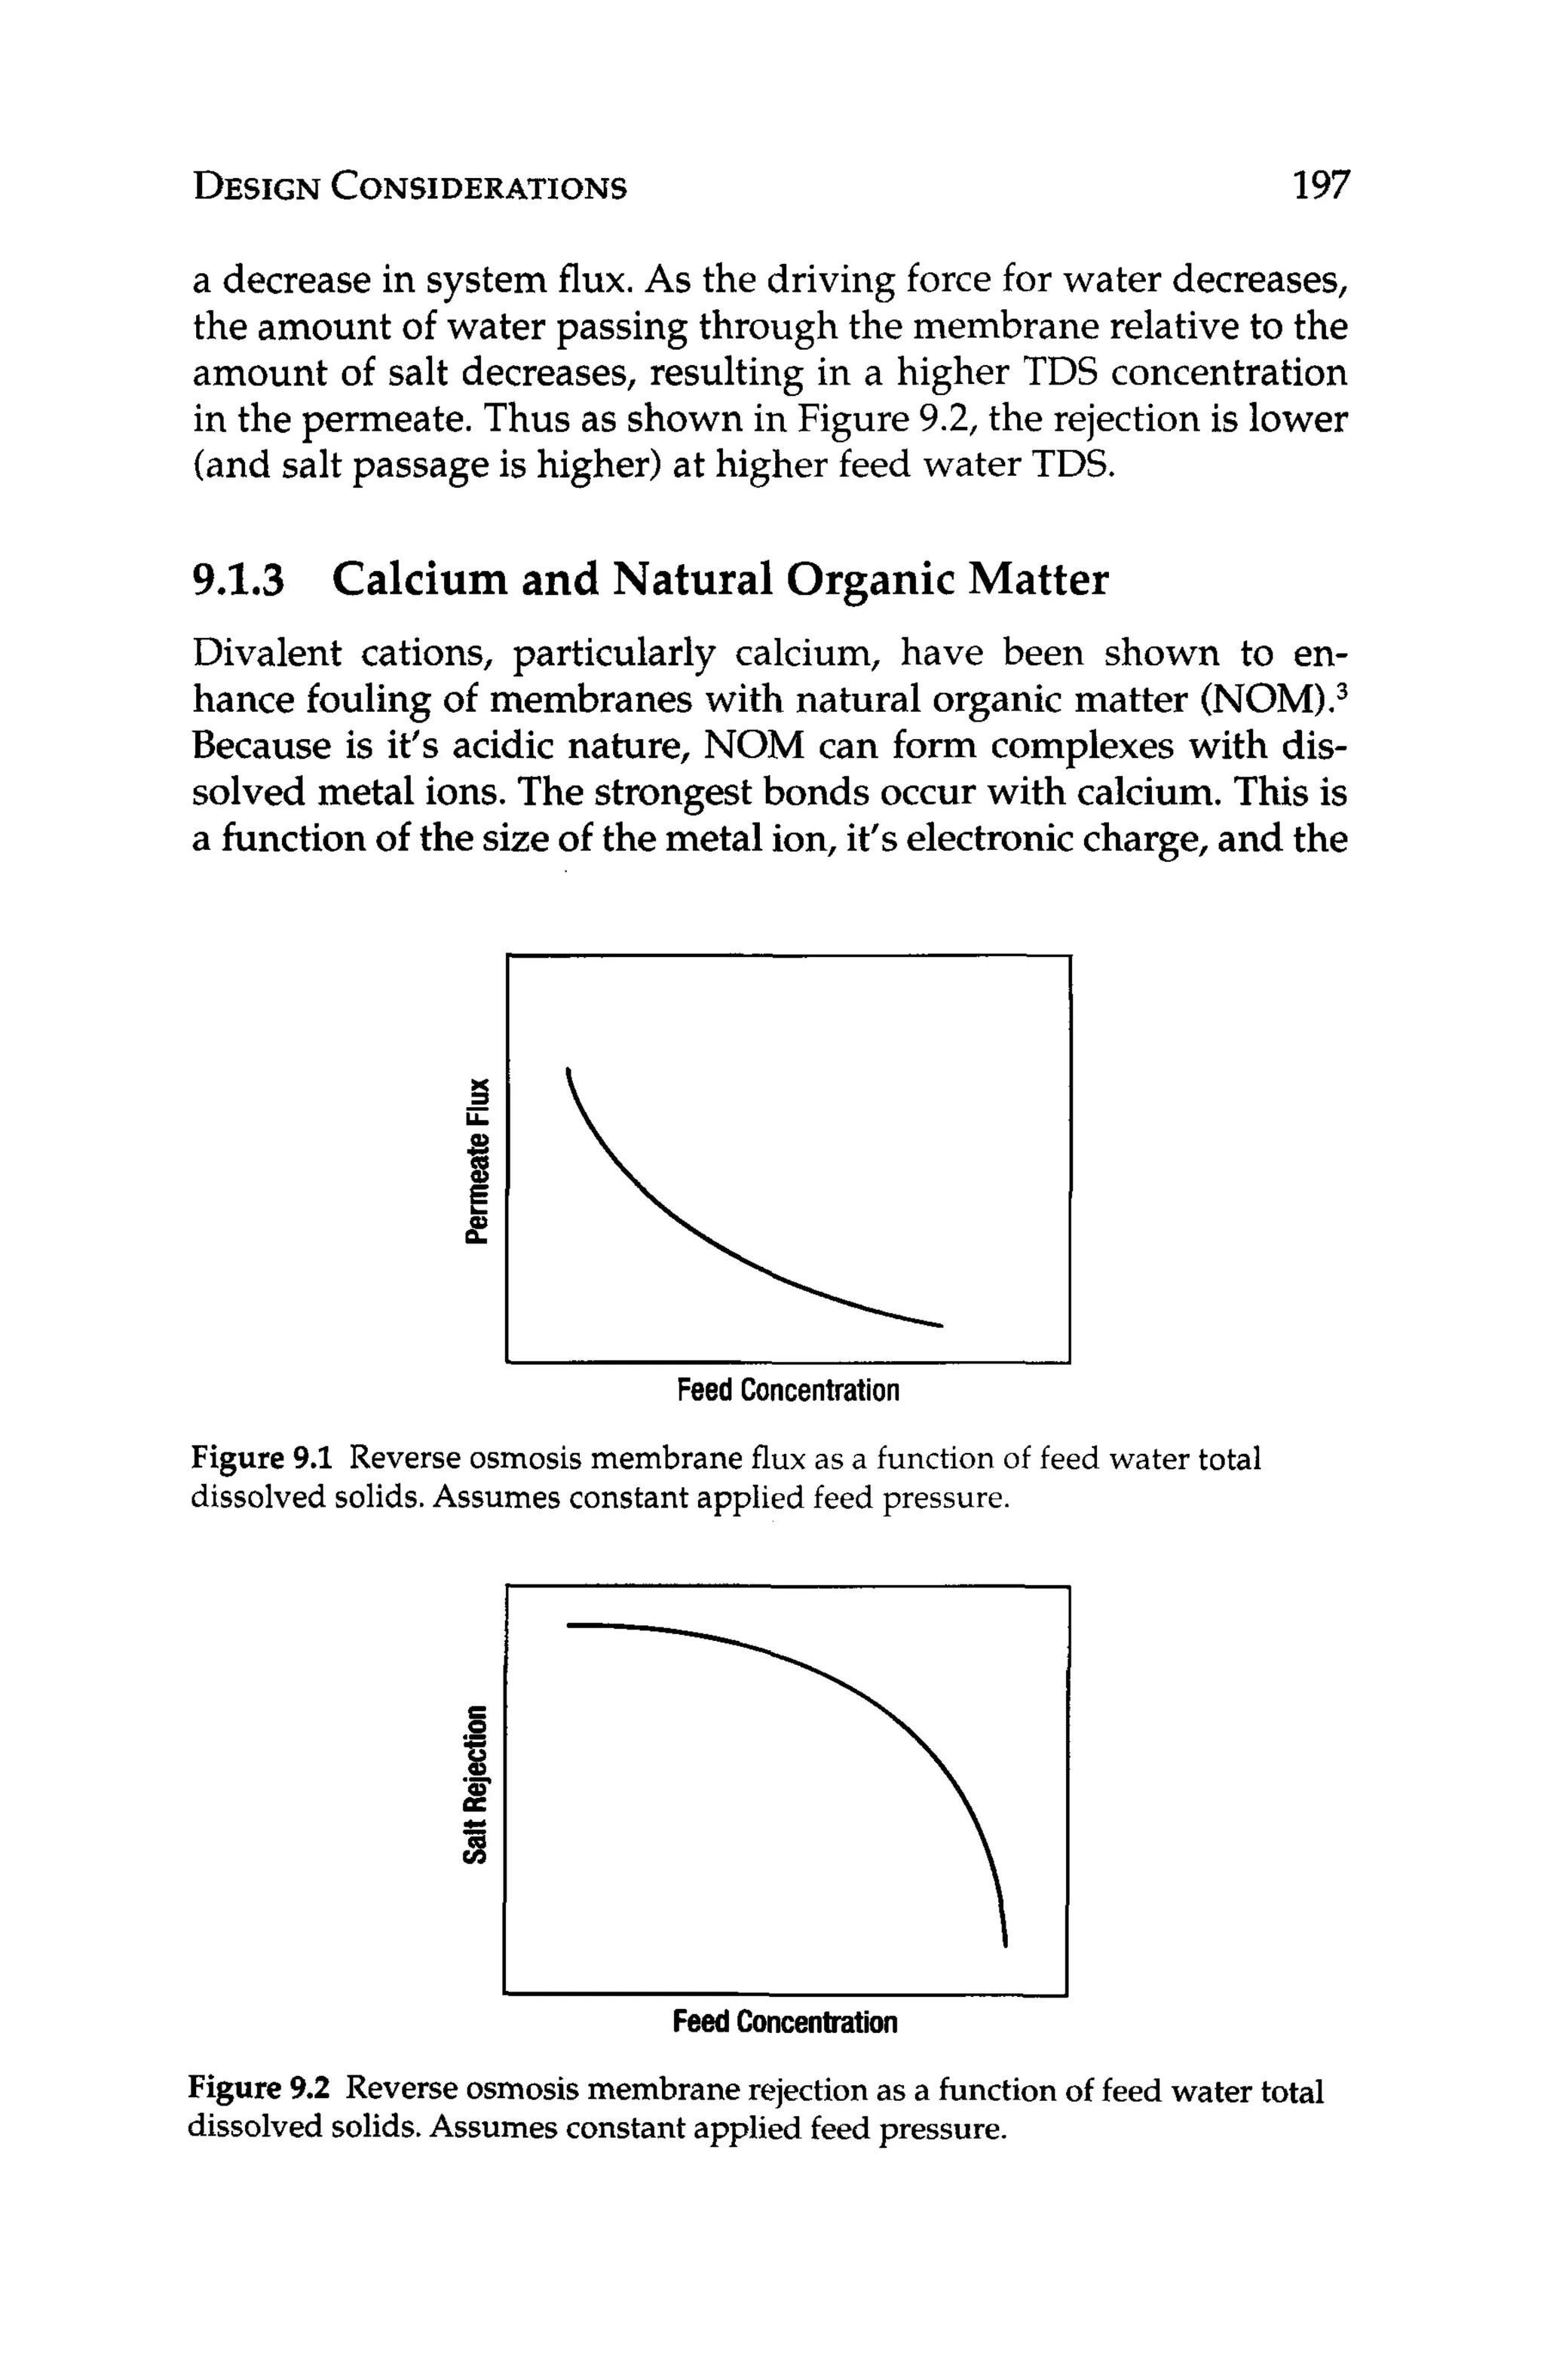


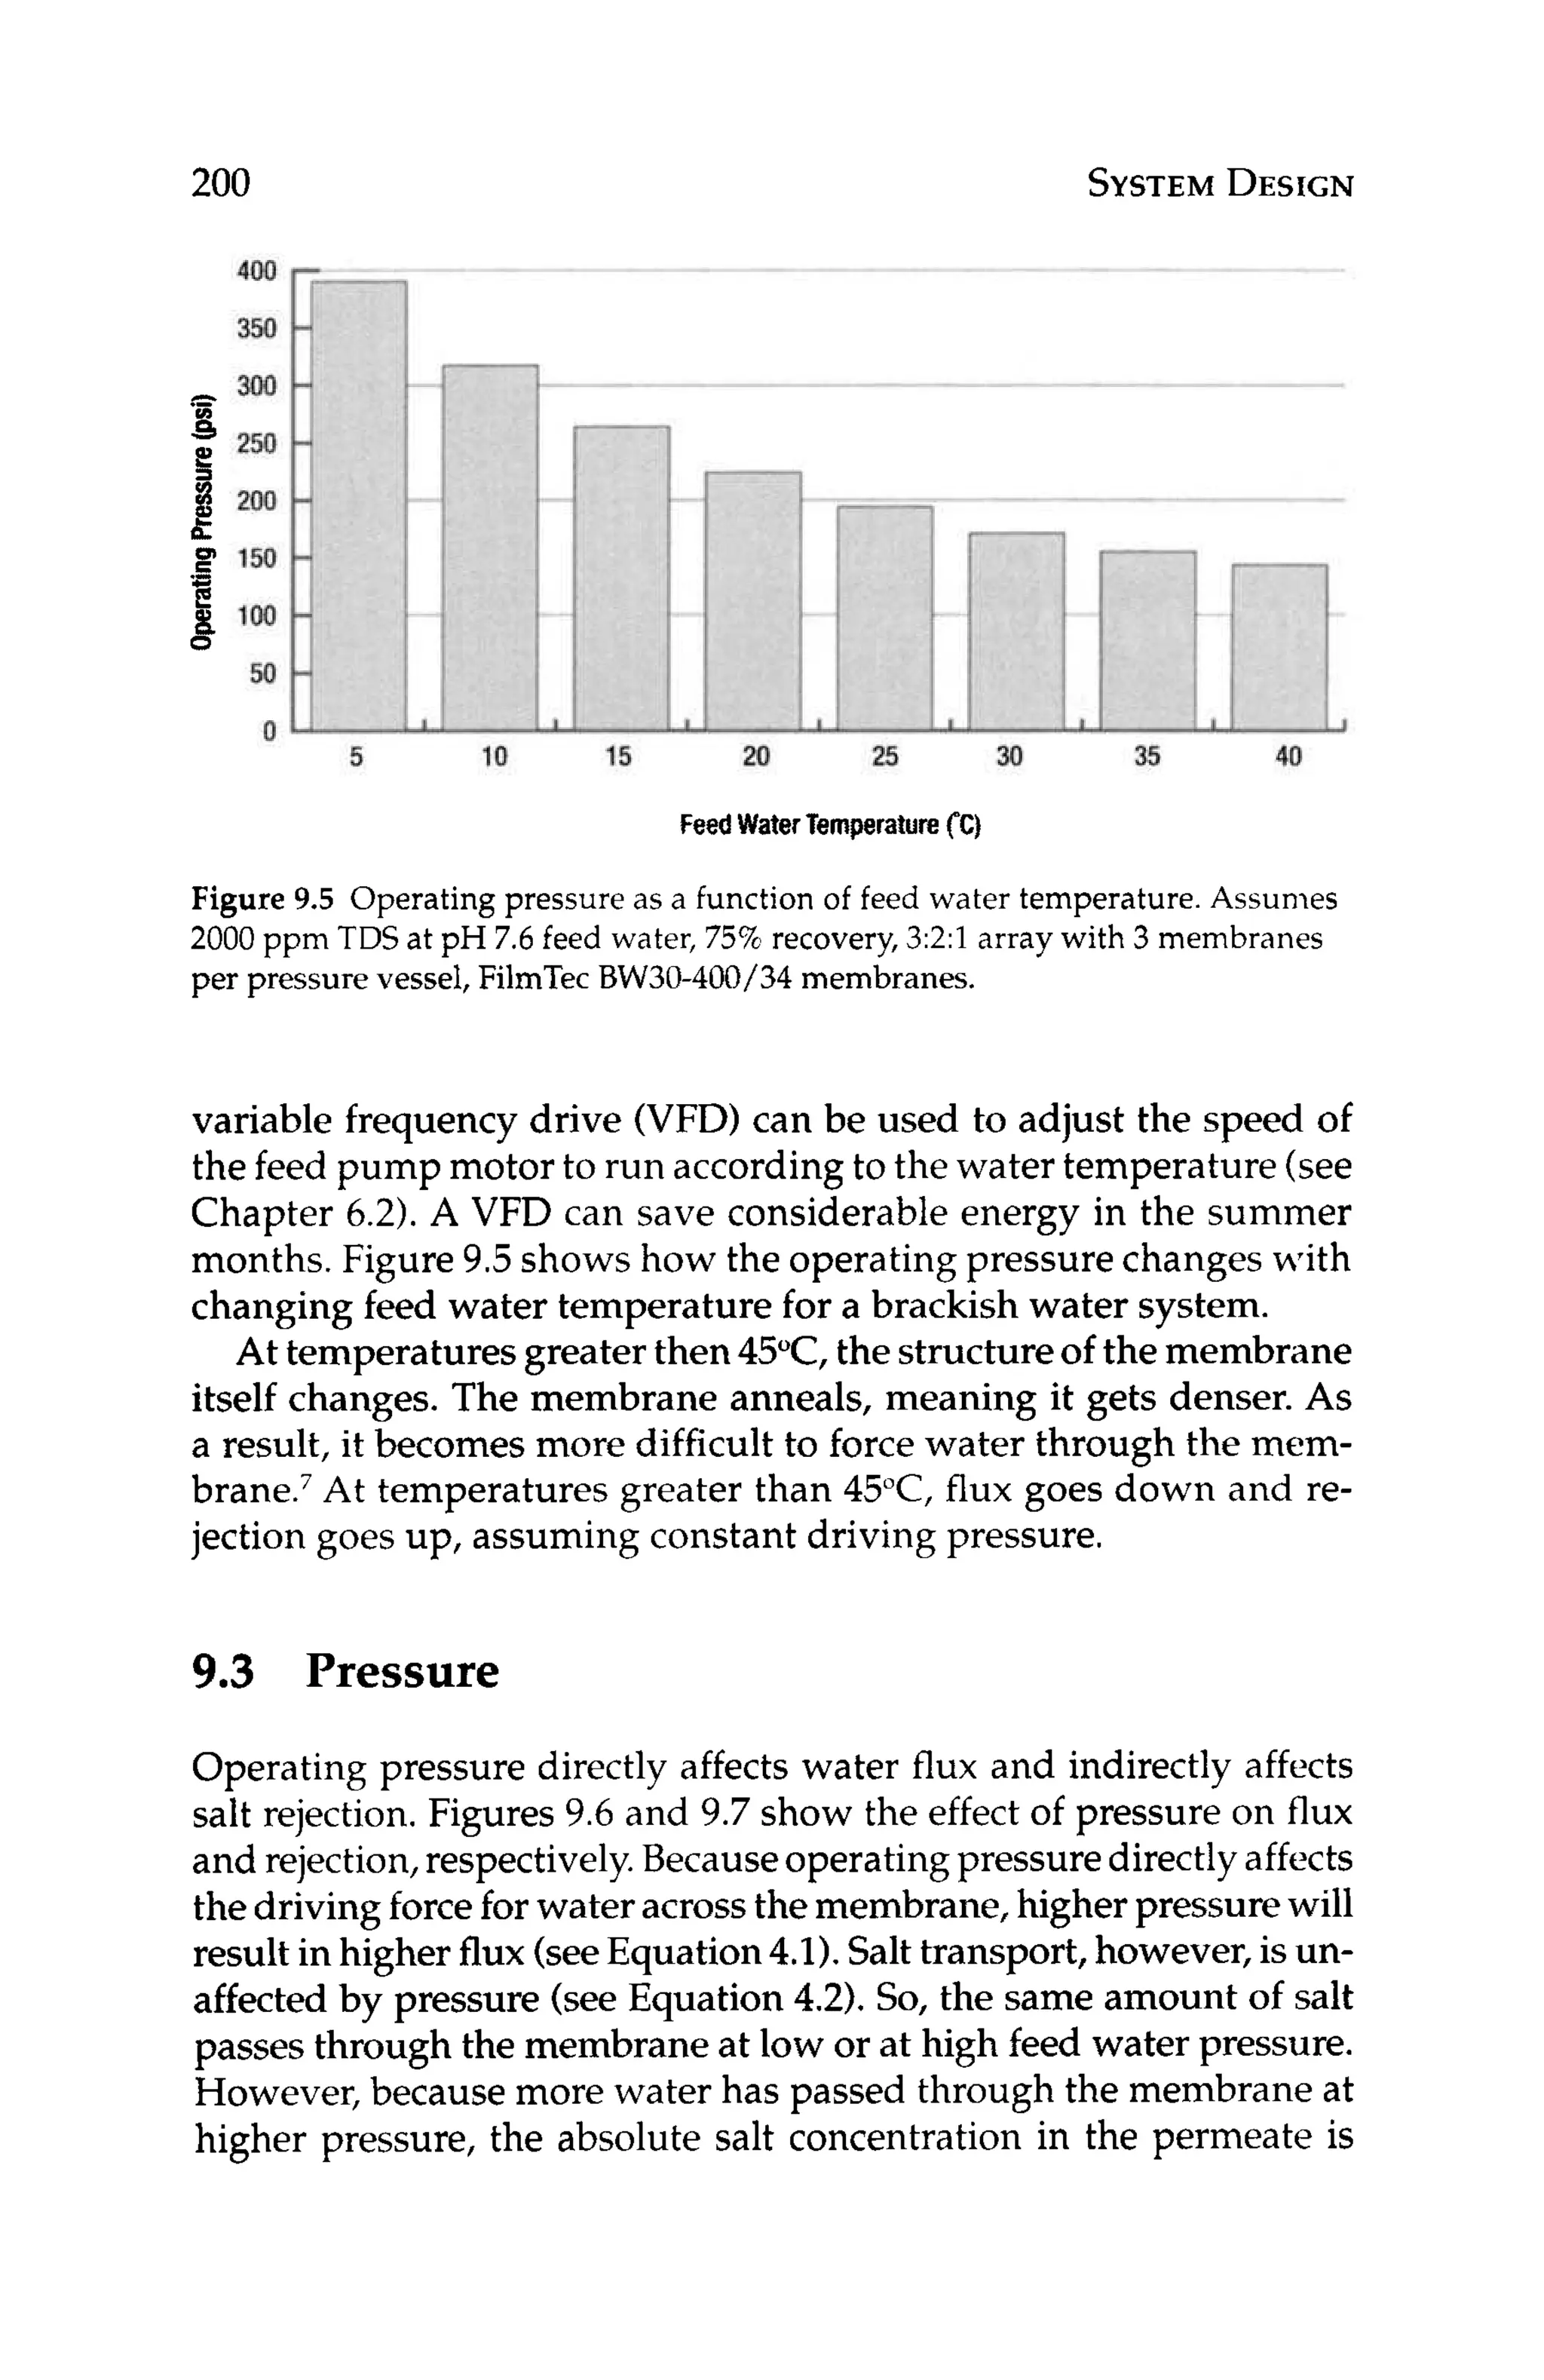


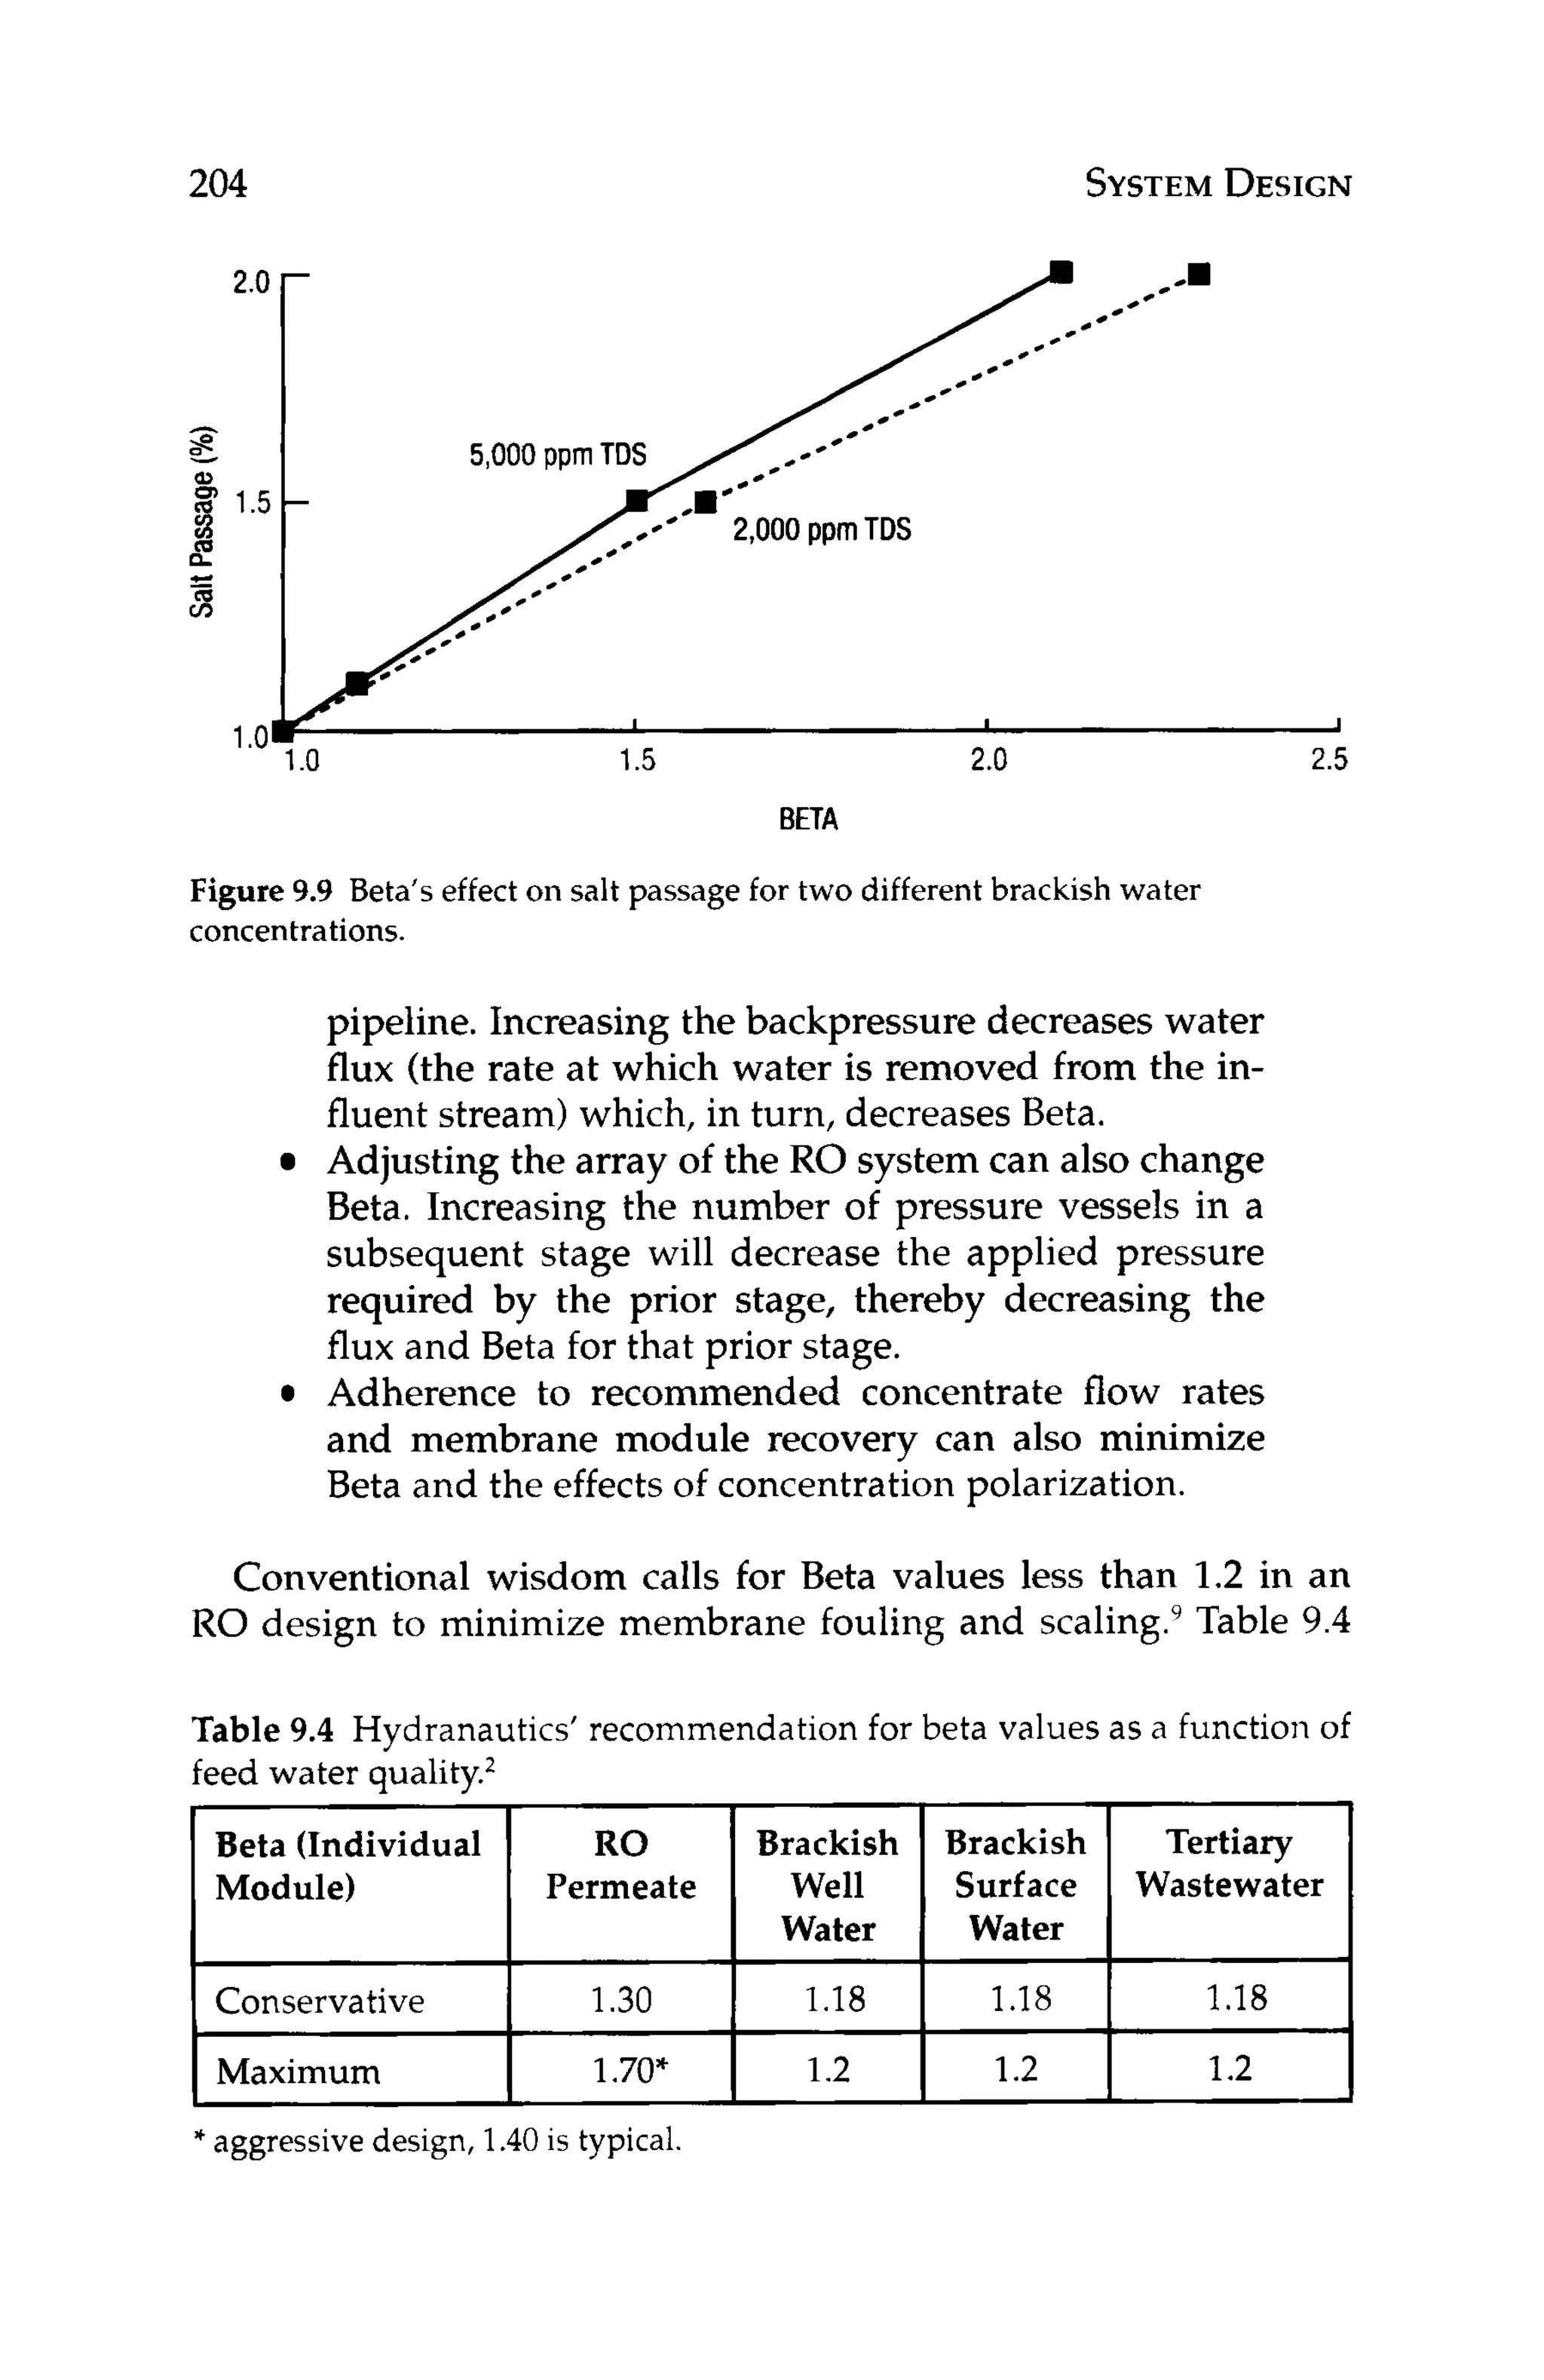
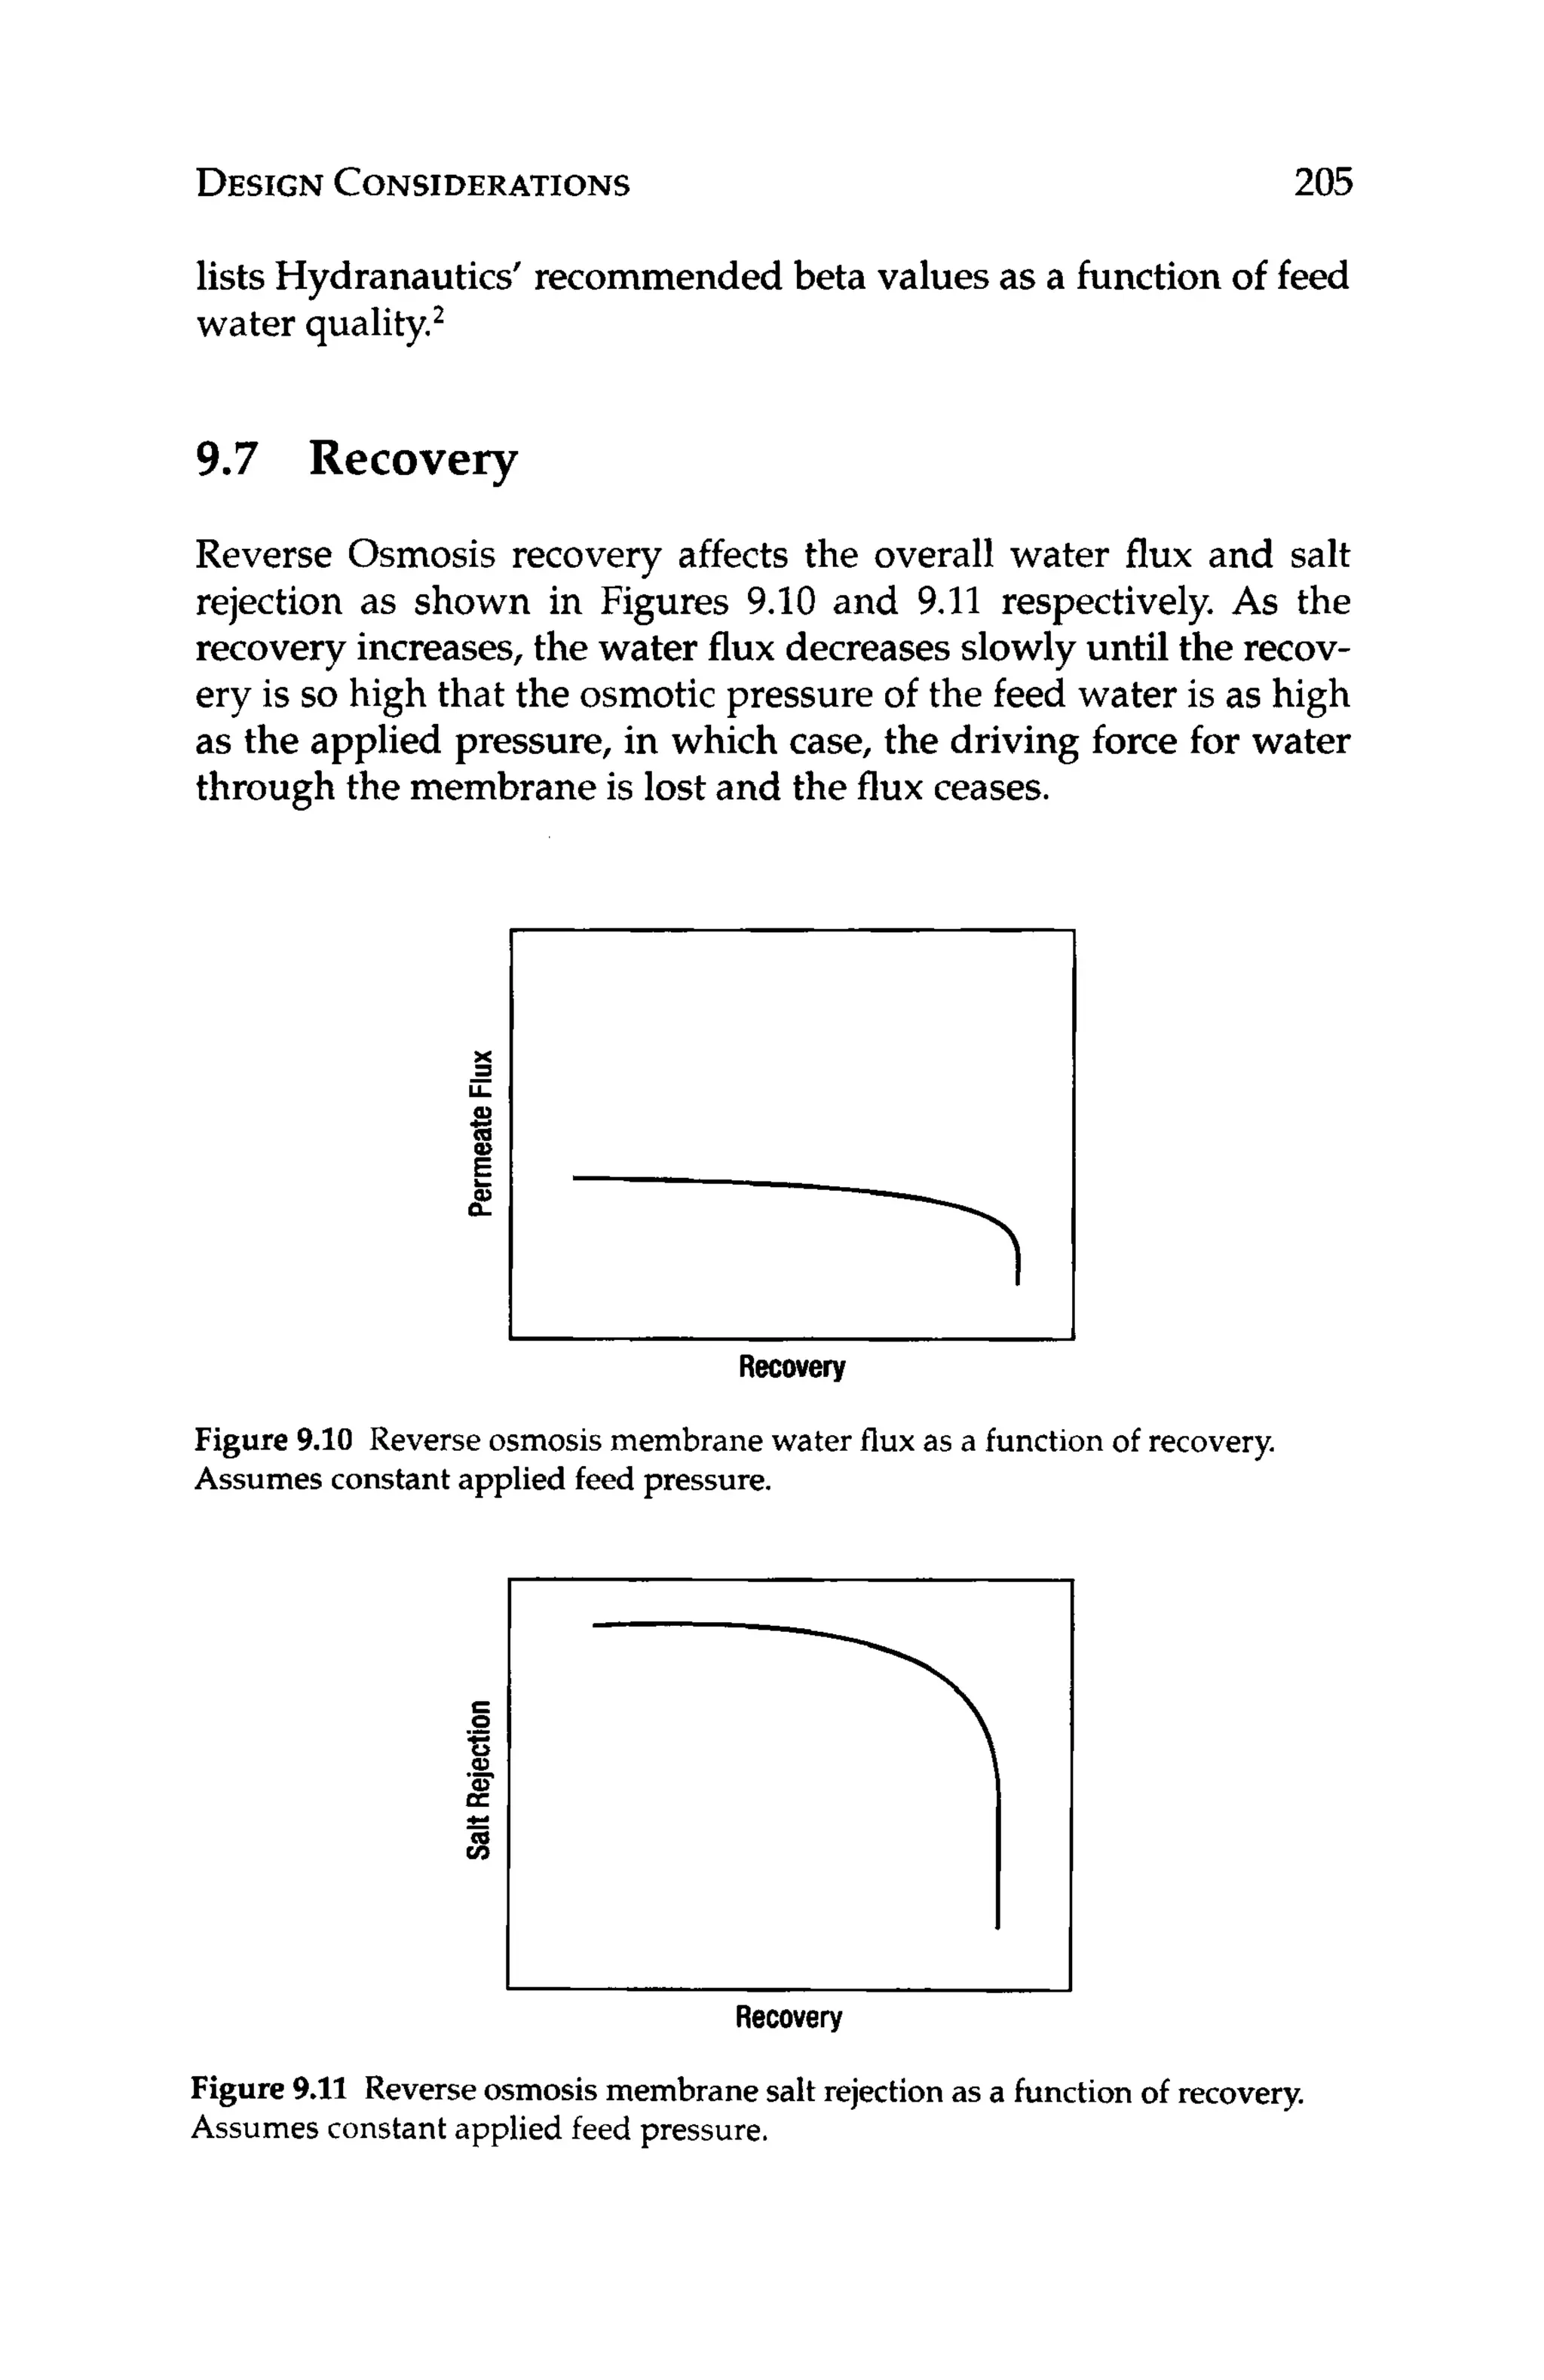


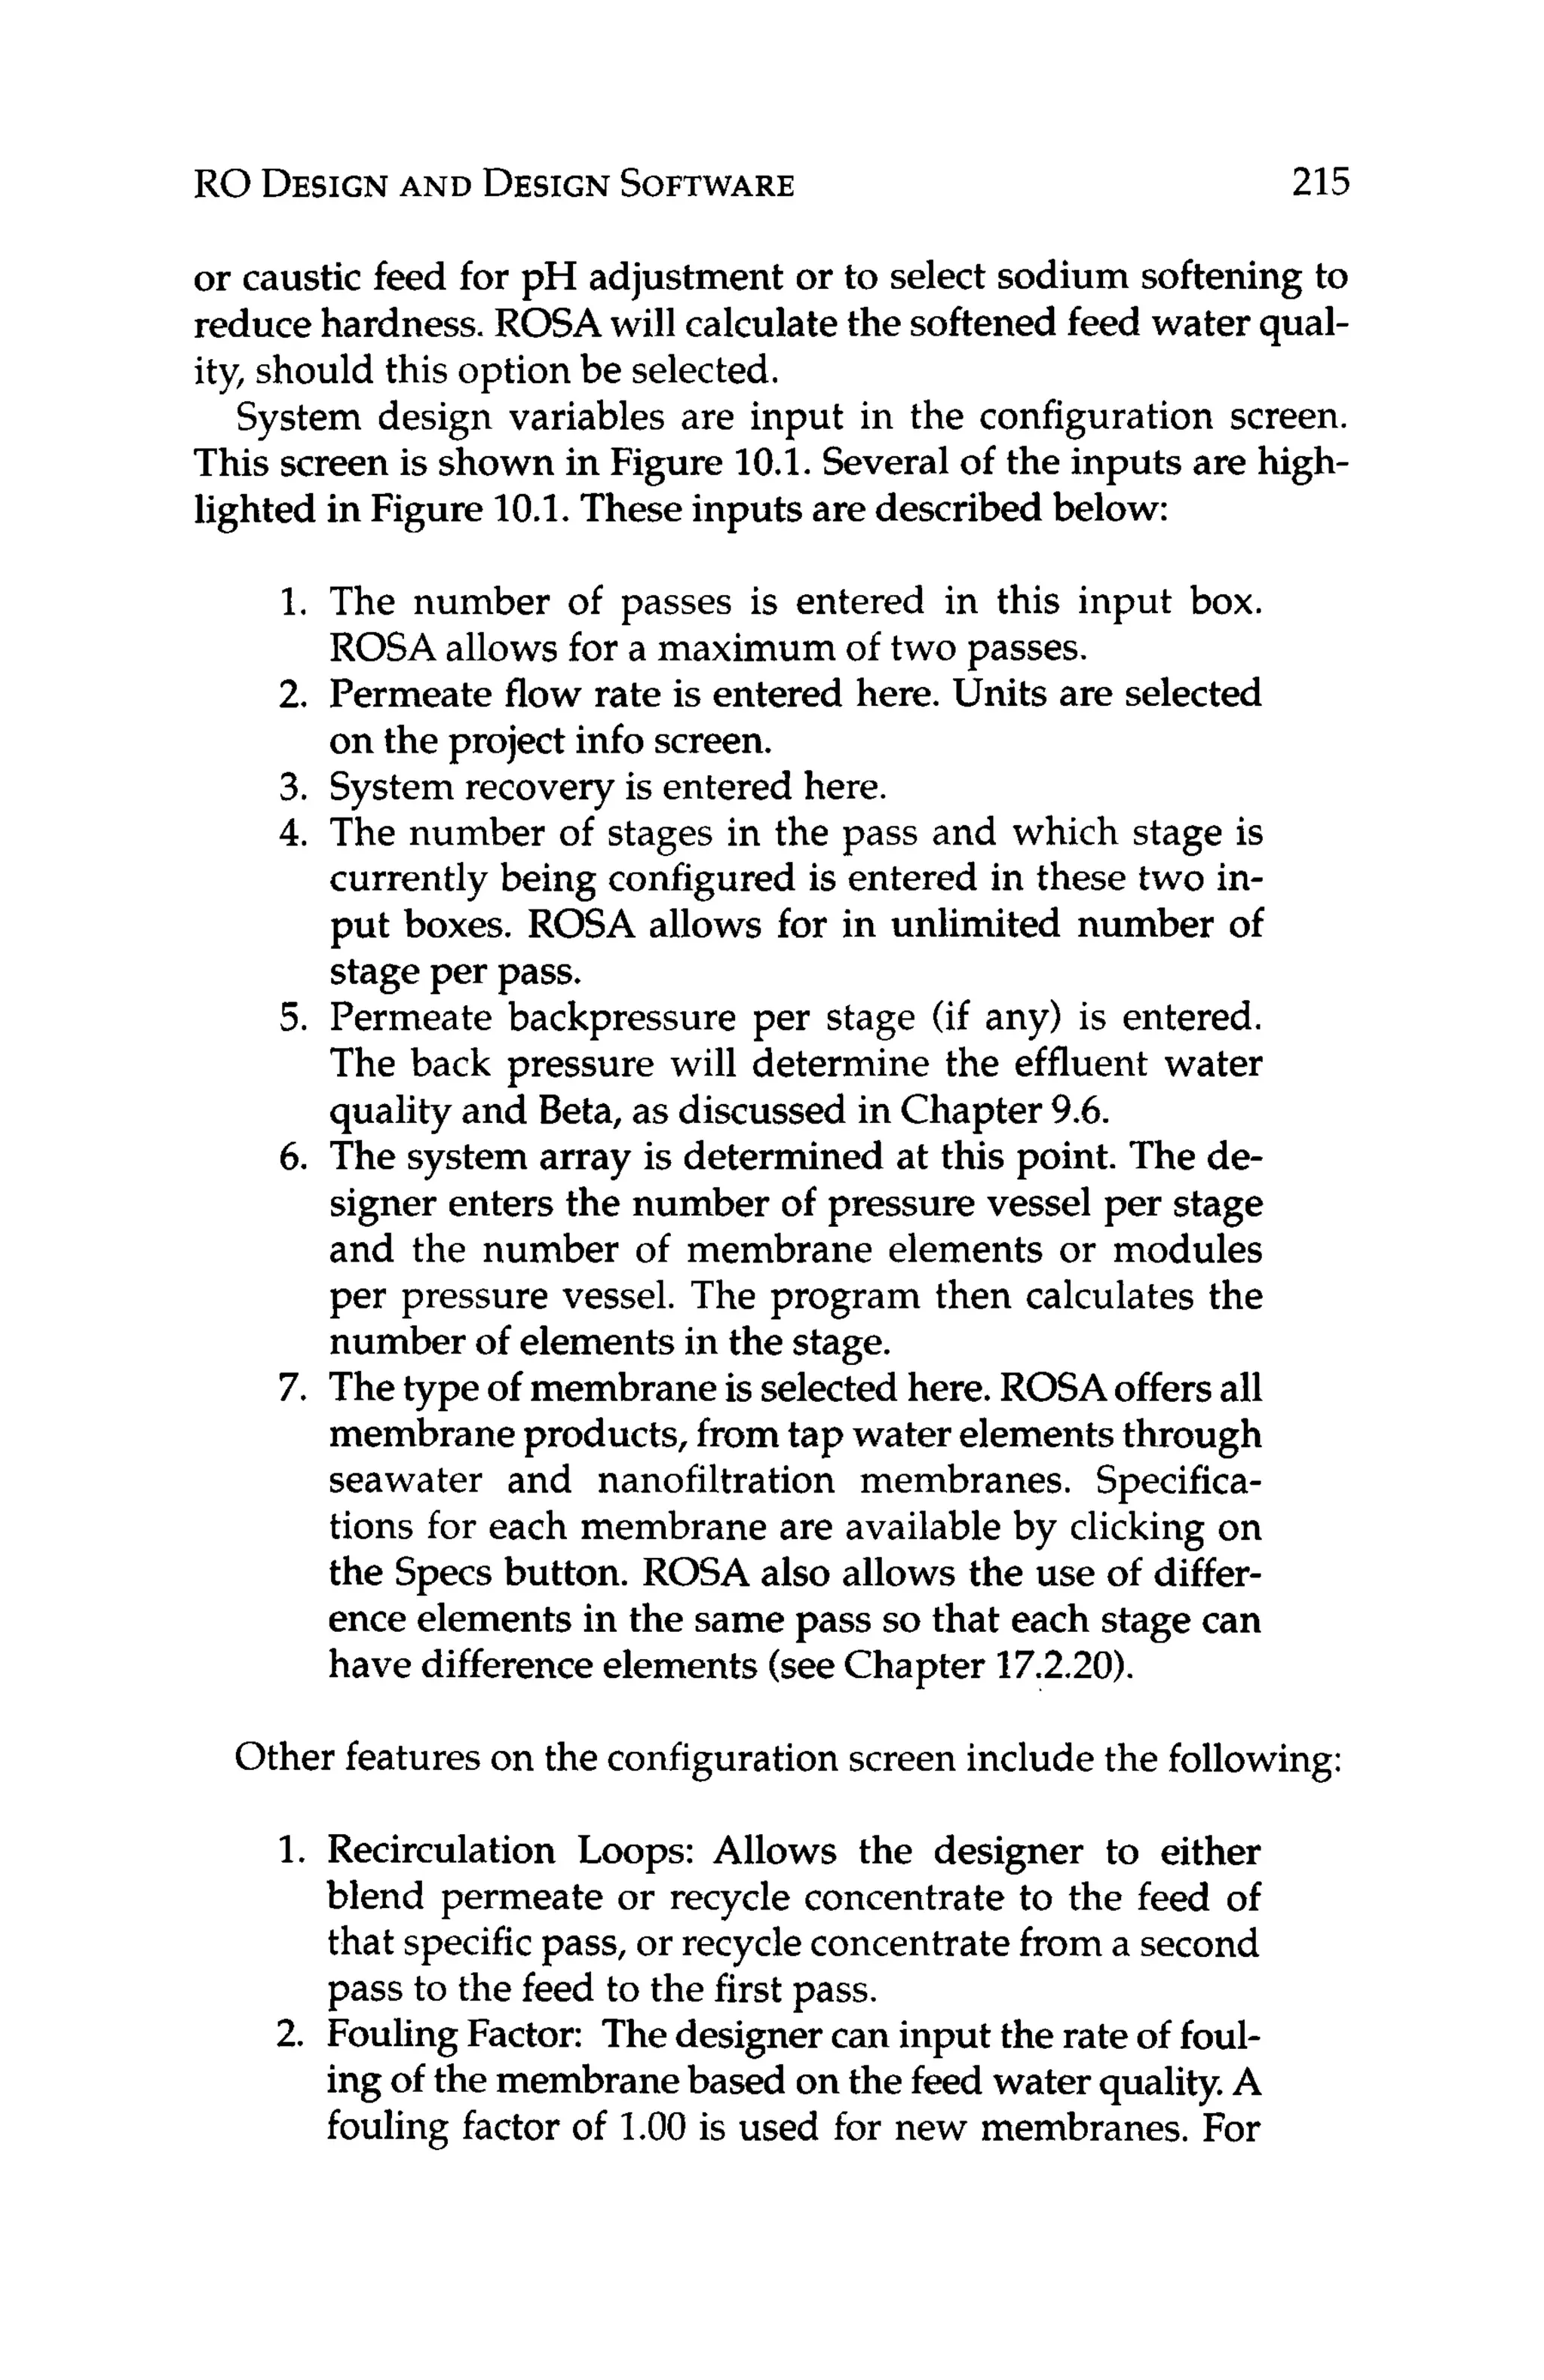
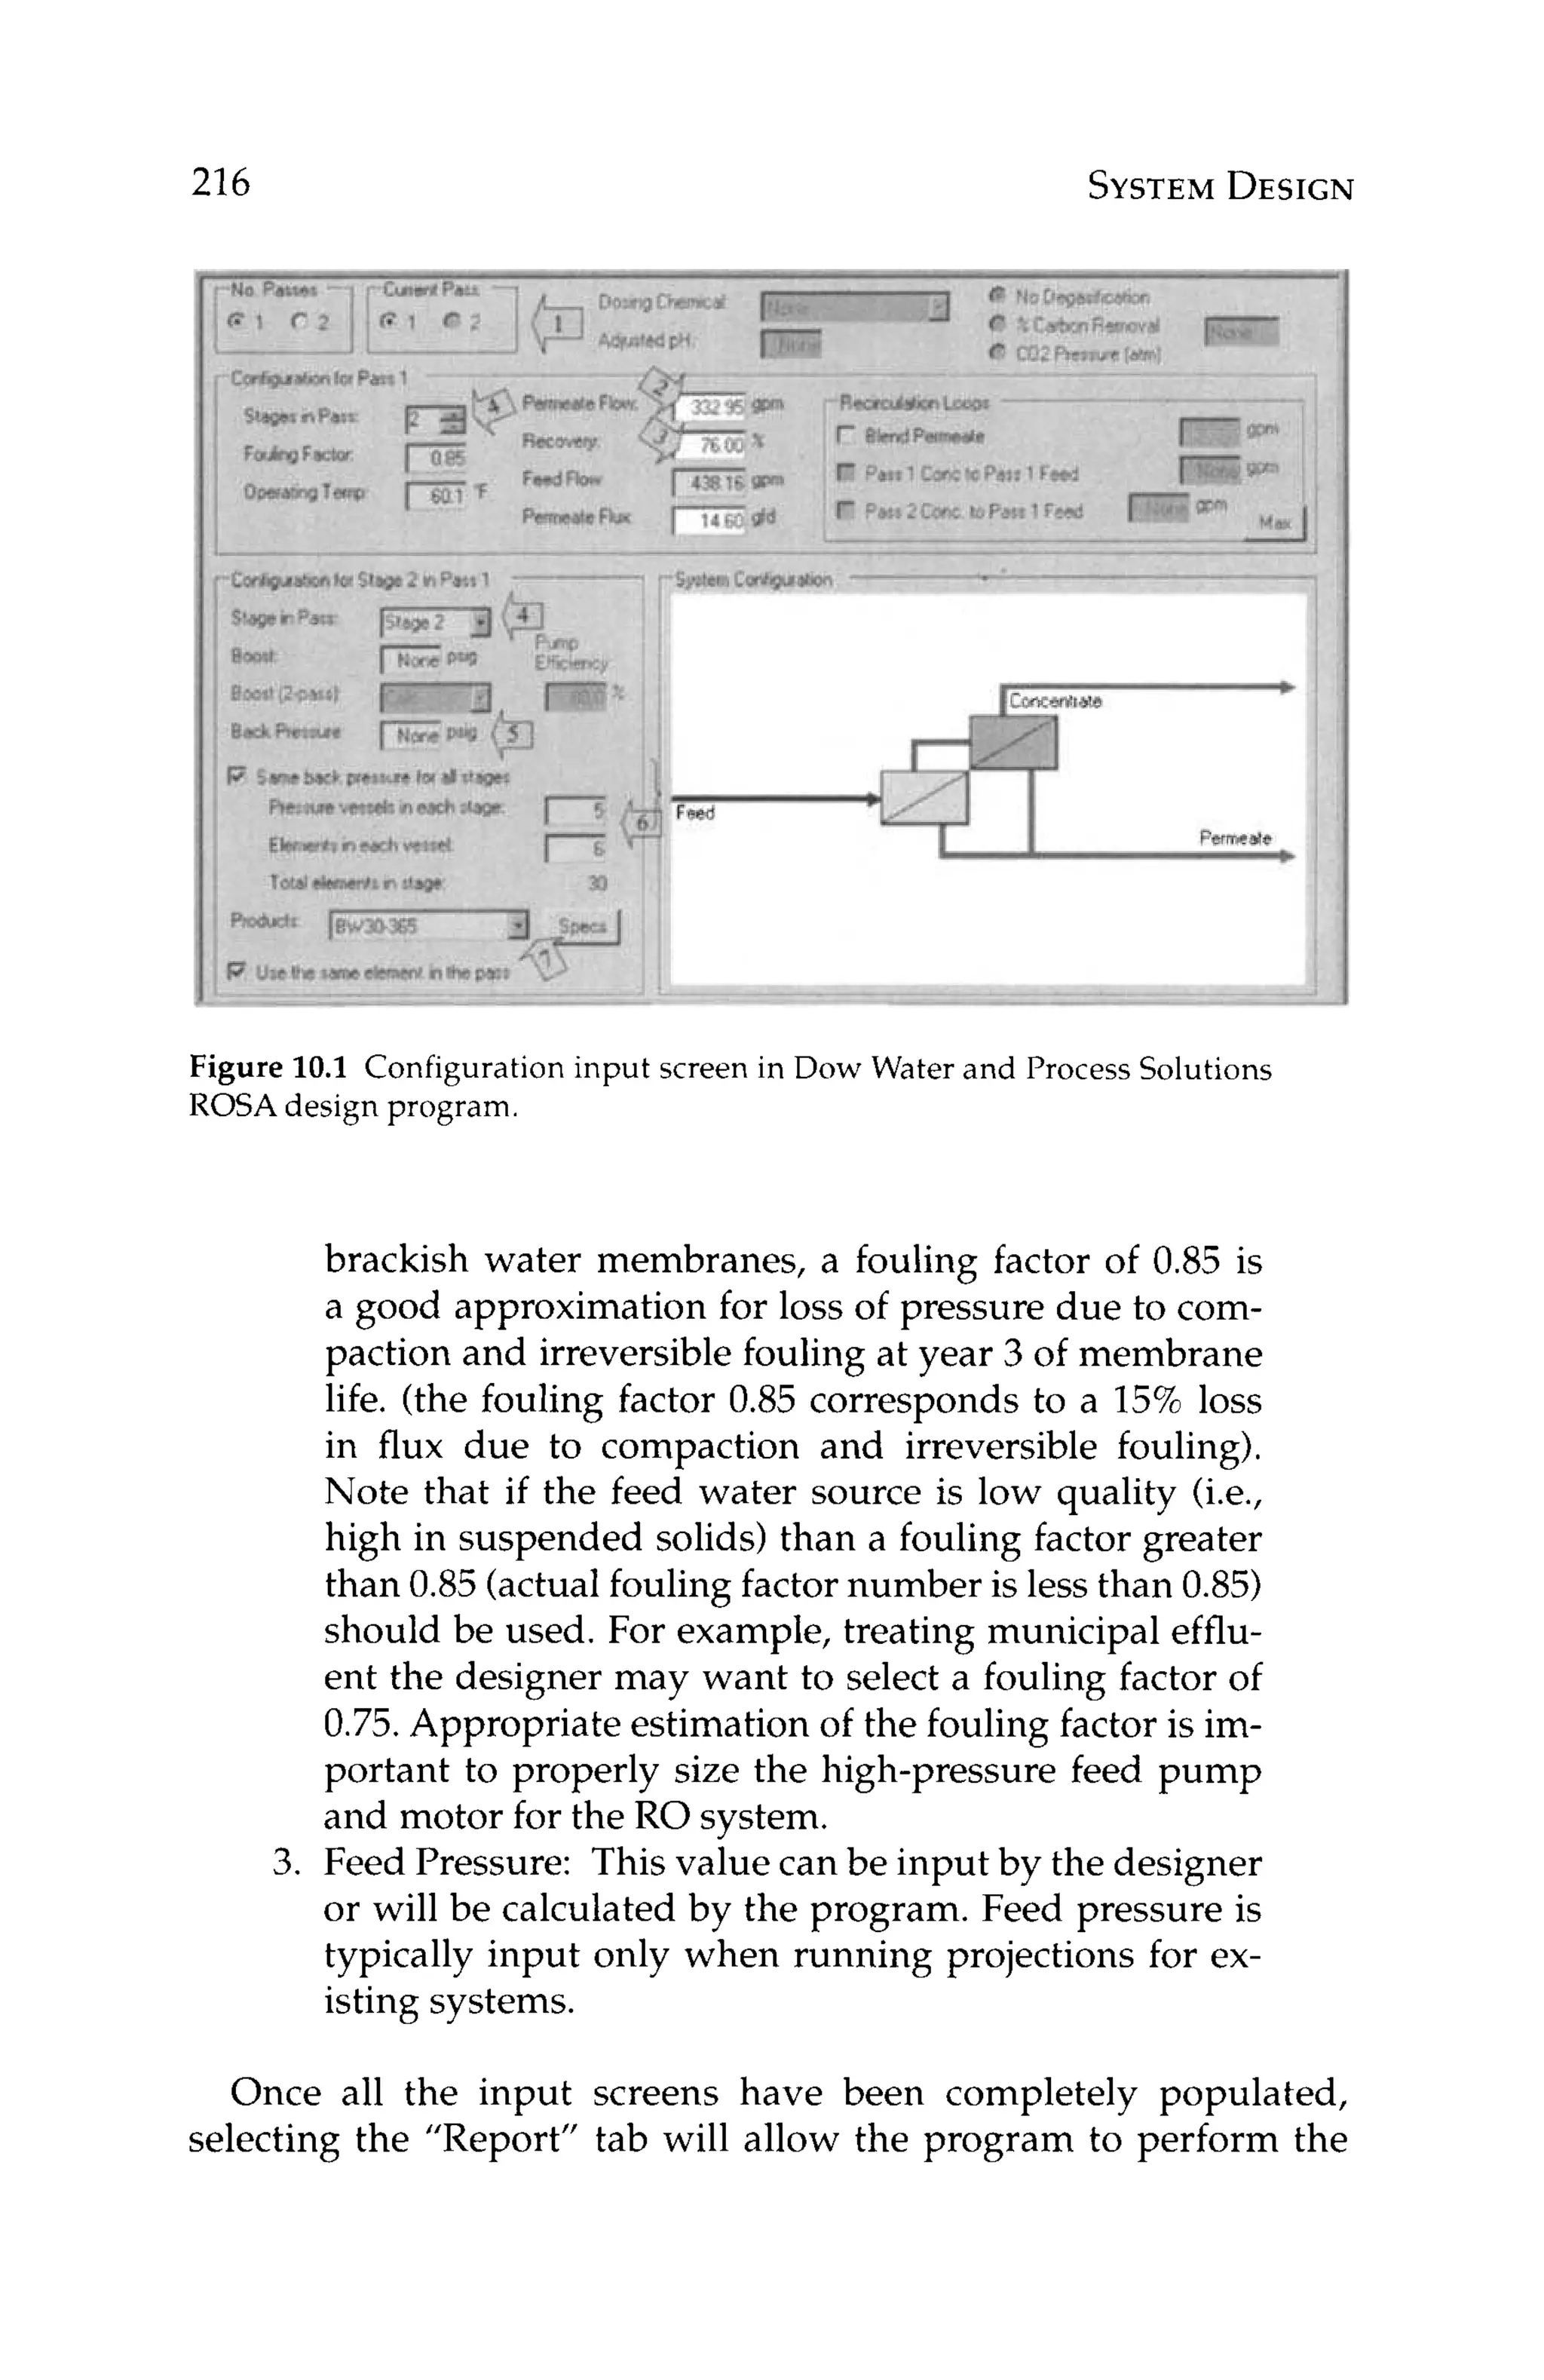
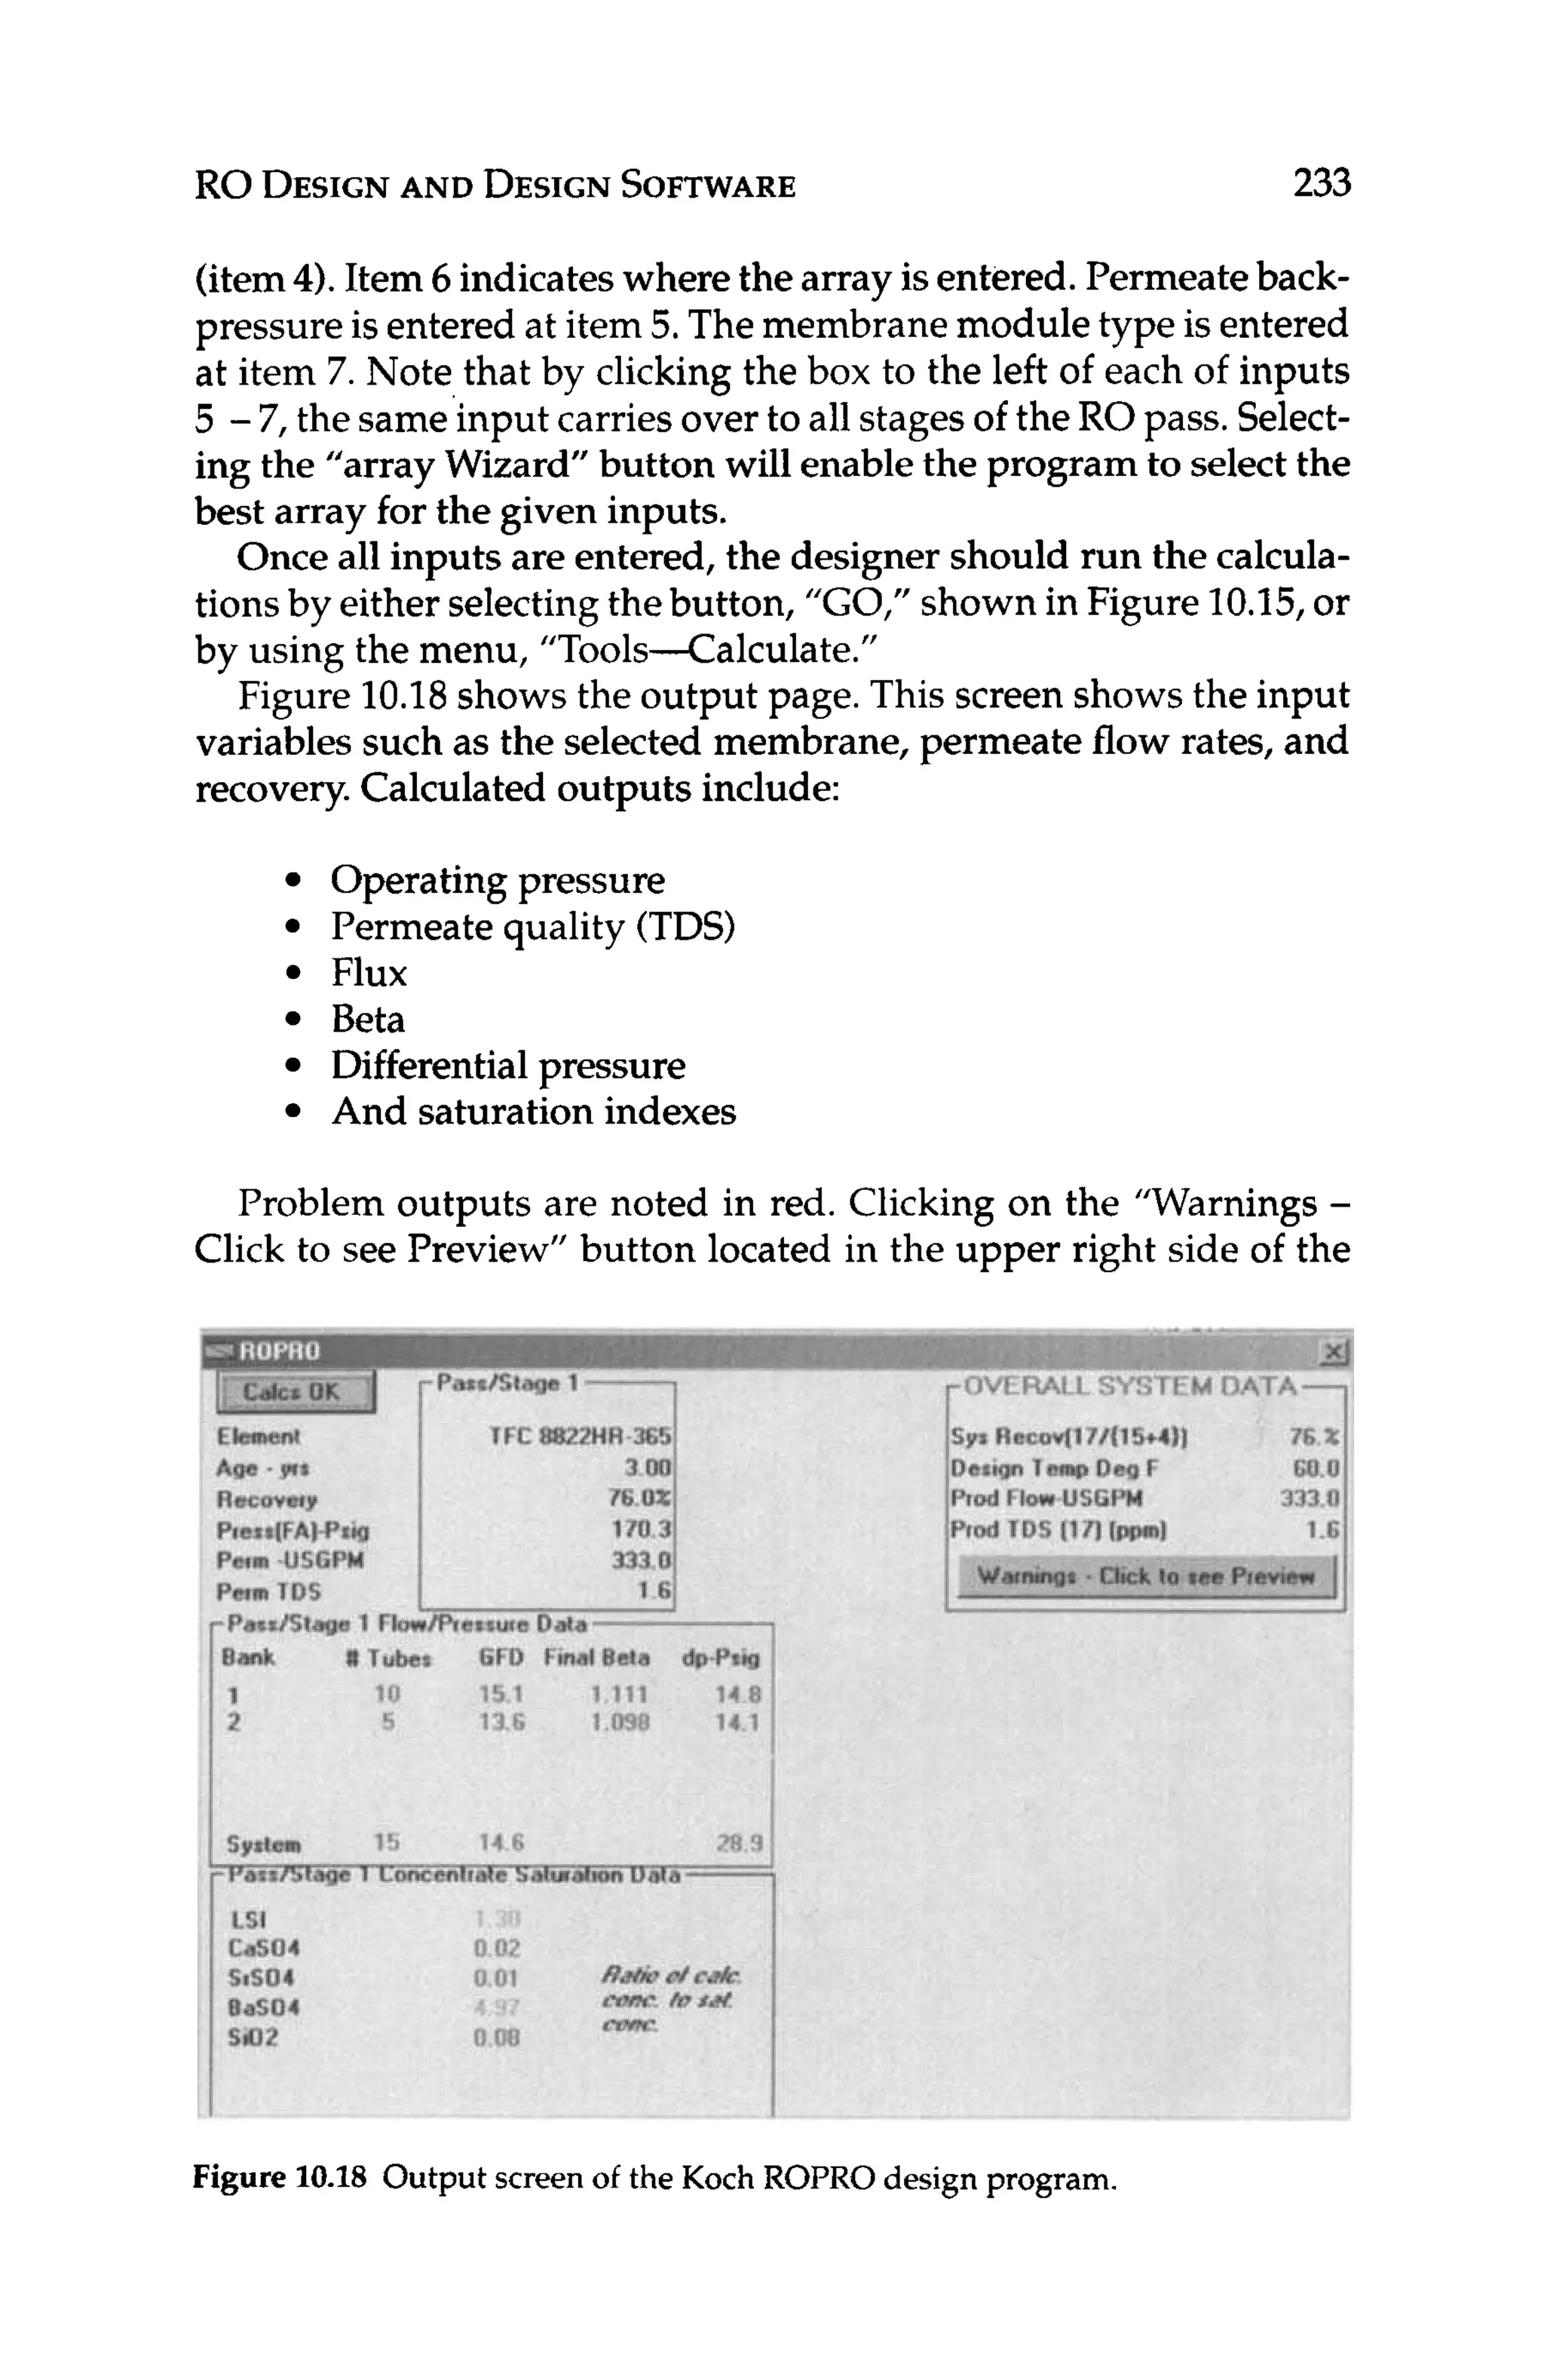
![212 SYSTEM
DESIGN
Having selected the appropriate water flux and membrane type,
the designer can use equation 10.1 to back calculate how many
membrane modules are required to meet the desired productivity.
J, = FP* 1/MA * 1/N (10.1)
where:
J,, = water flux, gfd
F = product flow rate, gallons/day
N = number of modules
MA = membrane area per module
Solvingequation 10.1for the number of modules, N, can give the
designer an idea of what the array might look like. For a two-stage,
75% recovery system with a tapered design, 2 / 3 of the total num-
ber of modules would be in the first stage and the remaining 1/3
would be in the second stage. Once the array has been estimated,
the design can be optimized with respect to other design variables
including flow rates, scaling indexes,recovery, and Beta.
At this point continuing to create a design by hand calculationis
very tedious considering all the variables that must be addressed
by the design. Thus, design software has been developed to aid the
designer in developing a design of an RO system. Some membrane
manufacturers have made available to the public, design software
that is specific for their membranes. Each software package, while
different in presentation, delivers the same result: design of the RO
unit, including array, operating pressure, scaling indices, and prod-
uct and concentrate water qualities.
The software is based on stabilized, nominal performance of the
membrane selected under design conditions. Actual performance
may vary up to +/-15% of nominal, according to the Dow Water
and Process Solutions-FilmTec Technical Manual.' The software
will give warnings when the basic element operating parameters
are exceeded, such as high element recovery or low concentrate
flow. However, the software will not give warnings when the over-
all design is not practical. In fact, the Dow Water and Process Solu-
tions FilmTec TechnicalManual states:
"ROSA [Reverse Osmosis System Analysis] 6 only projects
reverse osmosis and nanofiltration system performance from
a User-controlled set of data input and design decisions. The](https://image.slidesharecdn.com/reverseosmosispdf-230430025016-321d174f/75/Reverse_Osmosis_pdf-pdf-234-2048.jpg)
![RO DESIGN
AND DESIGN
SOFTWARE 213
1 Membrane Manufacturer Design Software Package
Dow Water Solutions--FilmTec Reverse Osmosis System Analysis
(Minneapolis,MN) (ROSA)
www.dow.com
program does not judge whether a system design is realistic [em-
phasis added] or optimized for a given set o
f conditions. It is
the Useis responsibility to review and judge the system design
based on the anticipated or existing pretreatment, reasonable
design guidelines, and experience.”’
Toray Membrane, USA
(Poway,CAI
www.toraywater.com
(Oceanside,CA)
www.membranes.com
Koch Membrane Systems
Hydranautics
(Wilmington,MA)
www.kochmembrane.com
Hence,experienceand common senseare necessary to ensure the
design selected using the any design software package is realistic,
particularly for feed streams other than well water with SDI <3.
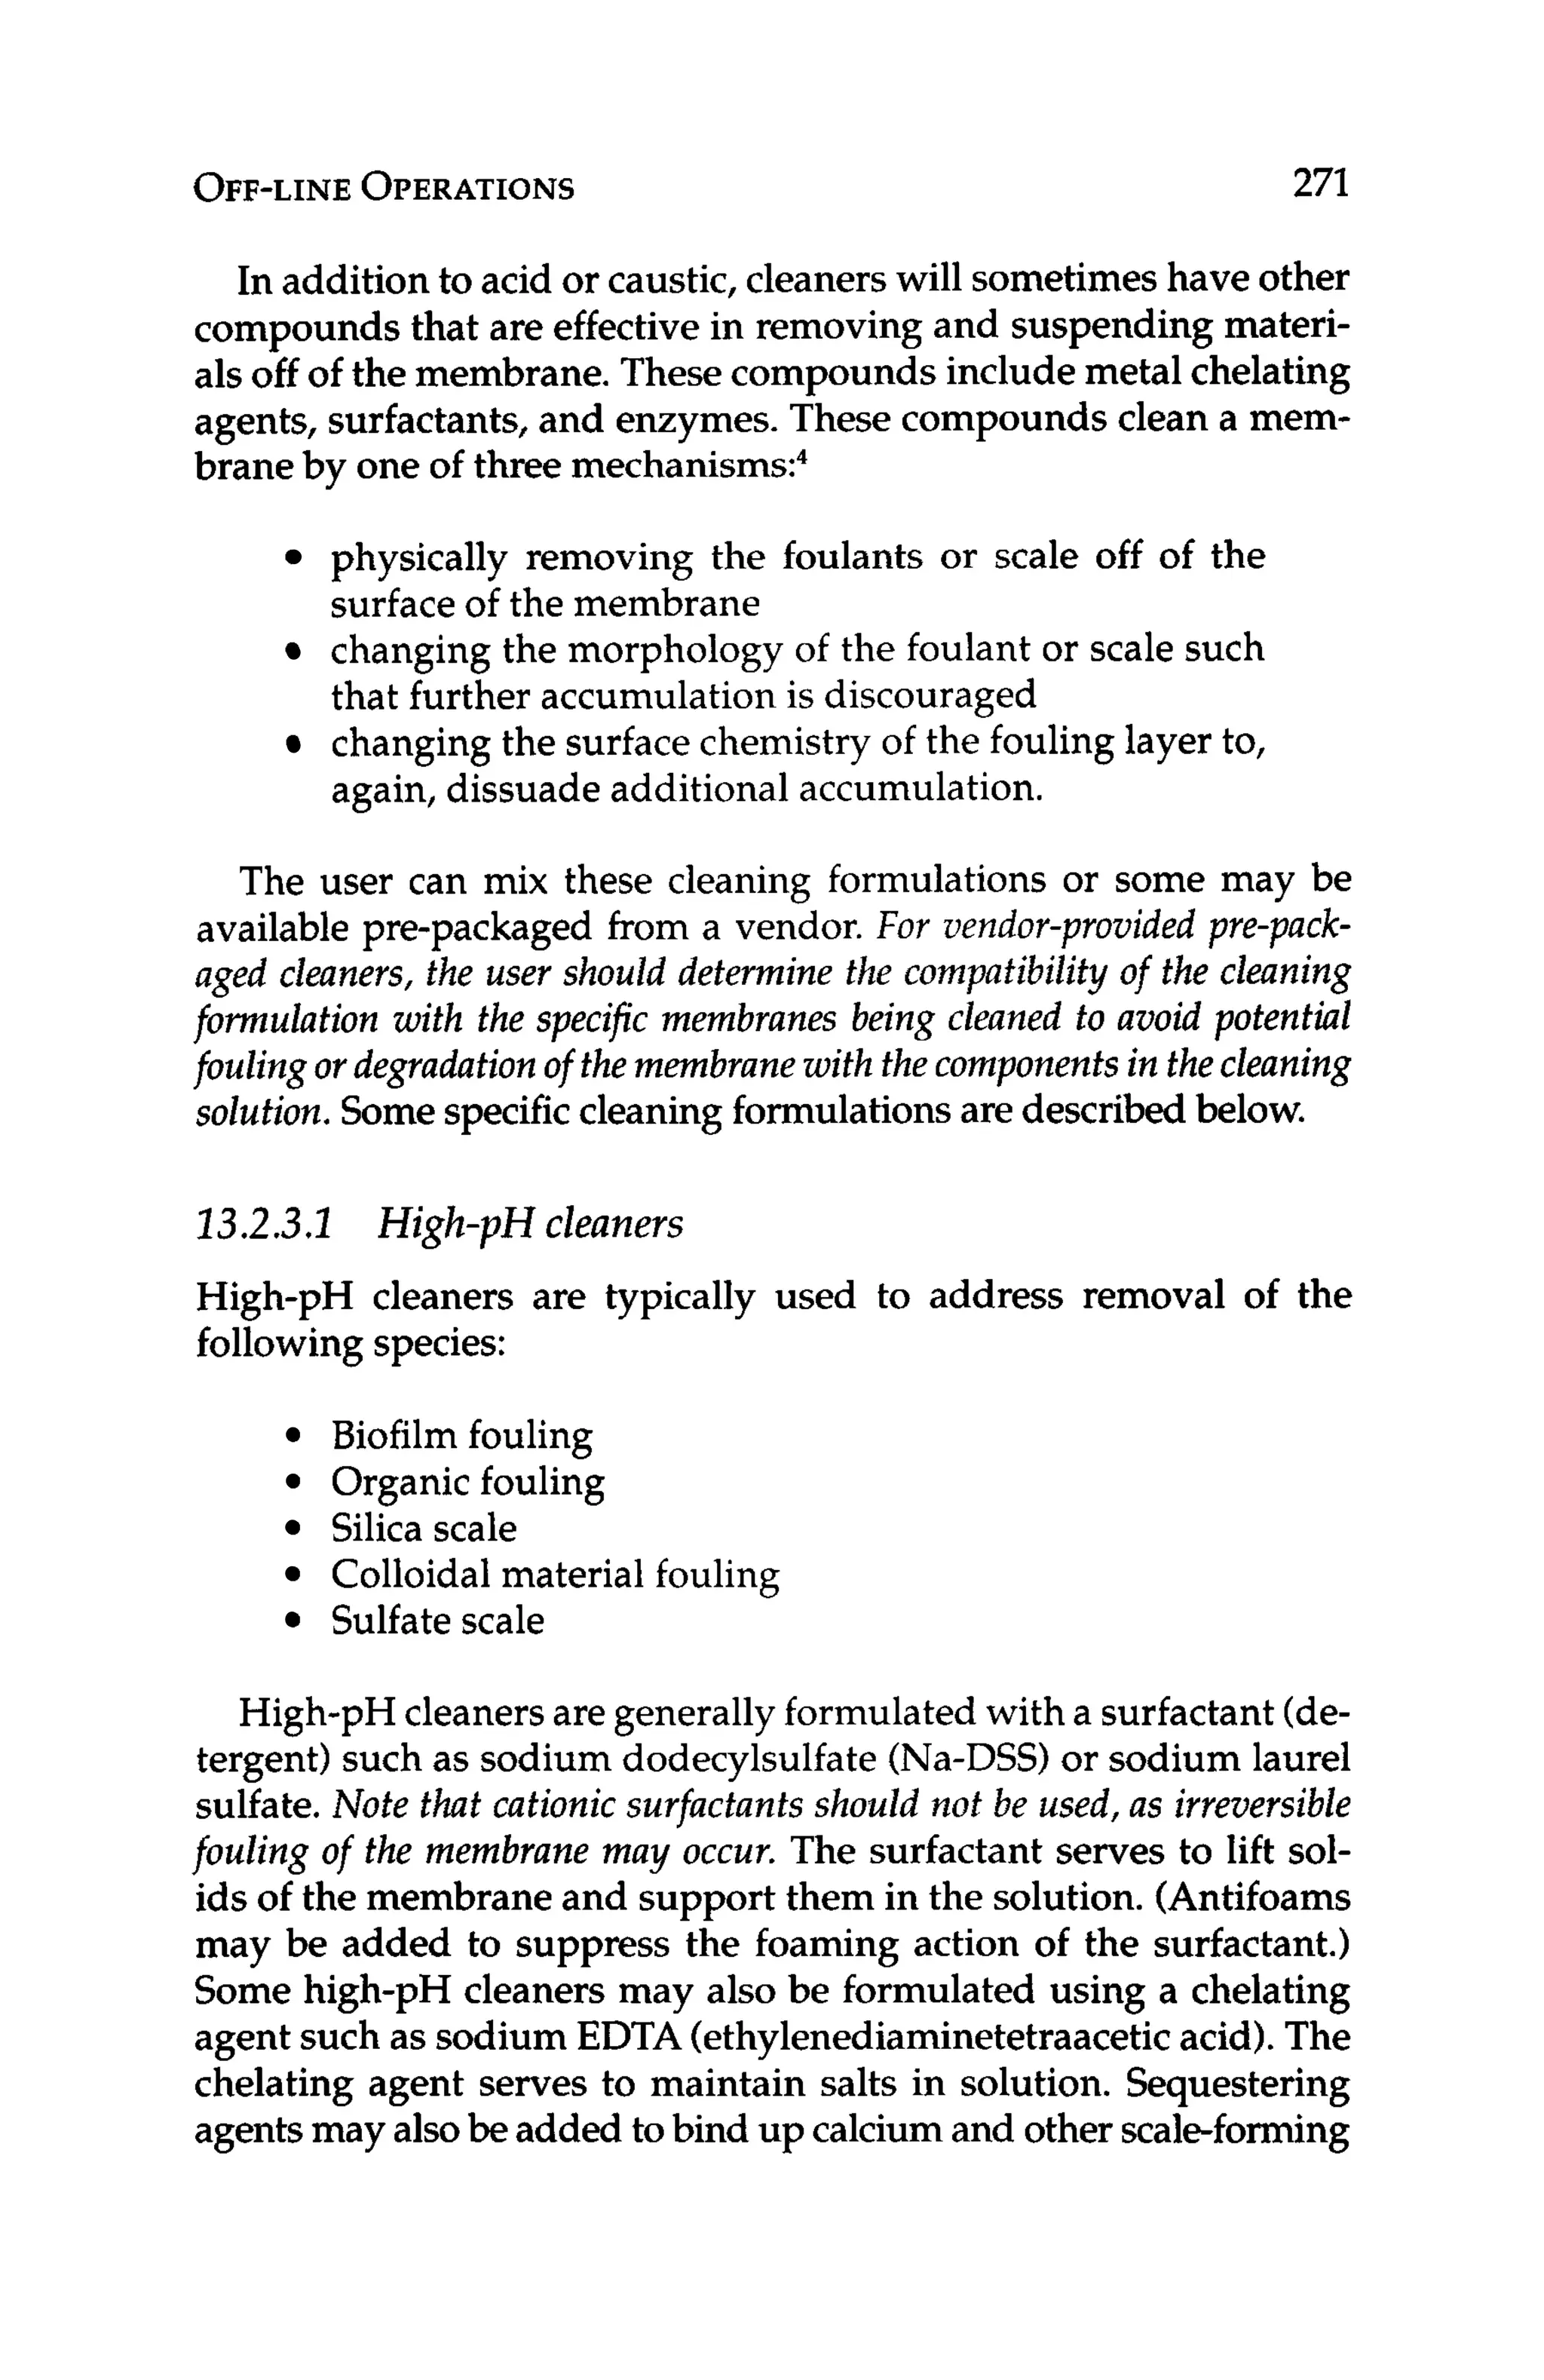
Table 10.1 lists four major US.membrane manufacturers and
their respective design programs that are available to the public.
Each design program is discussed in detail below. The programs
can be downloaded from the manufacturers’ respective websites.
TriSep Corporation, Goleta, California also offers a design pro-
gram that can be downloaded from their website; it is not covered
in this chapter as TriSep is not generally considered a major US
manufacturer. The other major U.S. manufacturer, GE Water &
Process Technologies (Trevose,Pennsylvania), does not offer a de-
sign program that is availableto the public. Applied Membraneso,
Inc., (Vista, California),another U.S. manufacturer,does not offer a
design program to the public.
~
Toray Design System (TorayDS)
Integrated Membrane SolutionsTM
(IMSDesign)
ROPRO@
Table 1
0
.
1 Four major US suppliers of RO membranes and their design
programs Available to the public via download from their respective
websites.](https://image.slidesharecdn.com/reverseosmosispdf-230430025016-321d174f/75/Reverse_Osmosis_pdf-pdf-235-2048.jpg)


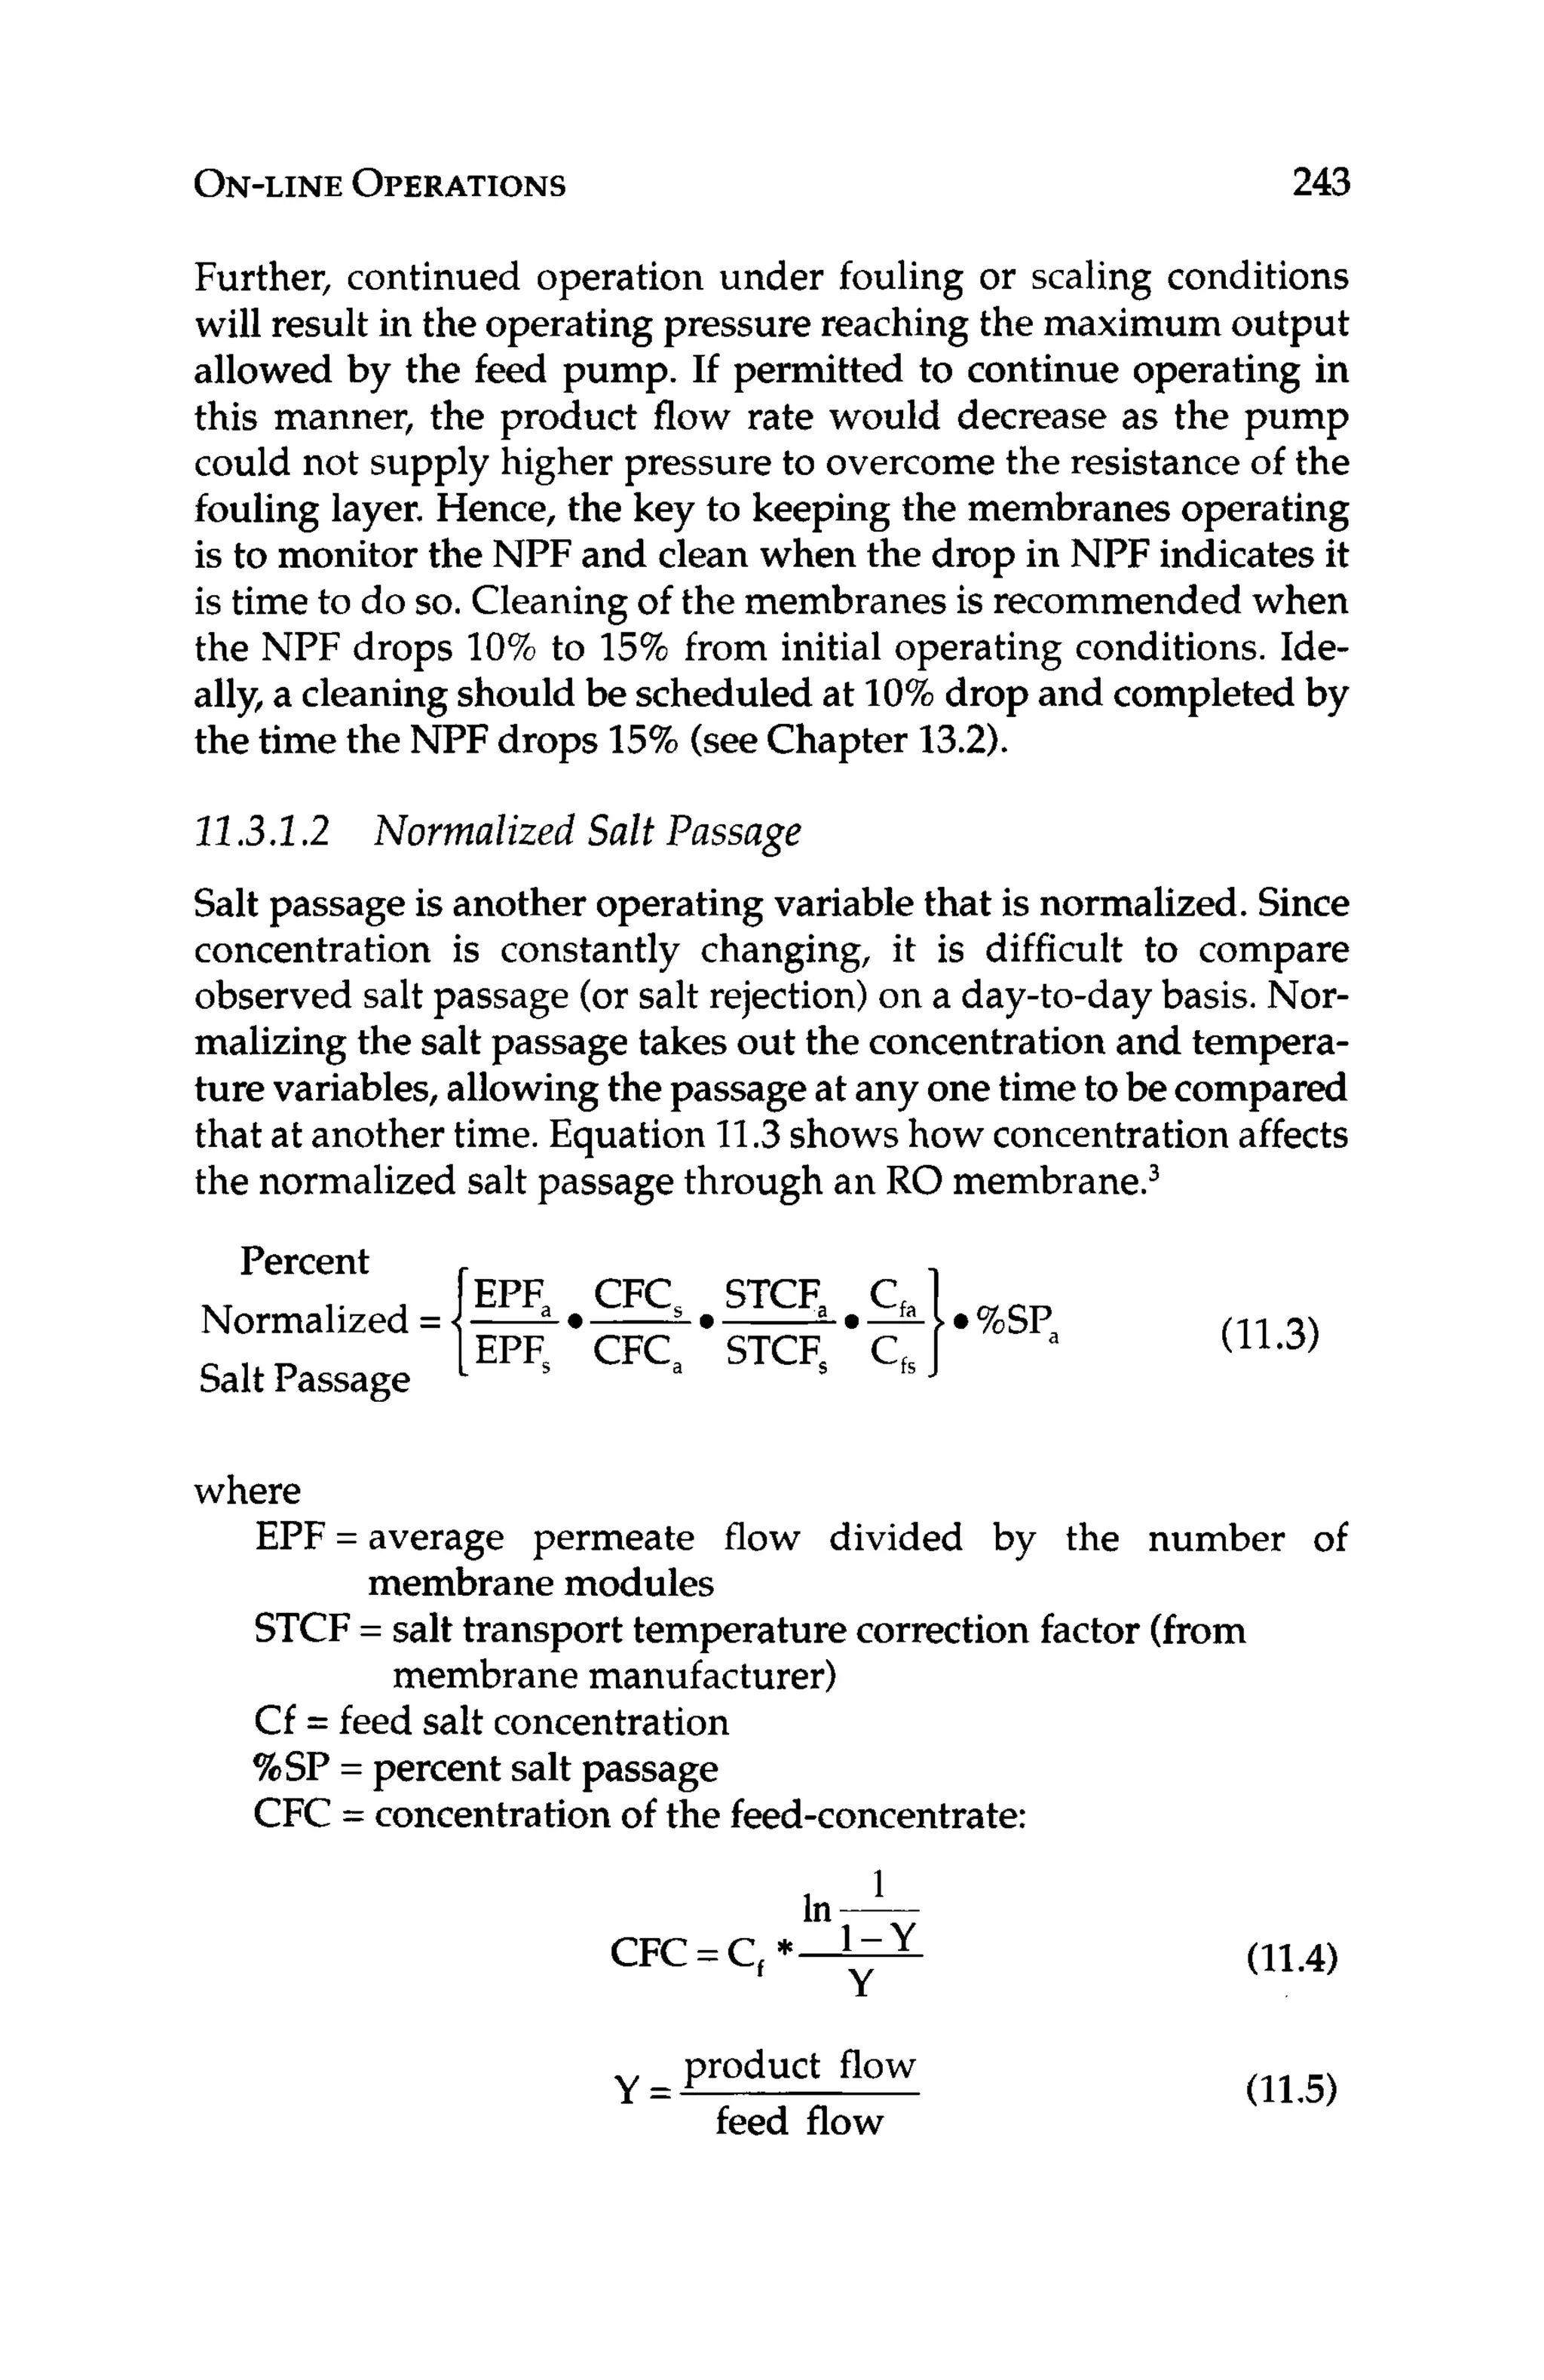
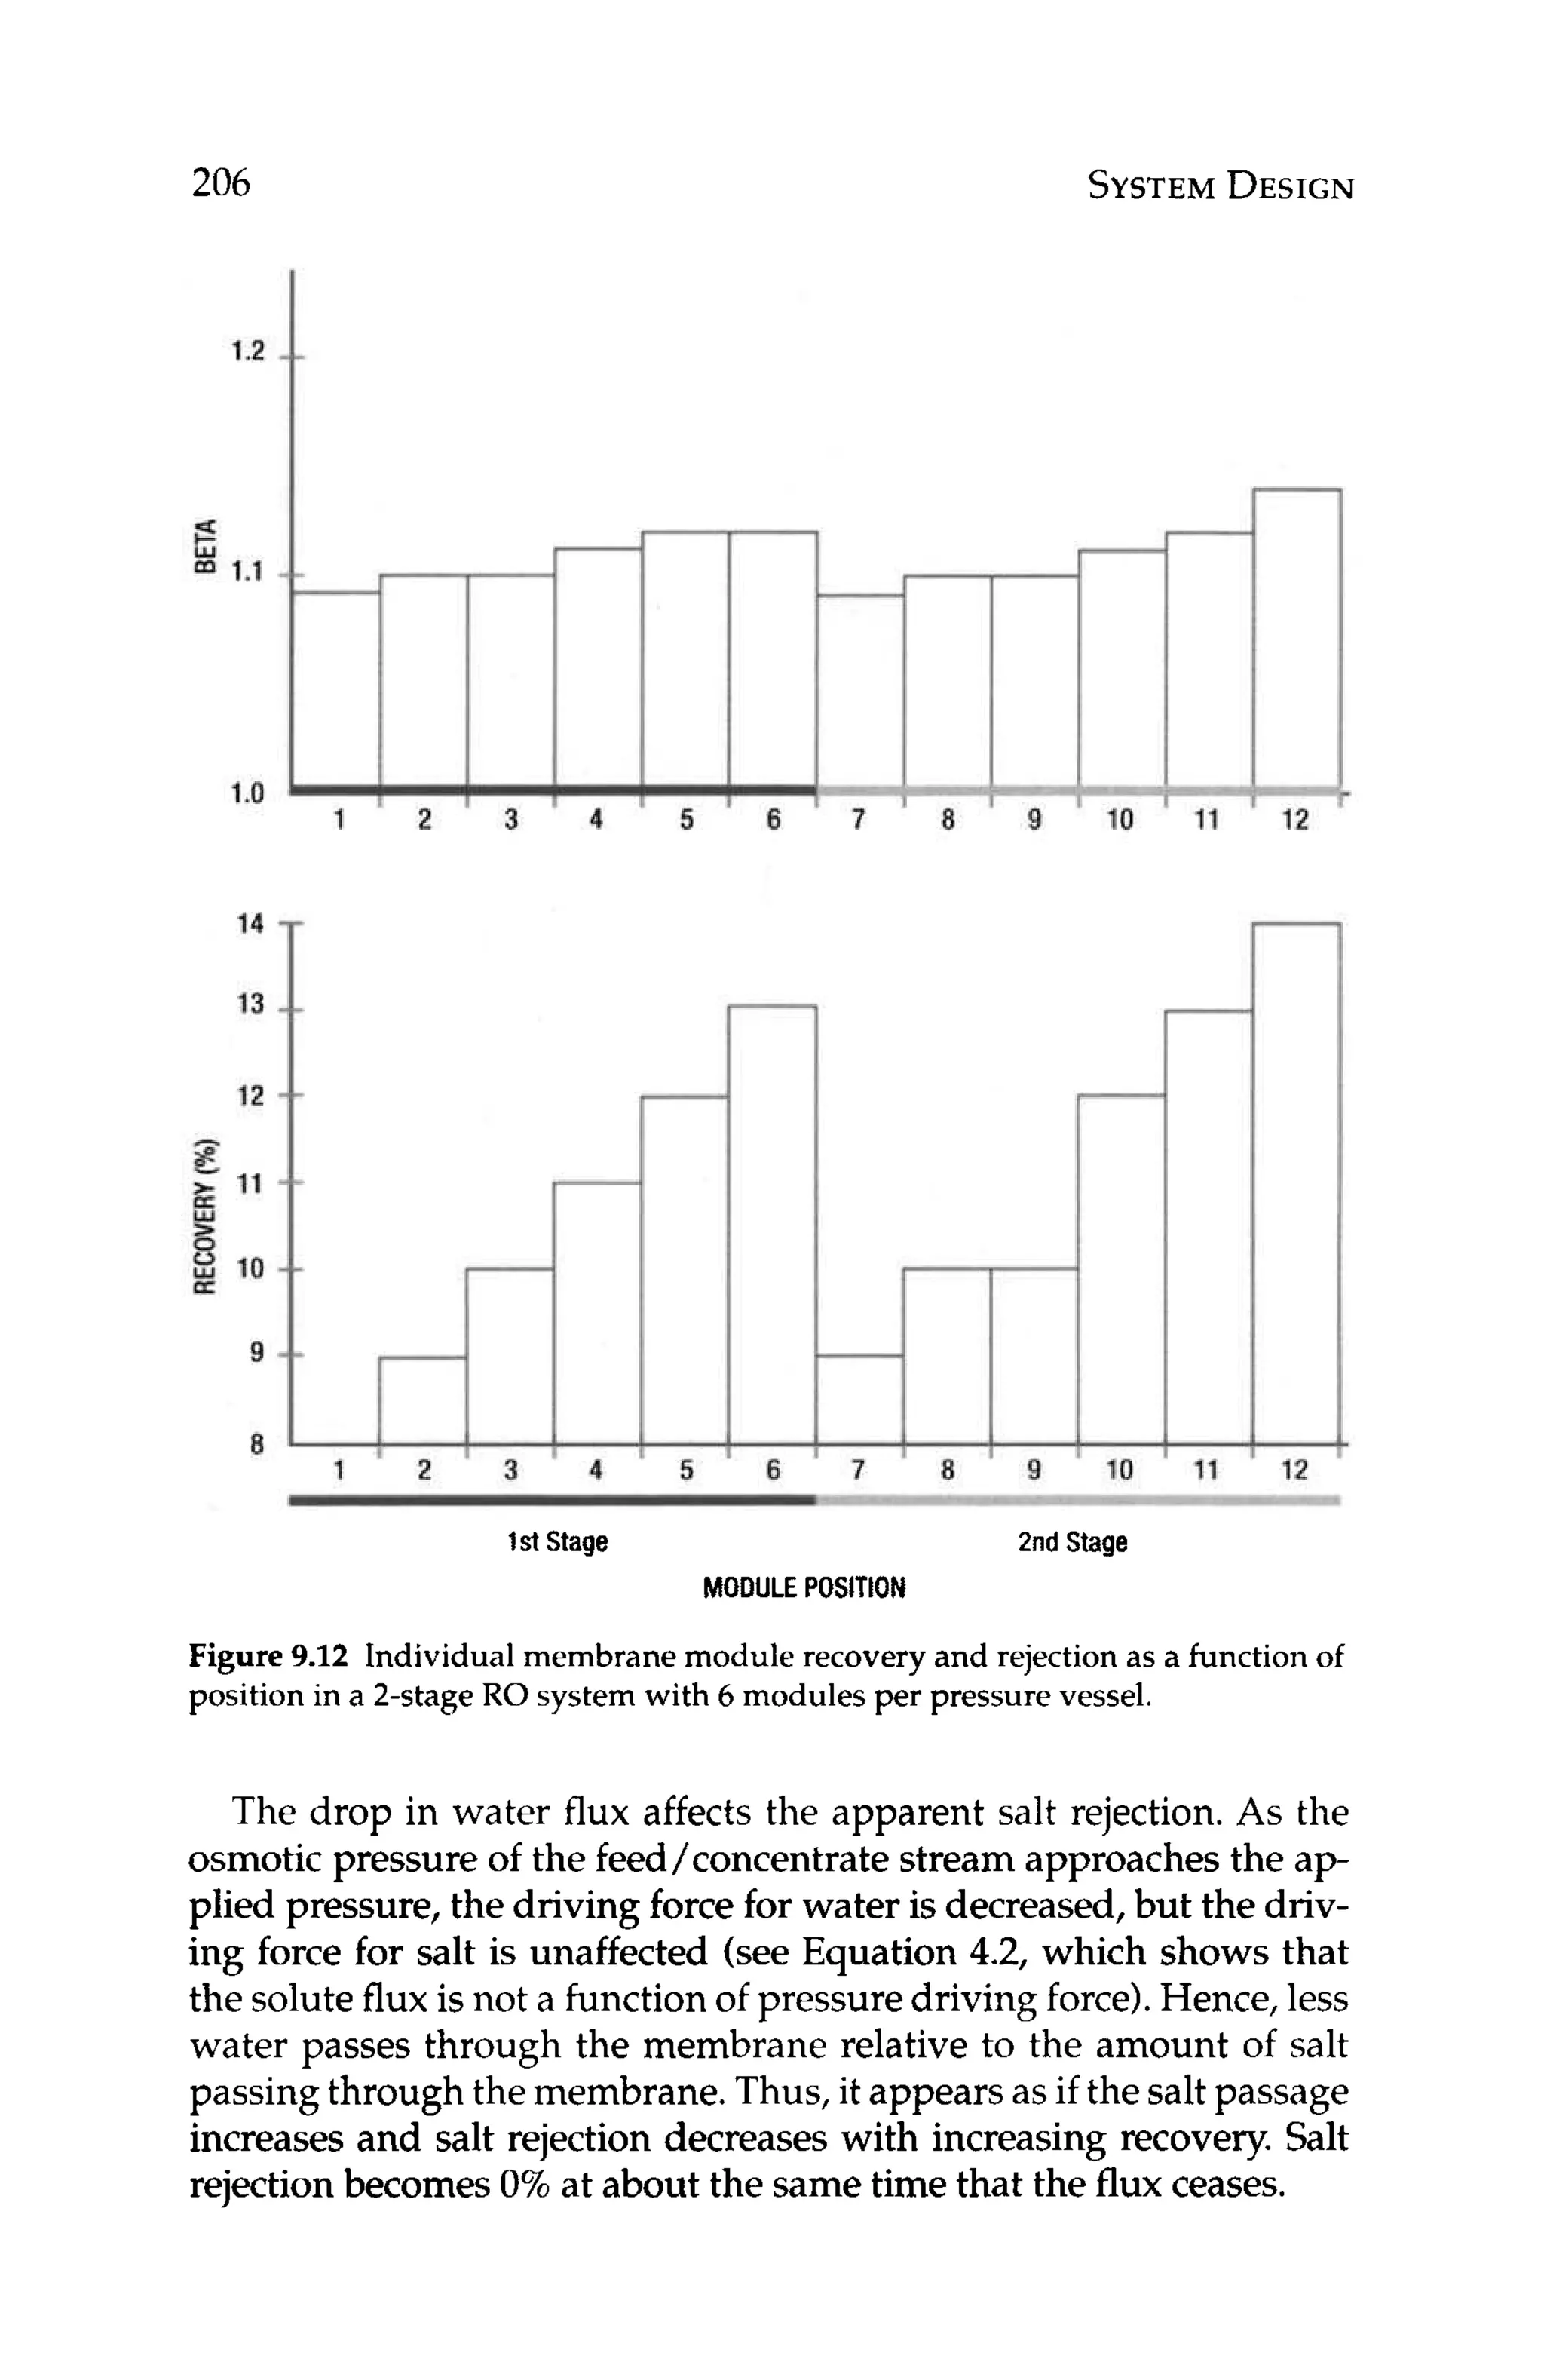
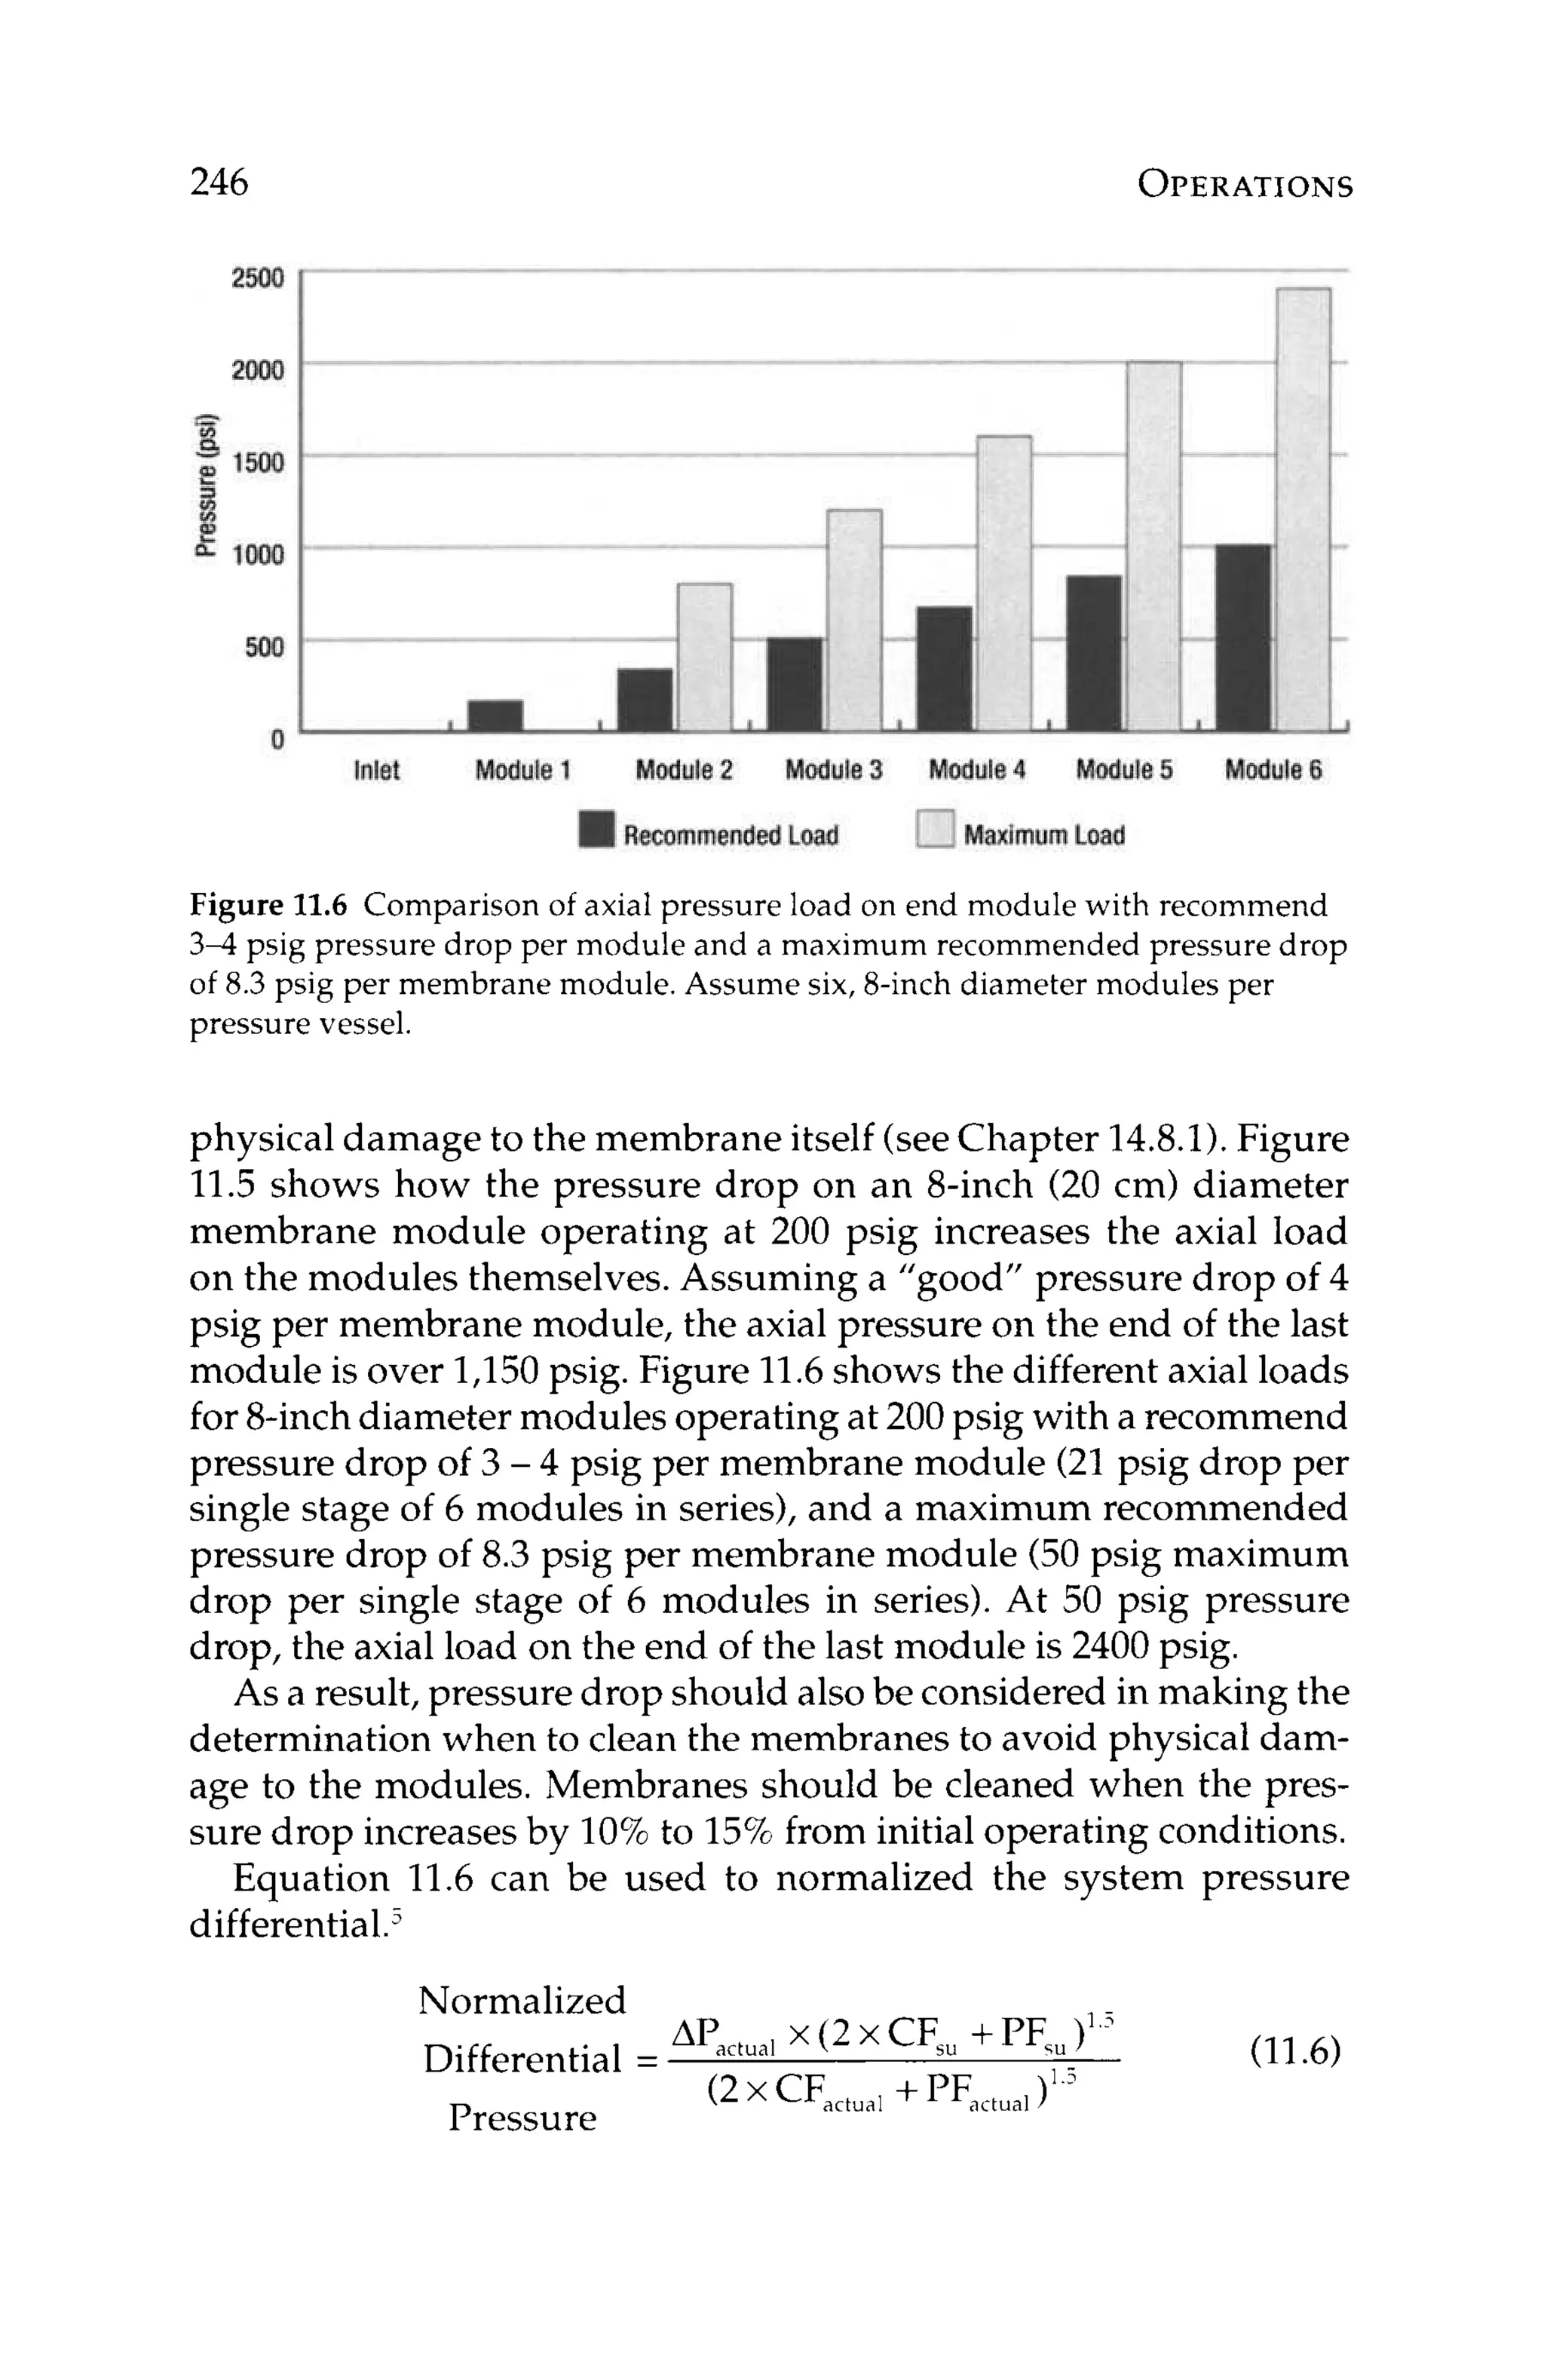
![244 OPERATIONS
and
“s”= subscript for ”standard” conditions
“a” = subscript for ”actual” conditions
Monitoring salt passage is important in tracking membrane seal-
ing and/or degradation. In both of these cases, salt passage will
increase with time. If membrane degradation is occurring, this in-
crease in salt passage is easy to understand. In the case of mem-
brane scaling, however, the increase in salt passage is not so intui-
tive. Consider the followingexample.
Figure 11.4depicts a cross-sectionof a membrane with a layer of
calcium carbonatescaleon the surface.Theconcentrationof calcium
at the membrane surface, Z , is higher than that in the bulk feed, X,
since the concentration at the surface has reached saturation. The
membrane passes saltsbased on what concentrationis actually next
to the membrane. In this case, the membrane is exposed to a satu-
rated concentration, not the lowerbulk solutionconcentration.Even
though the percent passageof calciumthrough the membranesstays
constant, the scaled membrane will yield higher permeate concen-
tration of calcium.This is because the concentrationof calcium that
the membrane is exposed to at the membrane surfaceis higher than
the bulk solution concentrationof calcium, [Z],[X].
Normalized salt passage is generallynot used as the primary indi-
catorof whentocleanmembranes.Thisisbecausenormalizedproduct
flowand/or differentialpressuredrop (seebelow)will usually indicate
problems with the membranesbefore product qualitybecomes an is-
sue.However, normalizedsalt passage shouldbe used in conjunction
BULK CONCENTRATION“X” 4
Figure 11.4 Cross-section of an RO membrane with a layer of scale on the
surface of the membrane. Concentration of scale formers is higher at the
membrane surface, Z than in the bulk solution, X.](https://image.slidesharecdn.com/reverseosmosispdf-230430025016-321d174f/75/Reverse_Osmosis_pdf-pdf-266-2048.jpg)


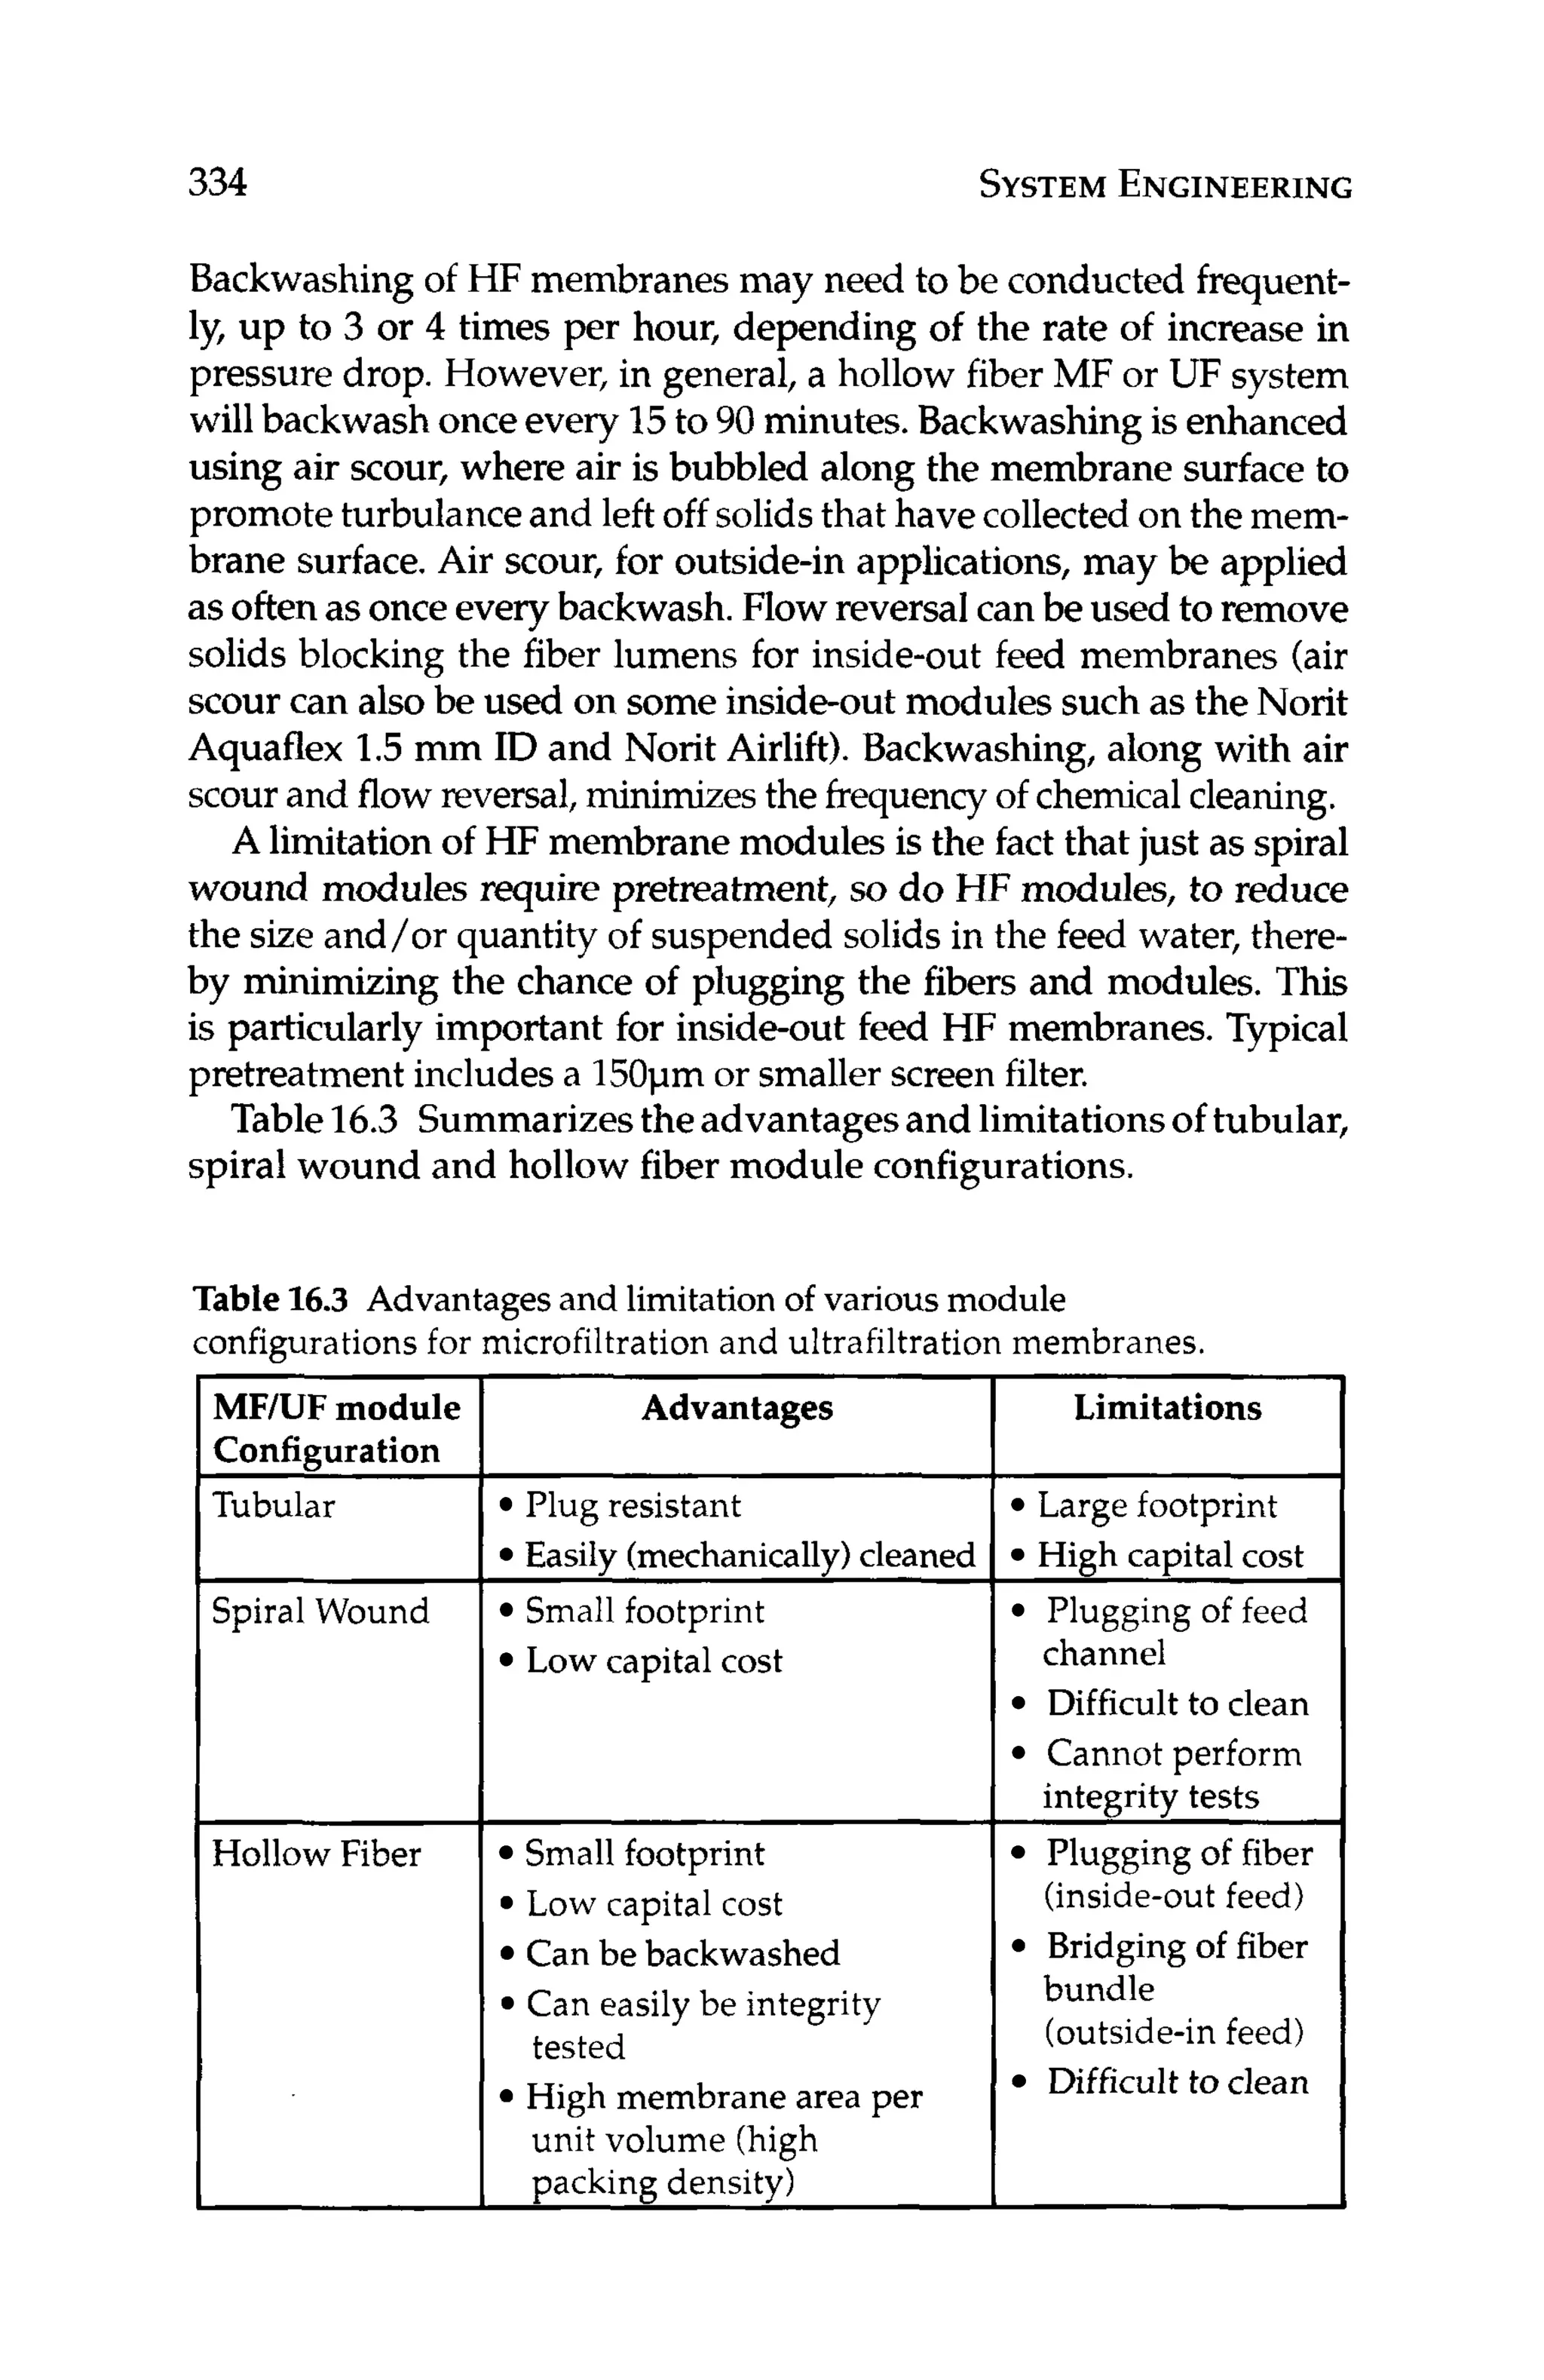
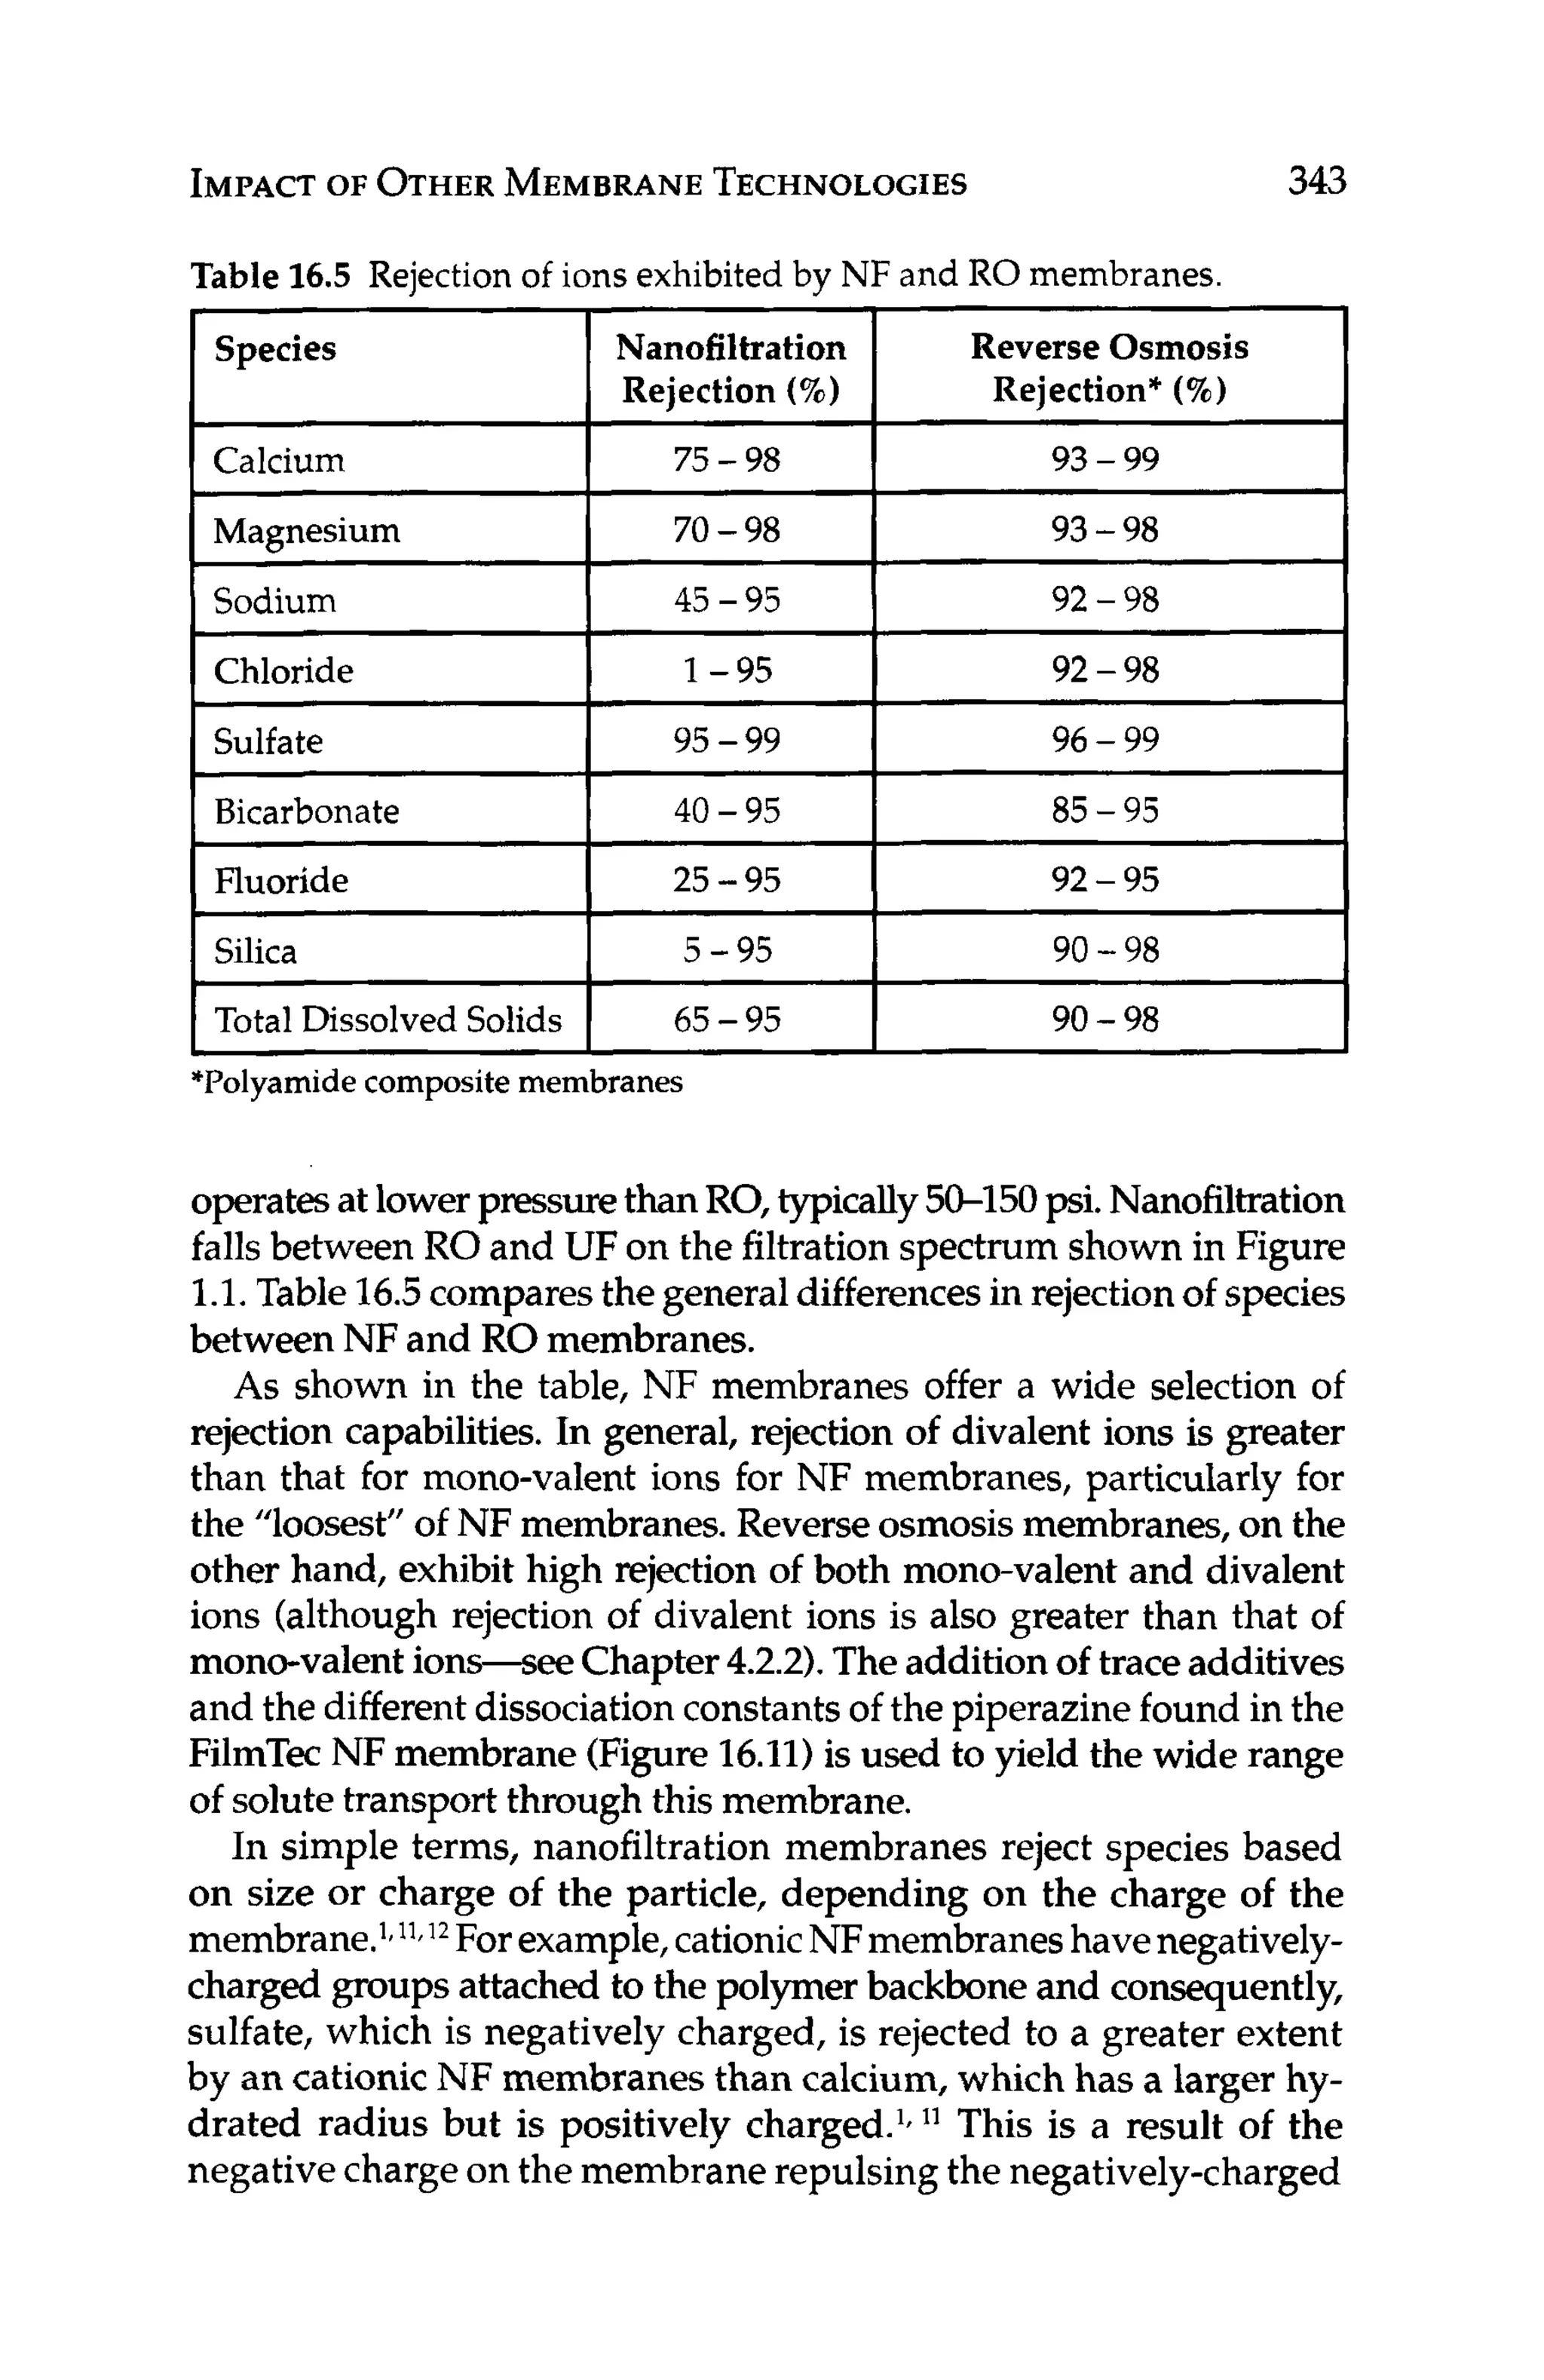
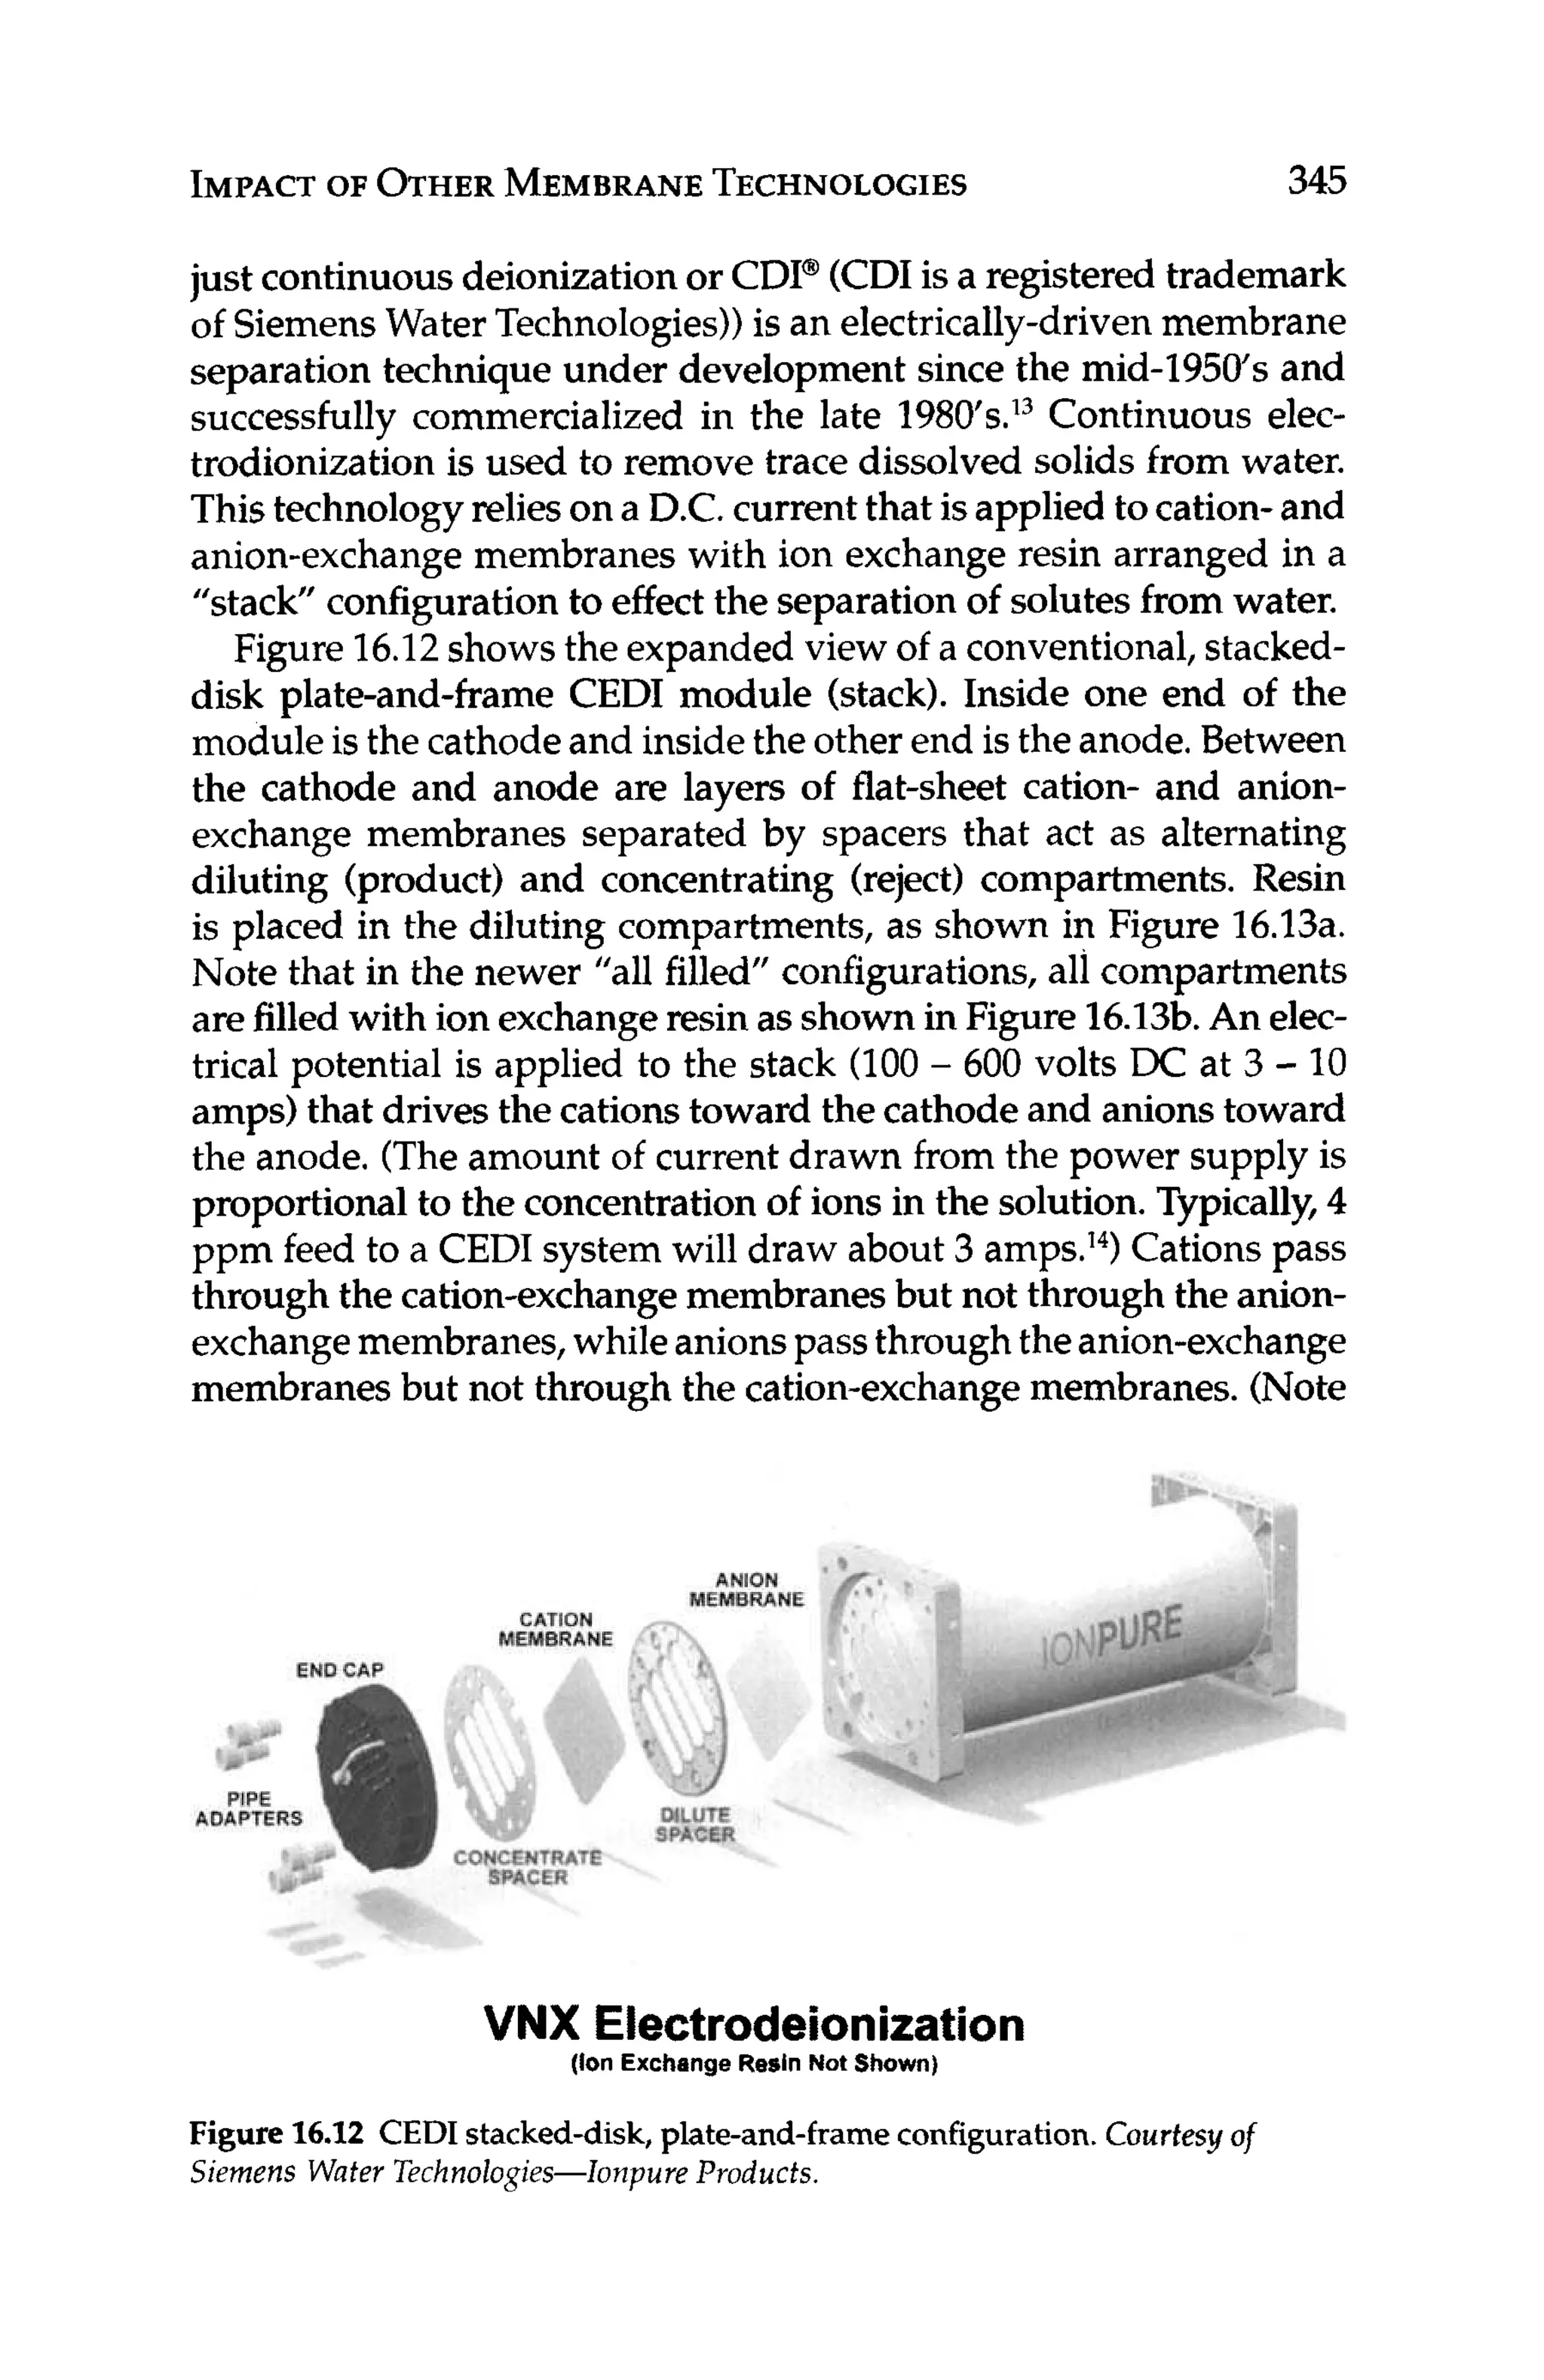
![16
Impact of Other Membrane
Technologies
In this chapter, the impact of other membrane technologies on the
operation of RO systems is discussed. Technologies considered in-
clude microfiltration (MF), ultrafiltration (UF), and nanofiltration
(NF) as pretreatment to RO, and continuous electrodeionization
(CEDI) as post-treatment to RO. This chapter also describes the
HEROTM
(high efficiency RO-Debasish Mukhopadhyay patent
holder, 1999) processused to generate high purity water fromwater
that is difficult to treat, such as water containing high concentra-
tions of silica.
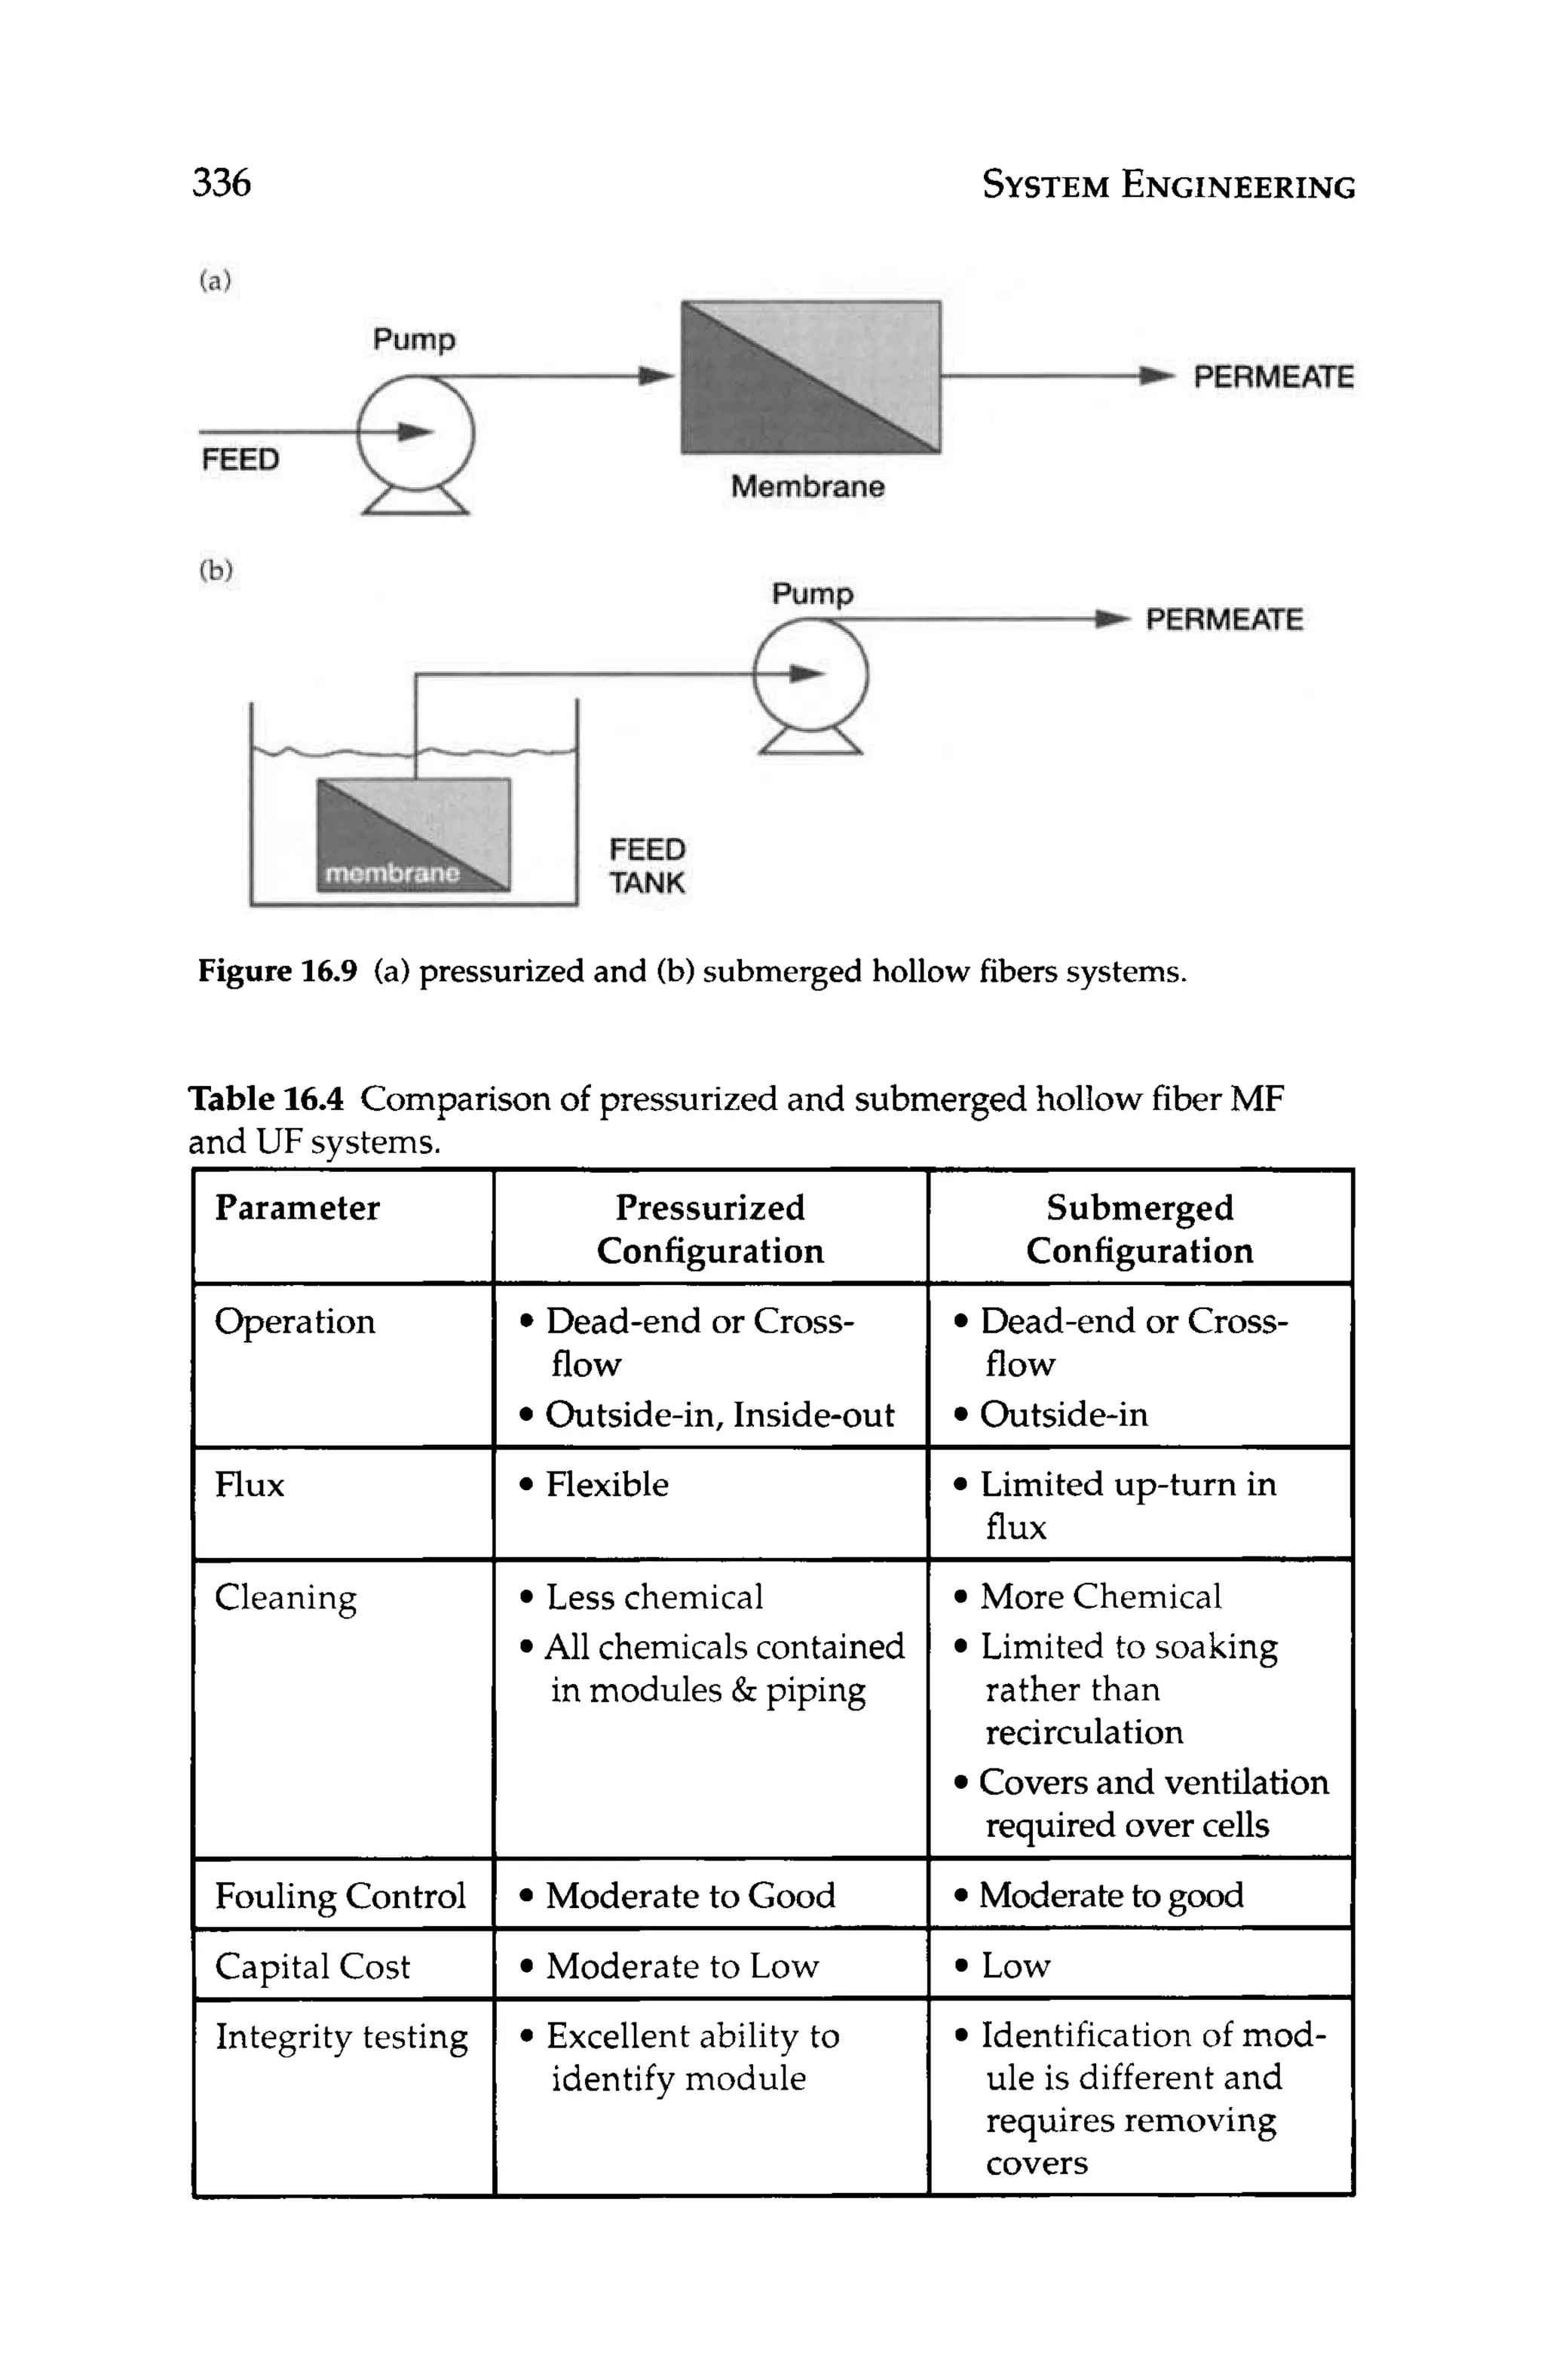
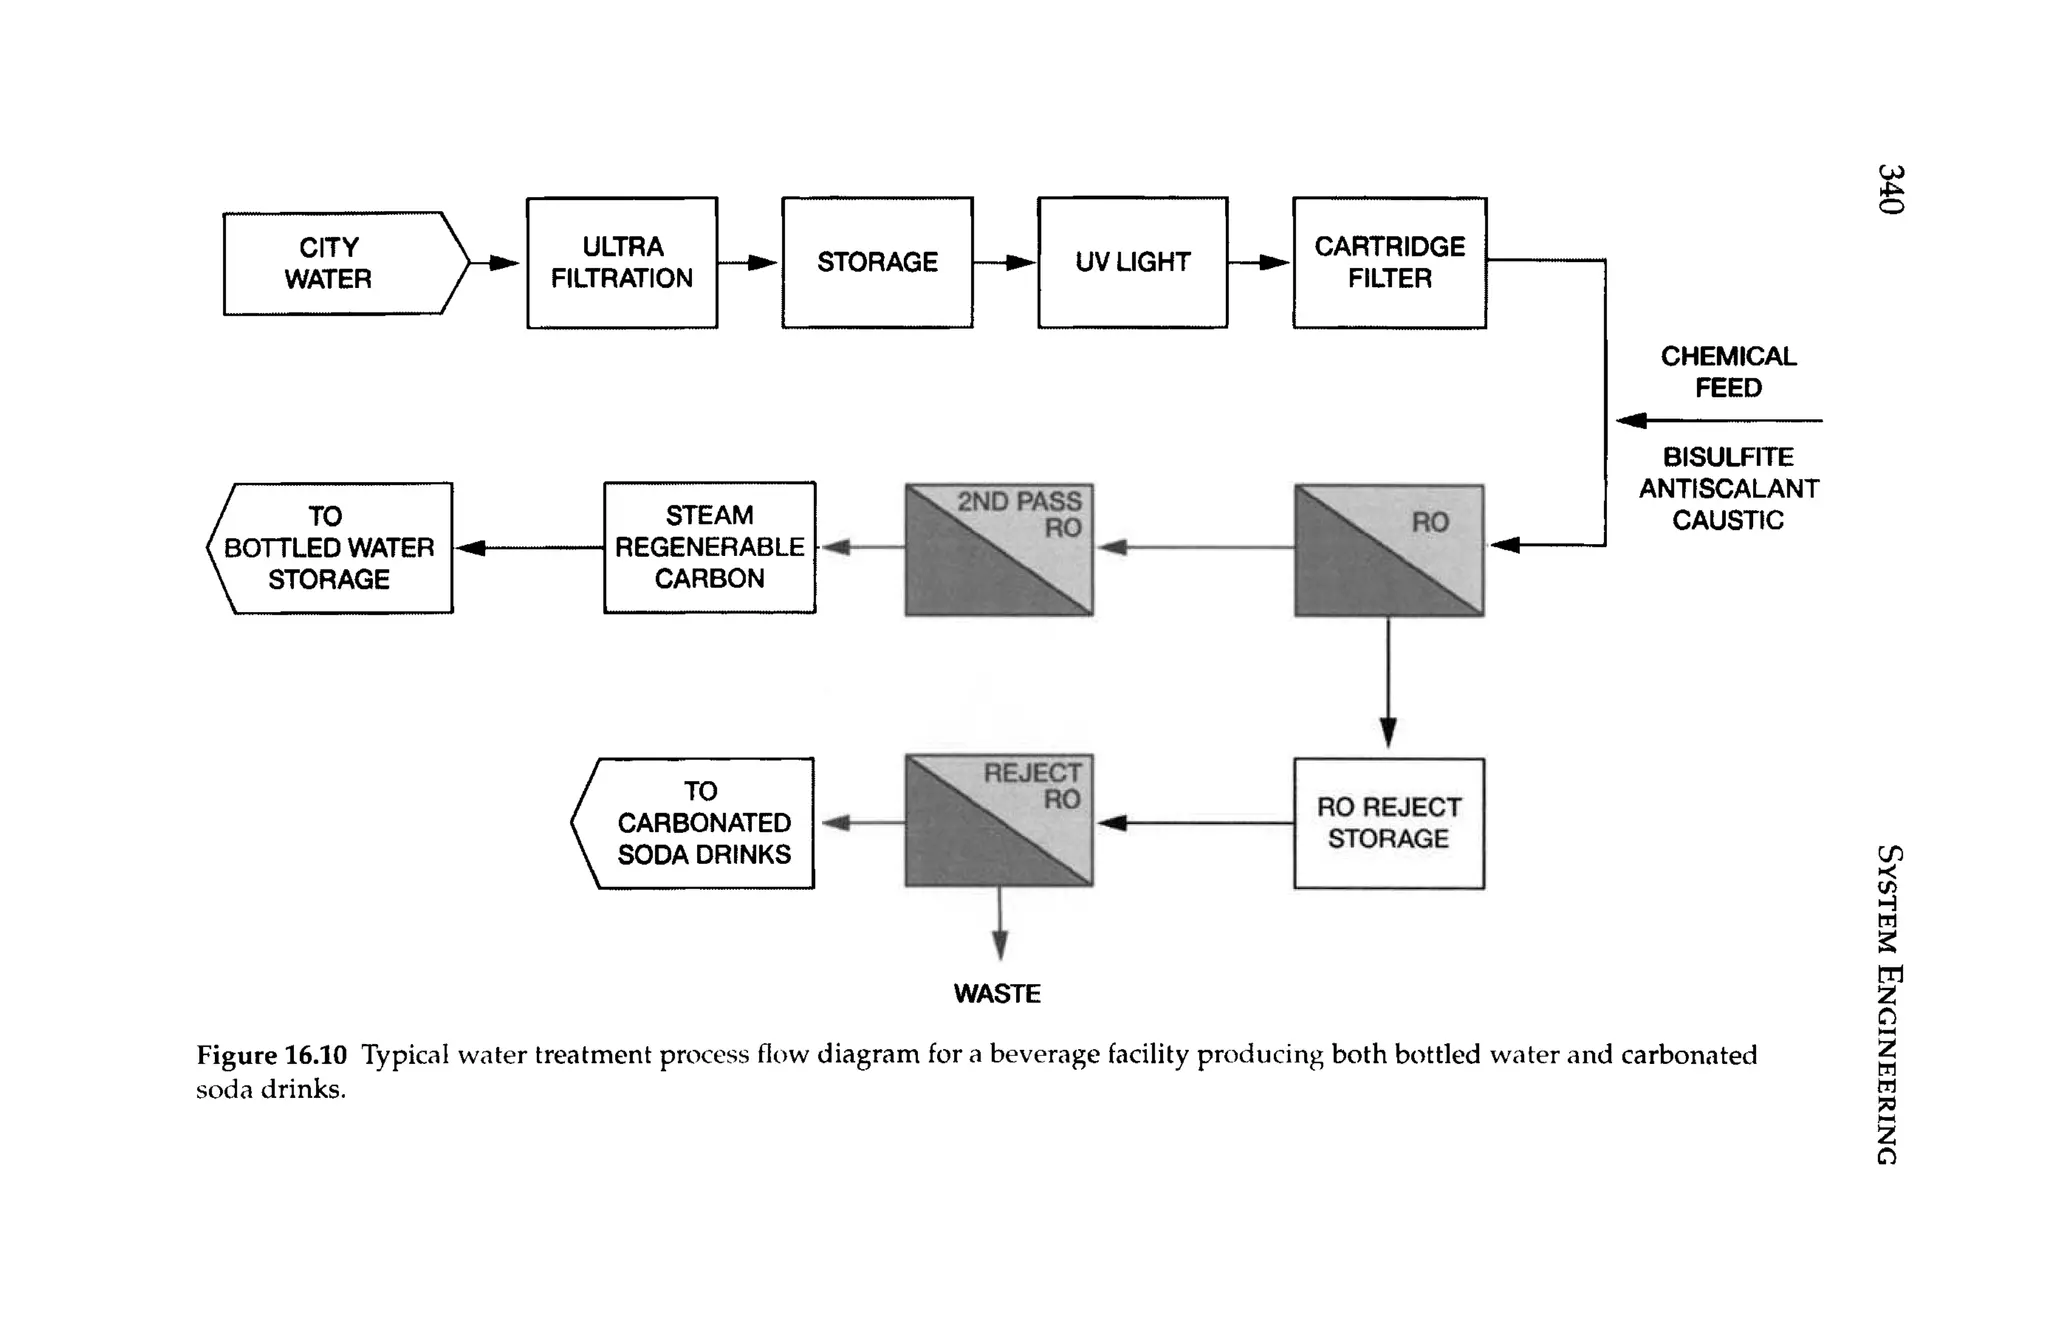
16.1 Microfiltration and Ultrafiltration
Microfiltration and UF are pressure-driven membrane separation
technologiesthat use positive pressureor suctionto separateparticles
(and high molecular-weight soluble species in the case of UF) from
solution (seeFigure 1.1).The history of MF and UF membranes goes
back to the early 1900's. Bechhlold developed the first synthetic UF
membranes made from nitrocellulose in 1907.' He is also credited
with coining the term "ultrafilter." By the 1920'sand 1930'sboth MF
and UF nitrocellulose membranes were commercially available for
laboratory use. The first industrial applications of MF and UF came
in the 1960's and 1970's. Microfiltration membranes became viable
for industrial application in the 1970's when Gelman introduced the
pleatedMFcartridge.' Ultrafiltrationmembranesbecomeindustrially
viable in the 1960's when Amicon began preparing UF membranes
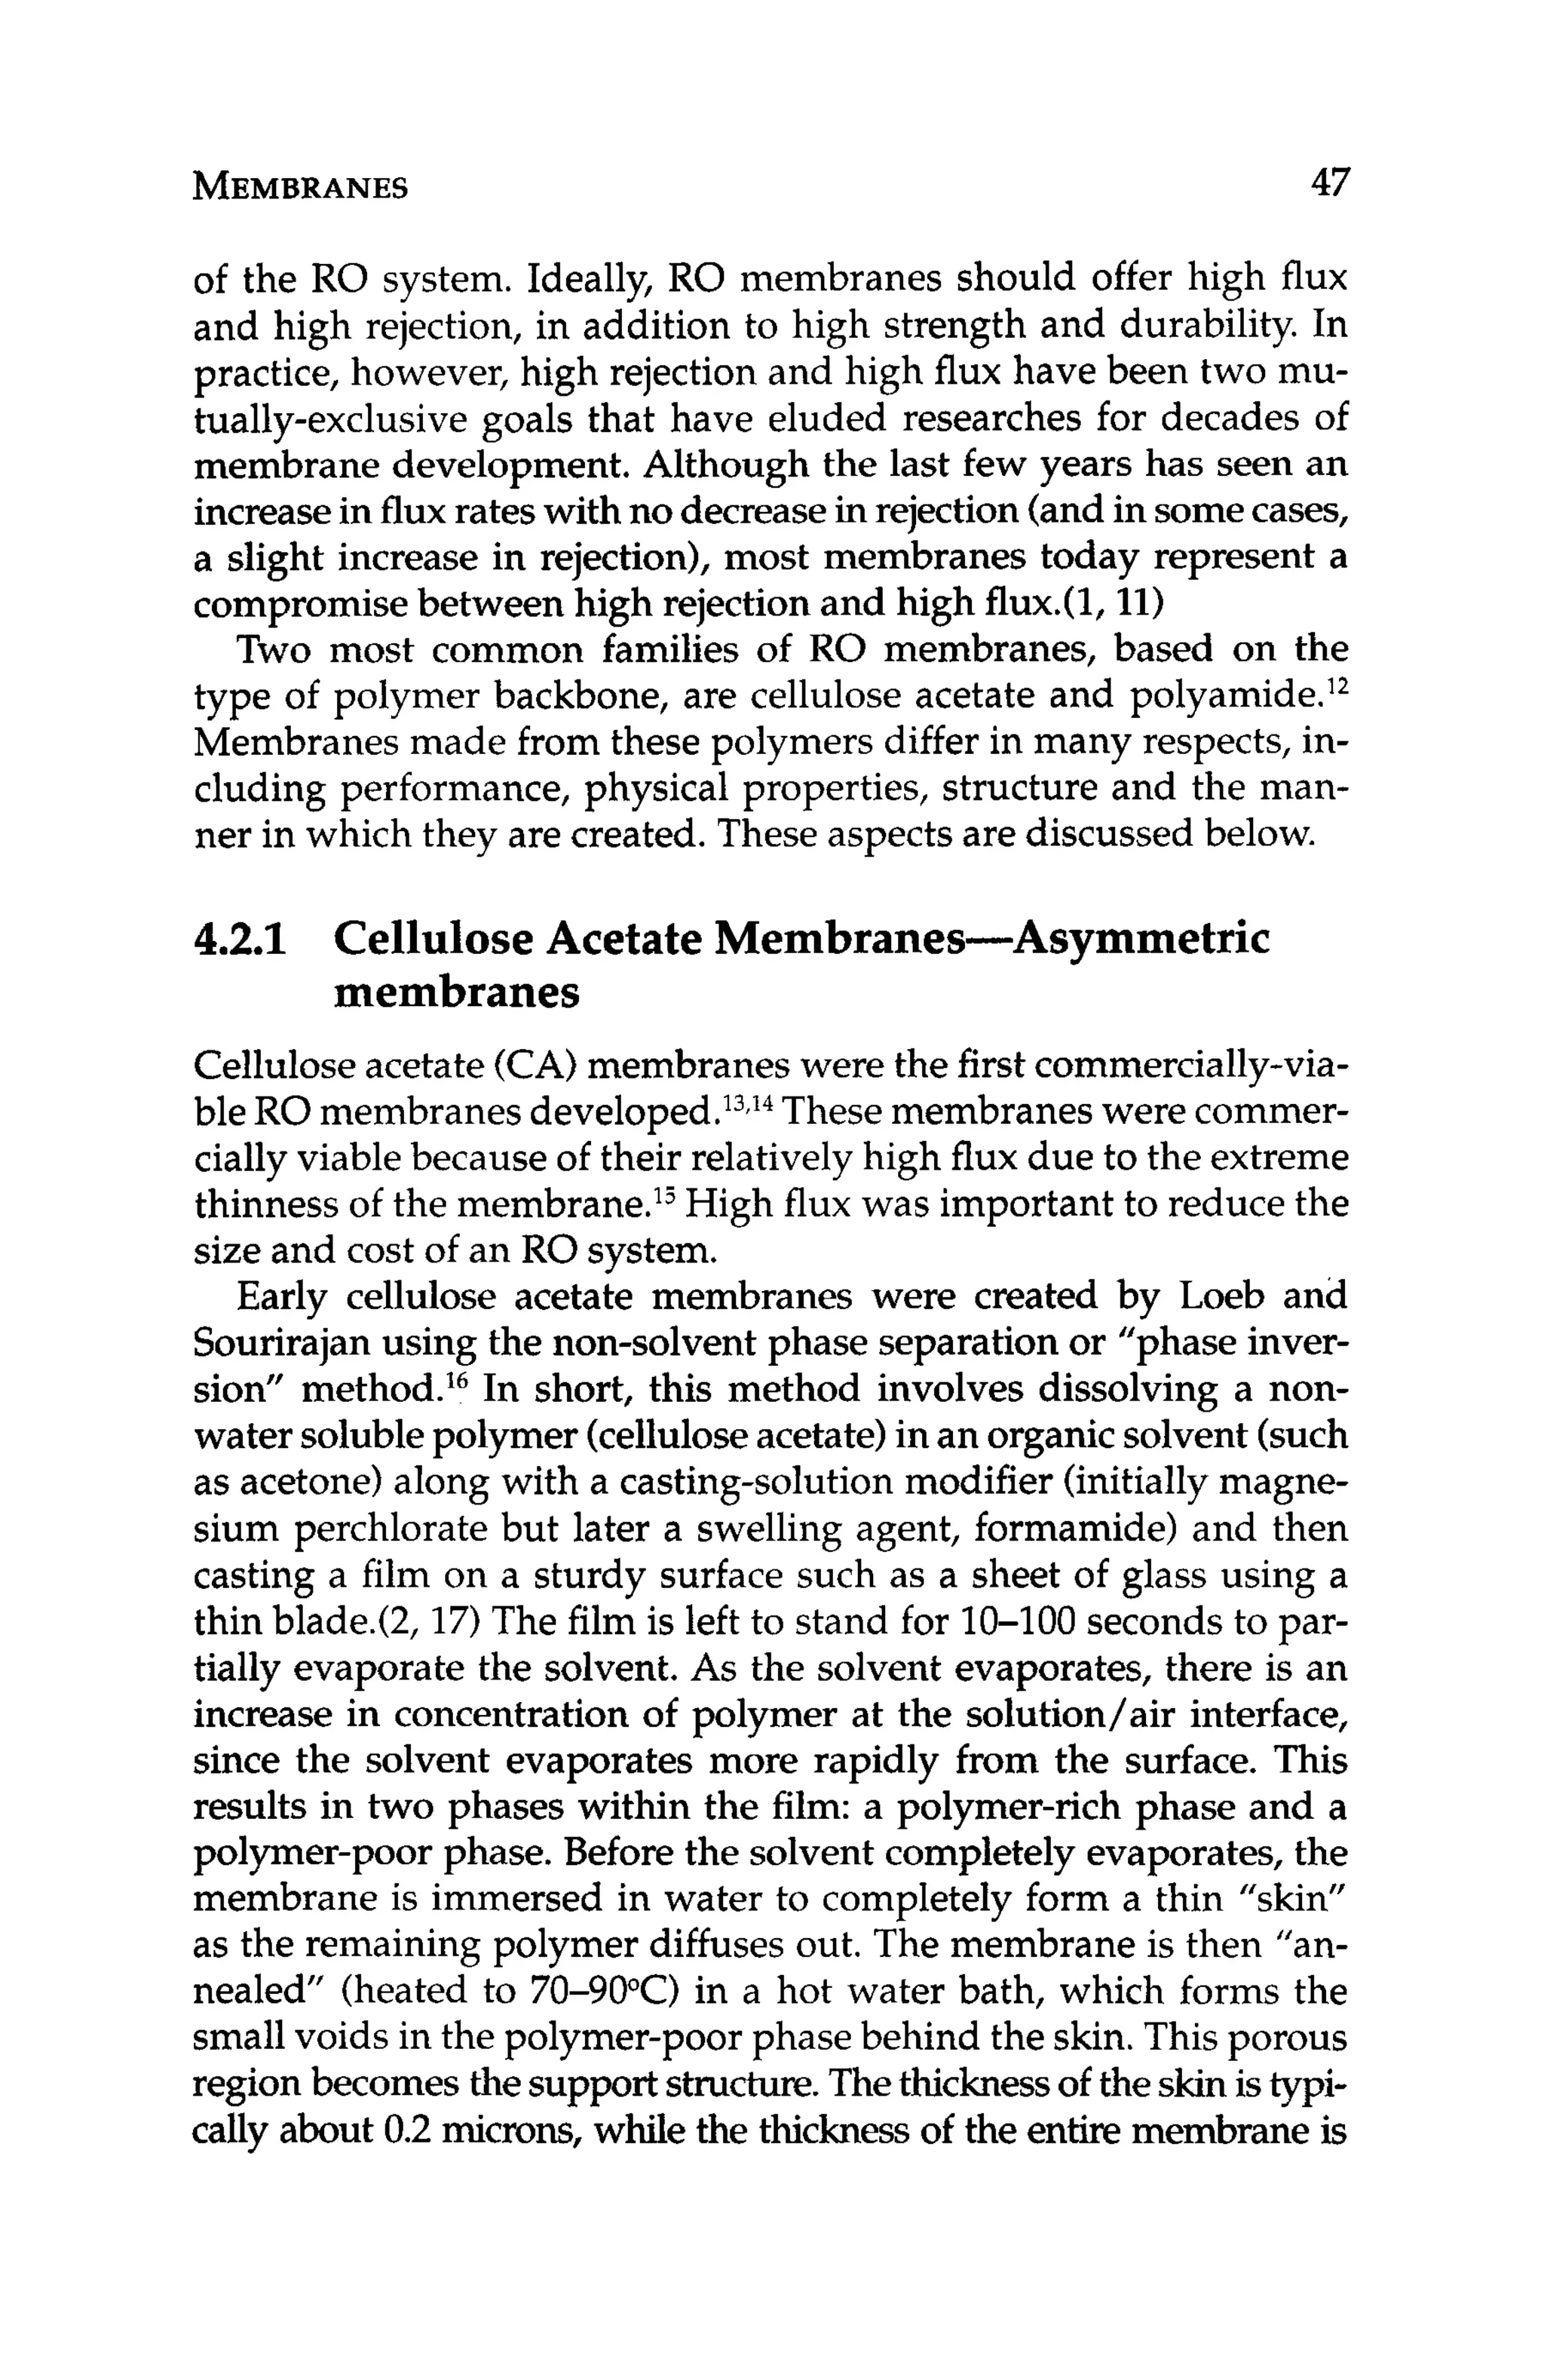
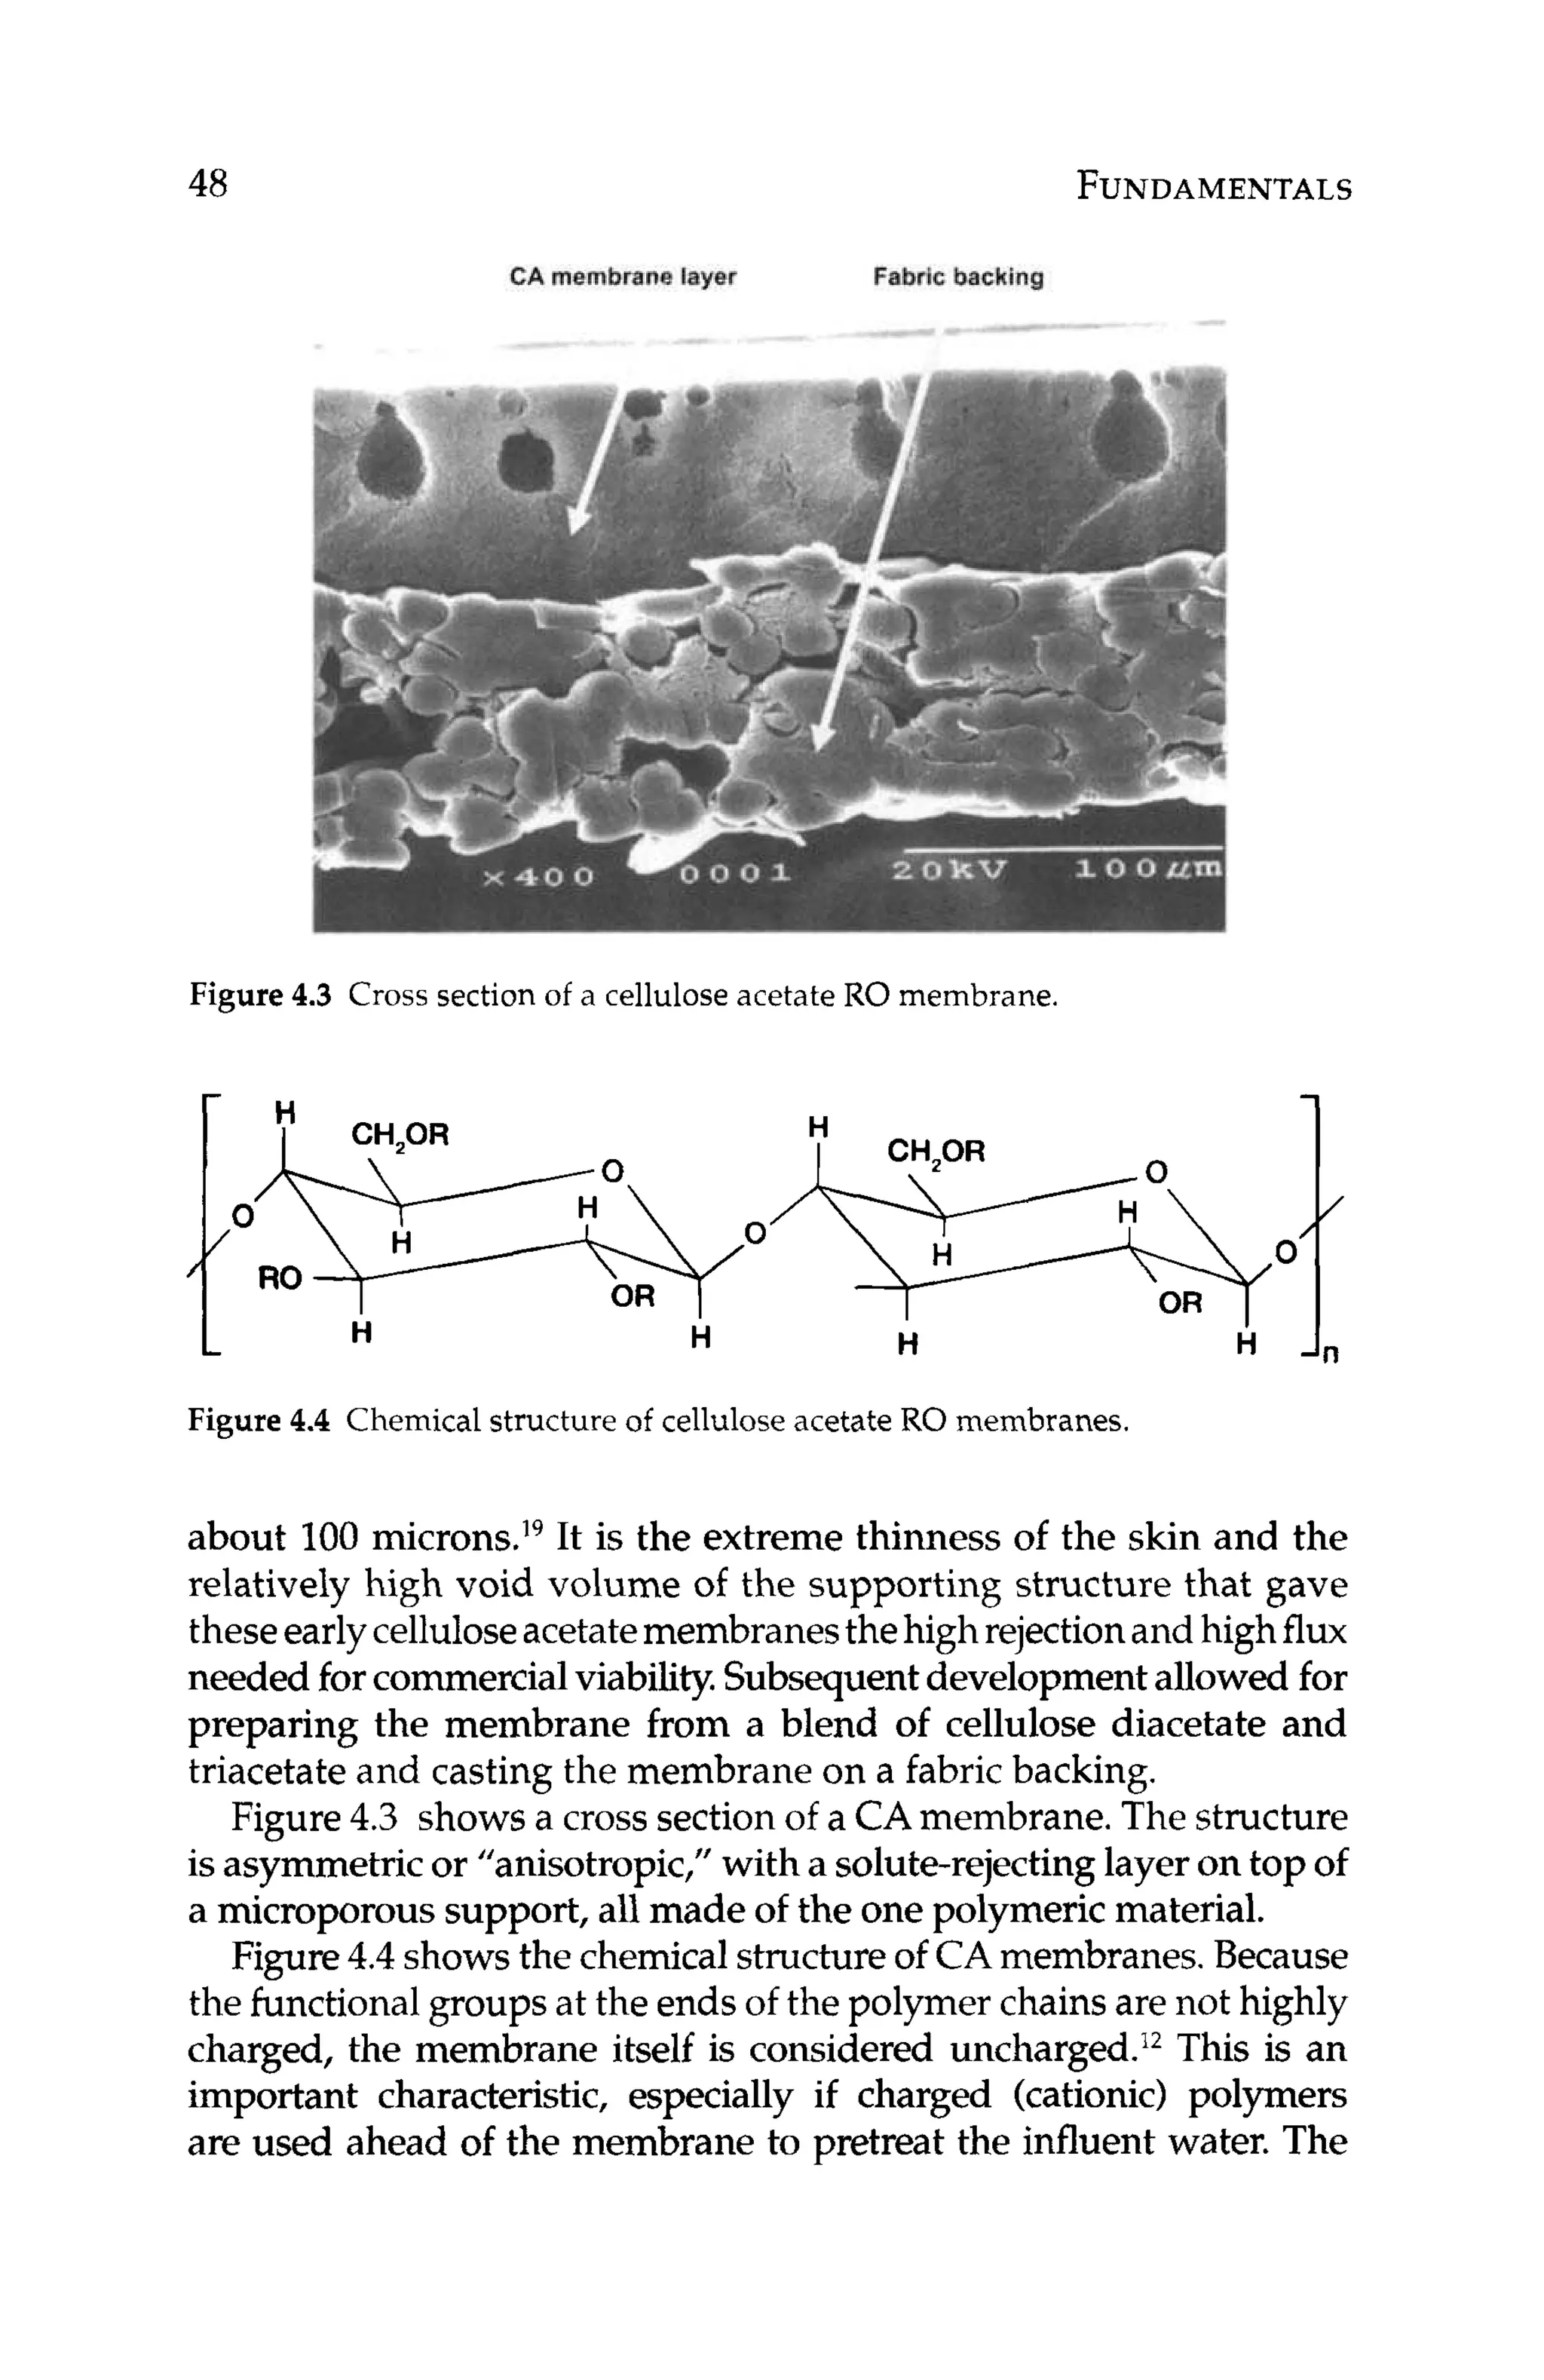
using a modified Loeb-Sourirajan method (seeChapter4.2.1).]
Microporous membranes are used to effectthe separationby MF
and UF processes. These microporous membranes differ from poly-
amide composite RO membranes in that they are not compositesof
two differentpolymeric materials; they are usually constructedusing
a singlemembrane polymeric material.In simpleterms, both UFand
MFtechnologiesrelyon sizeastheprimaryfactordeterminingwhich
325](https://image.slidesharecdn.com/reverseosmosispdf-230430025016-321d174f/75/Reverse_Osmosis_pdf-pdf-347-2048.jpg)