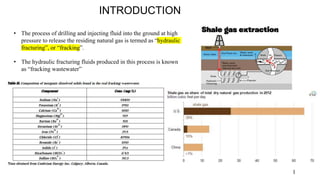
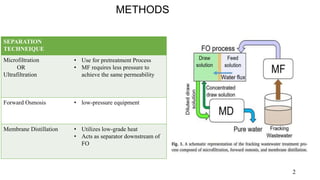
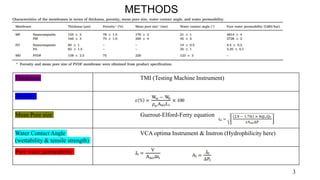
Department of Chemical Engineering
Indian Institute of Science Education and Research, Bhopal
Advanced Separation Process
Paper presentation
On
Feasibility of a hybrid membrane-based process (MF-FO-MD) for fracking wastewater treatment
Presented by
Artina Deka
BS-MS (19056)
CONTENTS
• INTRODUCTION
• METHODS
 Microfiltration
 Forward Osmosis
 Membrane Distillation
• METHODOLOGY
• RESULTS & DISCUSSIONS
• CONCLUSION
• The process of drilling and injecting fluid into the ground at high
pressure to release the residing natural gas is termed as “hydraulic
fracturing”, or “fracking”.
• The hydraulic fracturing fluids produced in this process is known
as “fracking wastewater”
1
INTRODUCTION
INTRODUCTION
SEPARATION
TECHNEIQUE
Microfiltration
OR
Ultrafiltration
• Use for pretreatment Process
• MF requires less pressure to
achieve the same permeability
Forward Osmosis • low-pressure equipment
Membrane Distillation • Utilizes low-grade heat
• Acts as separator downstream of
FO
2
METHODS
Thickness TMI (Testing Machine Instrument)
Porosity
Mean Pore size Guerout-Elford-Ferry equation
Water Contact Angle
(wettability & tensile strength)
VCA optima Instrument & Instron (Hydrophilicity here)
Pure water permeability
3
METHODS
Preparation of Membrane :
 Nanocomposite microfiltration membrane was prepared
from electrospun nylon 6/SiO2 composite nanofiber mat
coated by polyvinyl acetate​
 Polysulfone microfiltration membrane was not prepared
in-house
Conditions:
Time :12 h
Speed : 500 rpm
Applied pressure : 0.28 bar
Microfiltration
Membrane
Nanocomposite Polysulfone
4
METHODOLOGY(MF)
Turbidity MicroTPW Turbidimeter/Gravimetric method
Total
Organic
Content
TOC analyzer
Conducti
vity
Calibrated conductivity meter
pH calibrated pH meter
Osmotic
Pressure
calibrated pH meter,
 The high turbidity and TOC were found due to the
presence of oil and dissolved organic compounds in
the fracking wastewater
5
RESULTS &
DISCUSSION
1. The water flux increased linearly with an increase in applied pressure
2. no structural deformation of the membranes occurred
3. In the fouling stage, a 29% and 1.59 times higher (46%) decline in apparent
water permeability was obtained for the nanocomposite membrane and the
PSf membrane respectively in pre-treatment of the fracking wastewater.
4. Lower decline in water permeability in the fouling stage was seen due to
higher hydrophilicity for the nanocomposite membrane as compared to the
PSf membrane
6
RESULTS & DISCUSSION
Pure water permeability
apparent water permeability as a function of time
where
dV =permeate volume in the
time of dt
q =constant
1. The specific cake resistances for the
nanocomposite and the PSf membranes
were 0.57 × 10⁻⁴ and 7.25 ×
10−4 respectively.
2. Due to higher hydrophilic properties, the
nanocomposite membrane demonstrated
lower values of specific cake resistances as
compared to the PSf membrane
7
RESULTS &
DISCUSSION
Nanocomposite Membrane
Psf Membrane
Specific cake resistance for
the fouling stage
Flux recovery
Jy and Jx are the membrane pure water flux
before and after filtration of fracking
wastewater, respectively
Cleaning of Membrane :
 Rinsing with DI water
 Time = 30 mins
 applied pressure = 0.28 bar
8
RESULTS & DISCUSSION
flux recovery
Draw
Solution
NaP (4.6 M)
NaCl(4.0 M)
Membrane
Nano-
-composite
PA
Conditions:​
Time :6 h
Flow rate : 0.5 L/min ​
Temperature : 24 °C
 Concentration of the draw solution was adjusted by adding
concentrated draw solution in every 15 min
 Effective surface area of membrane =19.94 cm2
9
METHODOLOGY(FO)
I. The lower TDS value in feed solution before FO and higher in draw solution after FO tells that very small
quantities of solute might pass through the membrane from feed to draw side during desalination by FO in case of
NaP draw solution.
II. The higher TOC and TDS values in feed after desalination were likely due to reverse salt flux of the organic draw
solutions during FO process.
III. TOC values were almost identical before and after desalination for the NaCl draw solution, indicating a greater
than 99% rejection of dissolved organic compounds in fracking wastewaters during FO.
10
RESULTS & DISCUSSIONS
1) This declination occurs due to the effects of
concentration polarization, membrane fouling, and draw
solution reverse salt flux during desalination of fracking
wastewater.
2) Higher diffusivity and lower reverse salt flux gives high
initial water fluxes and lower declines of water for the
NaP draw solution as compared to NaCl solution.
3) Nanocomposite is more hydrophilic in nature.
4) The FO membranes may have fouled instantly with the
raw fracking wastewater, as compared to pre-treated fracking
wastewater.
raw fracking wastewater
Pre-treated fracking wastewater Pre-treated fracking wastewater
11
RESULTS & DISCUSSIONS
Pre-treated fracking wastewater Pre-treated fracking wastewater
raw fracking wastewater raw fracking wastewater
There was a reduction in flux due to
concentration of feed solution that influenced
the quantity of permeate volume in the FO
process.
12
RESULTS & DISCUSSIONS
Cleaning of Membrane :
• DI water was considered for both feed and draw solution
• Time = 2hr
• Flow rate = 1L/min
• Again experiments were conducted for 6 h at the flow rate of 0.5
L/min
• 97.6% and 95% of initial water flux can be recovered by the
nanocomposite and PA membranes
Flux decline
before Cleaning
Flux decline
after Cleaning
Nano--
composite
14% 17%
PA 24% 28%
13
RESULTS &
DISCUSSIONS
(A) Decline of water flux
for the pristine membrane
(B) Decline of water flux after cleaning of
the membrane
FO water flux recovery
after cleaning of the membrane
o Draw solution: 4.0 M NaCl​
o Feed: Pre-treated fracking wastewater
o Draw solution: 4.6 M NaP
o Feed: Pre-treated fracking wastewater.
o 98.5% and 97% of initial water flux can be recovered by the nanocomposite and PA membranes.
14
RESULTS & DISCUSSIONS
(A) Decline of water flux for
the pristine membrane
(B) Decline of water flux after
cleaning the membrane
FO water flux recovery after
cleaning of the membrane
FE-SEM images while NaCl was used as draw solution
FE-SEM images when NaP was used as draw solution
15
RESULTS & DISCUSSIONS
SEM-EDX spectra 16
RESULTS & DISCUSSIONS
A) Pt was also obtained in the
EDX spectra because of the Pt coating applied
to conduct the SEM analysis on the
membranes.
B) A new peak for Si was obtained for the
PA membrane due to fouled sand
particles upcoming from wastewater, CaCO3,
and MgCO3 precipitation.
C) The peaks for Na, K, Fe and Cl were
likely obtained due to crystallization of
NaCl, KCl, and FeCl2/FeCl3 while the membranes
were dried after fouling.
D) The Si-peak for nanocomposite
membrane was obtained due to its constituent
of SiO2 nanoparticles in its composition.
WHY? : To recycle the FO draw solutions
 PVDF membrane is used here.
 Effective surface area of membrane =34 cm2
 Feed Solution = Draw solution of FO
Conditions:​​
Time :3 h
Temperature(Feed) : 50 °C​
Temperature(Draw) : 20 °C
Permeate
Flux
Solute
Rejection
Concentratio
n of Feed
Gravimetric Method
Weight of
Permeate
digital weight balance
Conductivity a calibrated conductivity meter (at 30 min intervals)
17
METHODOLOGY(MD)
 Here pre-treated fracking wastewater was used as feed with nanocomposite membrane.
 The higher permeate flux for NaP was obtained due to its lower interaction with water molecules as compared to NaCl.
18
RESULTS & DISCUSSIONS
Permeate flux Permeate quality Feed concentration as a function of
time
Feed Conditions Product Requirements Economics Environment
Considerations
1) Highly saline. 1) High solute rejection in
each step of separation.
1) Less Energy Intensive
Process.
1) Production of more
concentrated feed
solution in FO.
2) High Flux recovery.
3) Reversible Fouling
19
 The novel combined MF-FO-MD process has major potential to be used for the treatment of high salinity
waste streams such as fracking wastewater.​
CONCLUSIONS
THANK YOU !
FOR YOUR ATTENTION
~You never know the worth of water till the well is dry~
The balance between cohesive and adhesive forces defines
the degree of wettability.
Solids can be divided into high and low-energy solids. High energy solids such as glass, ceramics, and metals
are held together by chemical bonds (covalent, ionic and metal) which are very strong. This causes high excess
energy on the surface of the solid i.e. the name high energy solid. Most of the liquids will wet the high energy
solid completely as that will lead to a decrease in interfacial energy. Low-energy solids, such as many of the
polymers, especially Teflon are harder to wet.

ADVANCED SEPARATION PROCESS.pptx

  • 1.
    Department of ChemicalEngineering Indian Institute of Science Education and Research, Bhopal Advanced Separation Process Paper presentation On Feasibility of a hybrid membrane-based process (MF-FO-MD) for fracking wastewater treatment Presented by Artina Deka BS-MS (19056)
  • 2.
    CONTENTS • INTRODUCTION • METHODS Microfiltration  Forward Osmosis  Membrane Distillation • METHODOLOGY • RESULTS & DISCUSSIONS • CONCLUSION
  • 3.
    • The processof drilling and injecting fluid into the ground at high pressure to release the residing natural gas is termed as “hydraulic fracturing”, or “fracking”. • The hydraulic fracturing fluids produced in this process is known as “fracking wastewater” 1 INTRODUCTION INTRODUCTION
  • 4.
    SEPARATION TECHNEIQUE Microfiltration OR Ultrafiltration • Use forpretreatment Process • MF requires less pressure to achieve the same permeability Forward Osmosis • low-pressure equipment Membrane Distillation • Utilizes low-grade heat • Acts as separator downstream of FO 2 METHODS
  • 5.
    Thickness TMI (TestingMachine Instrument) Porosity Mean Pore size Guerout-Elford-Ferry equation Water Contact Angle (wettability & tensile strength) VCA optima Instrument & Instron (Hydrophilicity here) Pure water permeability 3 METHODS
  • 6.
    Preparation of Membrane:  Nanocomposite microfiltration membrane was prepared from electrospun nylon 6/SiO2 composite nanofiber mat coated by polyvinyl acetate​  Polysulfone microfiltration membrane was not prepared in-house Conditions: Time :12 h Speed : 500 rpm Applied pressure : 0.28 bar Microfiltration Membrane Nanocomposite Polysulfone 4 METHODOLOGY(MF)
  • 7.
    Turbidity MicroTPW Turbidimeter/Gravimetricmethod Total Organic Content TOC analyzer Conducti vity Calibrated conductivity meter pH calibrated pH meter Osmotic Pressure calibrated pH meter,  The high turbidity and TOC were found due to the presence of oil and dissolved organic compounds in the fracking wastewater 5 RESULTS & DISCUSSION
  • 8.
    1. The waterflux increased linearly with an increase in applied pressure 2. no structural deformation of the membranes occurred 3. In the fouling stage, a 29% and 1.59 times higher (46%) decline in apparent water permeability was obtained for the nanocomposite membrane and the PSf membrane respectively in pre-treatment of the fracking wastewater. 4. Lower decline in water permeability in the fouling stage was seen due to higher hydrophilicity for the nanocomposite membrane as compared to the PSf membrane 6 RESULTS & DISCUSSION Pure water permeability apparent water permeability as a function of time
  • 9.
    where dV =permeate volumein the time of dt q =constant 1. The specific cake resistances for the nanocomposite and the PSf membranes were 0.57 × 10⁻⁴ and 7.25 × 10⁻⁴ respectively. 2. Due to higher hydrophilic properties, the nanocomposite membrane demonstrated lower values of specific cake resistances as compared to the PSf membrane 7 RESULTS & DISCUSSION Nanocomposite Membrane Psf Membrane Specific cake resistance for the fouling stage
  • 10.
    Flux recovery Jy andJx are the membrane pure water flux before and after filtration of fracking wastewater, respectively Cleaning of Membrane :  Rinsing with DI water  Time = 30 mins  applied pressure = 0.28 bar 8 RESULTS & DISCUSSION flux recovery
  • 11.
    Draw Solution NaP (4.6 M) NaCl(4.0M) Membrane Nano- -composite PA Conditions:​ Time :6 h Flow rate : 0.5 L/min ​ Temperature : 24 °C  Concentration of the draw solution was adjusted by adding concentrated draw solution in every 15 min  Effective surface area of membrane =19.94 cm2 9 METHODOLOGY(FO)
  • 12.
    I. The lowerTDS value in feed solution before FO and higher in draw solution after FO tells that very small quantities of solute might pass through the membrane from feed to draw side during desalination by FO in case of NaP draw solution. II. The higher TOC and TDS values in feed after desalination were likely due to reverse salt flux of the organic draw solutions during FO process. III. TOC values were almost identical before and after desalination for the NaCl draw solution, indicating a greater than 99% rejection of dissolved organic compounds in fracking wastewaters during FO. 10 RESULTS & DISCUSSIONS
  • 13.
    1) This declinationoccurs due to the effects of concentration polarization, membrane fouling, and draw solution reverse salt flux during desalination of fracking wastewater. 2) Higher diffusivity and lower reverse salt flux gives high initial water fluxes and lower declines of water for the NaP draw solution as compared to NaCl solution. 3) Nanocomposite is more hydrophilic in nature. 4) The FO membranes may have fouled instantly with the raw fracking wastewater, as compared to pre-treated fracking wastewater. raw fracking wastewater raw fracking wastewater Pre-treated fracking wastewater Pre-treated fracking wastewater 11 RESULTS & DISCUSSIONS
  • 14.
    Pre-treated fracking wastewaterPre-treated fracking wastewater raw fracking wastewater raw fracking wastewater There was a reduction in flux due to concentration of feed solution that influenced the quantity of permeate volume in the FO process. 12 RESULTS & DISCUSSIONS
  • 15.
    Cleaning of Membrane: • DI water was considered for both feed and draw solution • Time = 2hr • Flow rate = 1L/min • Again experiments were conducted for 6 h at the flow rate of 0.5 L/min • 97.6% and 95% of initial water flux can be recovered by the nanocomposite and PA membranes Flux decline before Cleaning Flux decline after Cleaning Nano-- composite 14% 17% PA 24% 28% 13 RESULTS & DISCUSSIONS (A) Decline of water flux for the pristine membrane (B) Decline of water flux after cleaning of the membrane FO water flux recovery after cleaning of the membrane o Draw solution: 4.0 M NaCl​ o Feed: Pre-treated fracking wastewater
  • 16.
    o Draw solution:4.6 M NaP o Feed: Pre-treated fracking wastewater. o 98.5% and 97% of initial water flux can be recovered by the nanocomposite and PA membranes. 14 RESULTS & DISCUSSIONS (A) Decline of water flux for the pristine membrane (B) Decline of water flux after cleaning the membrane FO water flux recovery after cleaning of the membrane
  • 17.
    FE-SEM images whileNaCl was used as draw solution FE-SEM images when NaP was used as draw solution 15 RESULTS & DISCUSSIONS
  • 18.
    SEM-EDX spectra 16 RESULTS& DISCUSSIONS A) Pt was also obtained in the EDX spectra because of the Pt coating applied to conduct the SEM analysis on the membranes. B) A new peak for Si was obtained for the PA membrane due to fouled sand particles upcoming from wastewater, CaCO3, and MgCO3 precipitation. C) The peaks for Na, K, Fe and Cl were likely obtained due to crystallization of NaCl, KCl, and FeCl2/FeCl3 while the membranes were dried after fouling. D) The Si-peak for nanocomposite membrane was obtained due to its constituent of SiO2 nanoparticles in its composition.
  • 19.
    WHY? : Torecycle the FO draw solutions  PVDF membrane is used here.  Effective surface area of membrane =34 cm2  Feed Solution = Draw solution of FO Conditions:​​ Time :3 h Temperature(Feed) : 50 °C​ Temperature(Draw) : 20 °C Permeate Flux Solute Rejection Concentratio n of Feed Gravimetric Method Weight of Permeate digital weight balance Conductivity a calibrated conductivity meter (at 30 min intervals) 17 METHODOLOGY(MD)
  • 20.
     Here pre-treatedfracking wastewater was used as feed with nanocomposite membrane.  The higher permeate flux for NaP was obtained due to its lower interaction with water molecules as compared to NaCl. 18 RESULTS & DISCUSSIONS Permeate flux Permeate quality Feed concentration as a function of time
  • 21.
    Feed Conditions ProductRequirements Economics Environment Considerations 1) Highly saline. 1) High solute rejection in each step of separation. 1) Less Energy Intensive Process. 1) Production of more concentrated feed solution in FO. 2) High Flux recovery. 3) Reversible Fouling 19  The novel combined MF-FO-MD process has major potential to be used for the treatment of high salinity waste streams such as fracking wastewater.​ CONCLUSIONS
  • 22.
    THANK YOU ! FORYOUR ATTENTION ~You never know the worth of water till the well is dry~
  • 23.
    The balance betweencohesive and adhesive forces defines the degree of wettability. Solids can be divided into high and low-energy solids. High energy solids such as glass, ceramics, and metals are held together by chemical bonds (covalent, ionic and metal) which are very strong. This causes high excess energy on the surface of the solid i.e. the name high energy solid. Most of the liquids will wet the high energy solid completely as that will lead to a decrease in interfacial energy. Low-energy solids, such as many of the polymers, especially Teflon are harder to wet.