Cemar's operating and financial results for 1Q12 are presented. Key highlights include:
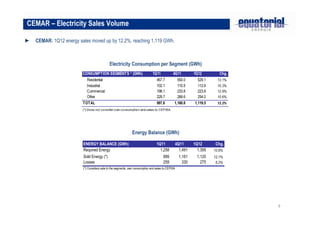
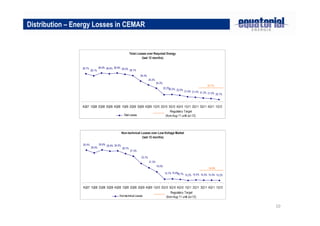
- Cemar's billed energy volume increased 12.2% to 1,119 GWh in 1Q12. Energy losses decreased 0.9 percentage points to 20.7%.
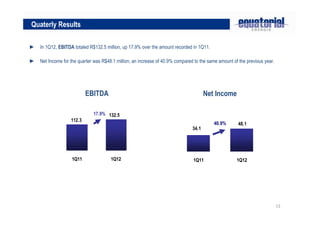
- Net operating revenues increased 32.1% to R$545.8 million in 1Q12, reflecting a 30.5% rise for Cemar. EBITDA rose 17.9% to R$132.5 million.
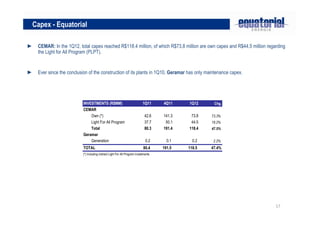
- Net income was R$48.1 million, down 40.9% from the prior year, while consolidated investments increased 47.4% to R$118.5 million