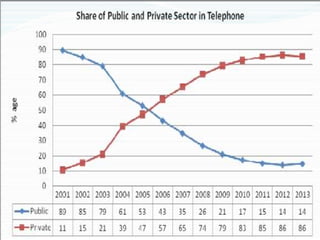
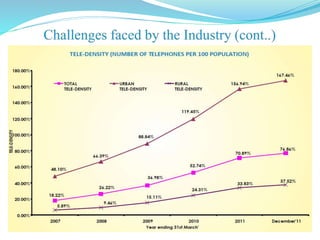
A Microeconomic Analysis
of
The Indian Telecom Sector
(Group-2)
Awadhesh Kumar Singh 14PPM05
Dharmesh Makwana 14PPM06
Harish Kumar 14PPM07
Hirdesh Kumar 14PPM08
 1975 Dept. of Telecom separated from Indian
Post & Telegraph Dept
 1985 MTNL carved out of DOT for telecom
services in Delhi and Mumbai
 1994 National Telecom Policy 1994 announced.
Affordable World Class Telecom Service,
Opening of FDI
 1995 1st mobile telephone service started
on 15 Aug 1995
 1997 Telecom Regulatory Authority of India
was setup
The Telecom Sector Evolution
 1999 National Telecom Policy 1999 announced
 2000 BSNL carved out of DoT
 2002 BSNL entered in to GSM cellular operation
 2003 Unified Access (Basic & Cellular) Service License
(USAL) introduced
 2004 License fee reduced by 2% across the board for all
the access licenses
 2009-10 3G auction for public and private players
The Telecom Sector Evolution (cont..)
 Total subscriber 933 m
 World’s second largest mobile phone users 904 m
 Overall teledensity 75 : urban 146 & rural 44
 Total revenue of the sector approx 2.8 lac crores
 Compound annual growth rate (CAGR) of 64 per cent per annum
during 2002-12
 13 major service providers in the market
 Market share : 89.1% Private & 10.9% State PSU
Facts & Figures
 Three type of players :
 State owned companies (BSNL and MTNL)
 Private Indian owned companies (Reliance, Tata etc.)
 Foreign invested companies (Vodafone, Bharti Tele-Ventures, MTS
etc.)
Market share of Telecom (cont..)
 BSNL established – 2000
 NLD, ILD services are opened for competition – 2000
 CDMA technology launched – 2000
 Internet Telephony Initiated – 2000
 Reduction of license fees -2000
 VSNL privatized – 2002
 Launch of mobile services by BSNL – 2000
 UASL regime was introduced – 2003
 Calling Party pays (CPP) was implemented – 2003
 Broadband Policy was formulated – 2004
 Intra Circle Merger guidelines established – 2004
 FDI limits increased from 49% to 74% - 2005
 Number Portability was started – 2010
 Prior to opening of FDI Telecom was a state owned Monopoly
 It was less efficient, high consumer tariffs, long waiting list
 In 1995 first time competition started in telecom sector as mobile
services were launched by private firms
 From 1995 to 2002 market indicated signs of
competition/cartelization. The call tariffs were very high during this
period. Firms earned supernormal profits and Indian market lured all
big international telecom players
Emergence of competition
 In 2003 state owned PSU BSNL entered in mobile telecom market
which was instrumental in breaking so called cartelization of
mobile private firms
 From 2003 onwards there is successive reduction of tariffs by all
firms one after another
 The decision of one firm was/is not only dependent upon itself but
also on governed by decisions of competitors, thus proving nature
of interaction while taking decisions
 It shows the Indian telecom market is oligopolistic in nature
Emergence of competition (cont..)
Tariff in 2000 Tariff in 2014
Long Distance Rs 35 per Min 50 paise per Min
Local Call Rs 16 per Min 50 paise per Min
ISD Rs 85 per Min Rs 5 per Min
Incoming Call Rs 12 per Min Free
Competition Reduced Tariffs
 Reduced Tariff rates
 Variety of Mobile Handsets at cheaper rates
 Value added Services (VAS) introduction e.g. SMS, MMS, M-
commerce
 Boost to Telecom Manufacturing Companies
 Huge employment opportunities
 Key driver for growth of other sectors
Benefits of Competition
 The Consumers Reduced Tariff & large
Range of IT services
 Social Benefits Large Emp. Opportunities
 The Companies Exponential Growth
 The Telecom Sector Transformed
 Other Sectors Boost to dependent sectors
 The country Huge Development, Income &
Prosperity as a whole
who gained what
Key Regulatory Authorities
 Telecom Commission : Policy making
 DOT : Licensing
 WPC : Spectrum allocation & management
 TRAI : Regulator
 TEC : Telecom Equipment Approval
Role of TRAI:
 Provide a fair and transparent policy environment which facilitates fair
competition
 To provide level playing field
 Price Ceiling
 In pursuance of above objective TRAI has issued from time to time a large
number of regulations
 The young generation is attracted more and more towards cell
phones and this has become a trend. This assures a high growth in
the industry
 Most of the service providers have covered majority of the urban
population
 The untapped rural population further ensures growth in the
industry
 Significant growth each year due to the impact of economic
reforms and pro-active policies of the government.
The share of private sector in total telephone connections is now
77% as against a meager 5% in 1999
It is also envisaged that internet and broad-band subscribers will
increase to 50 million and 25 million, respectively, by 2014
 Investor-friendly FDI environment for the growth. At present, 74%
to 100% FDI is permitted for various telecom services
 Degree of Concentration : The telecommunications industry is a vast
one with a large number of private players who are constantly
bringing down the cost to consumers thereby making services more
affordable and helping improve life in general and business in
particular
 Ease of entry: Friction exists between existing players and the newer
entrants, as also between the providers of services based on different
technologies. The same is resolved through the regulator in order to
further improve the services
 Although the industry requires huge capital investments and due to
high entry barrier the sector is monopolized by small number of
players
 Industry capacity: Conservative estimates put a tag of a 3%
increase in the growth of GDP for every 1% rise in the tele-density
in the nation
 Accordingly, the sector has received a great thrust from the
government for investments and development
 The supply of spectrum by the Government is not meeting the
demand of the service providers
 The supply for landline telephones are more but the demand for
landline telephones are getting reduced as a result extensive use of
mobile phones
 There is a demand for hi-speed internet connection in different parts
of the country but those demands are not met by the service providers
in telecom industry and the supply of broadband connection by
service providers are not meeting the demand in market
The spectrum prices have increased considerably and as the result
the expansion requires huge capital investment.
Though the subscriber is increasing year on year, but due to heavy
competition the tariff rates are lowest in the world
The call rates dropped from INR 16.80 in 1995 to INR 0.30 in
2013
Operators have been announcing new promotional schemes
including reduction in tariffs for voice call, slashing roaming
charges and many more such lucrative offers.
Due to the fierce price war the profit margin and return of capital
has been declining over the years
Providers are trying to maintain the profit margins by “economics
of scale” and by providing “value added services”
Customers, due to competitive pricing have become “elastic” and
easily switch to the provider who provides the services at a lower
tariff
There is not much of brand loyalty as there is hardly any
differentiation in the services
Conclusion (cont..)Economies of Scale
Subscribers
Costperminute
 Market dominated by few players
 Barrier to entry of new firms
 Barriers are economy of scale
 High input cost
 Govt imposed barriers – spectrum
 Game theory
 Linking of spectrum with subscriber base – incentive
were so great that firms acted in ways that resulted in
lower profit
Characteristics of Oligopoly
Oligopolistic Market Structure (Wireless)
Top 5 players have 77% of market share
– Market Oligopolistic in Nature
Each player takes into account other player’s activities –
Importance of Strategic Interdependence on certain parameters
like prices, promotional schemes, etc
Barriers to Entry - Investment and licensing impediments –
Sector exhibits characteristics of Oligopoly
 Declining ARPU: Average revenue per user (ARPU) has been
falling year on year and most of the major players have been losing
between 10 to 20% in ARPU and going to decline further. This trend
is having negative impact on the bottom-line of all the players
 The EPS for almost all telecom companies are going down and a
result share prices is in a declining path
 The tariff war and the trend in declining revenue per user is not a
sustainable model going forward as bottom line growth is seems
muted in the coming years
Challenges faced by the Industry
Return on Capital Market Share of Operators
 The Indian mobile subscriber base is likely to sustain the growth
 Presence of skilled labour pool, improving telecom infrastructure,
favourable demographics, rising disposable incomes of consumers,
declining tariffs, increasing demand, growing attraction for mobiles with
new features and greater availability of handsets at lower prices, are
expected to continue driving the growth of the telecom sector, going
forward.
 However, the companies are likely to encounter a more challenging
business environment in the near future, given the sustained fall in ARPUs,
rapidly increasing competition and consequent pressure on margins and
regulatory risks
 Companies with good rural coverage, better operational efficiency, and
superior quality of service are likely to stay ahead of competitors
 The industry will also witness the mergers of relatively smaller companies
with the big players. Only big three or four players will dominate the
market and direct price war may stop and Industry will agree on a standard
pricing and competition will on the services and offerings
Thank You

Ppm group 2 ppt on telecom

  • 1.
    A Microeconomic Analysis of TheIndian Telecom Sector (Group-2) Awadhesh Kumar Singh 14PPM05 Dharmesh Makwana 14PPM06 Harish Kumar 14PPM07 Hirdesh Kumar 14PPM08
  • 2.
     1975 Dept.of Telecom separated from Indian Post & Telegraph Dept  1985 MTNL carved out of DOT for telecom services in Delhi and Mumbai  1994 National Telecom Policy 1994 announced. Affordable World Class Telecom Service, Opening of FDI  1995 1st mobile telephone service started on 15 Aug 1995  1997 Telecom Regulatory Authority of India was setup The Telecom Sector Evolution
  • 3.
     1999 NationalTelecom Policy 1999 announced  2000 BSNL carved out of DoT  2002 BSNL entered in to GSM cellular operation  2003 Unified Access (Basic & Cellular) Service License (USAL) introduced  2004 License fee reduced by 2% across the board for all the access licenses  2009-10 3G auction for public and private players The Telecom Sector Evolution (cont..)
  • 4.
     Total subscriber933 m  World’s second largest mobile phone users 904 m  Overall teledensity 75 : urban 146 & rural 44  Total revenue of the sector approx 2.8 lac crores  Compound annual growth rate (CAGR) of 64 per cent per annum during 2002-12  13 major service providers in the market  Market share : 89.1% Private & 10.9% State PSU Facts & Figures
  • 5.
     Three typeof players :  State owned companies (BSNL and MTNL)  Private Indian owned companies (Reliance, Tata etc.)  Foreign invested companies (Vodafone, Bharti Tele-Ventures, MTS etc.)
  • 6.
    Market share ofTelecom (cont..)
  • 8.
     BSNL established– 2000  NLD, ILD services are opened for competition – 2000  CDMA technology launched – 2000  Internet Telephony Initiated – 2000  Reduction of license fees -2000  VSNL privatized – 2002
  • 9.
     Launch ofmobile services by BSNL – 2000  UASL regime was introduced – 2003  Calling Party pays (CPP) was implemented – 2003  Broadband Policy was formulated – 2004  Intra Circle Merger guidelines established – 2004  FDI limits increased from 49% to 74% - 2005  Number Portability was started – 2010
  • 10.
     Prior toopening of FDI Telecom was a state owned Monopoly  It was less efficient, high consumer tariffs, long waiting list  In 1995 first time competition started in telecom sector as mobile services were launched by private firms  From 1995 to 2002 market indicated signs of competition/cartelization. The call tariffs were very high during this period. Firms earned supernormal profits and Indian market lured all big international telecom players Emergence of competition
  • 11.
     In 2003state owned PSU BSNL entered in mobile telecom market which was instrumental in breaking so called cartelization of mobile private firms  From 2003 onwards there is successive reduction of tariffs by all firms one after another  The decision of one firm was/is not only dependent upon itself but also on governed by decisions of competitors, thus proving nature of interaction while taking decisions  It shows the Indian telecom market is oligopolistic in nature Emergence of competition (cont..)
  • 12.
    Tariff in 2000Tariff in 2014 Long Distance Rs 35 per Min 50 paise per Min Local Call Rs 16 per Min 50 paise per Min ISD Rs 85 per Min Rs 5 per Min Incoming Call Rs 12 per Min Free Competition Reduced Tariffs
  • 13.
  • 14.
     Reduced Tariffrates  Variety of Mobile Handsets at cheaper rates  Value added Services (VAS) introduction e.g. SMS, MMS, M- commerce  Boost to Telecom Manufacturing Companies  Huge employment opportunities  Key driver for growth of other sectors Benefits of Competition
  • 15.
     The ConsumersReduced Tariff & large Range of IT services  Social Benefits Large Emp. Opportunities  The Companies Exponential Growth  The Telecom Sector Transformed  Other Sectors Boost to dependent sectors  The country Huge Development, Income & Prosperity as a whole who gained what
  • 16.
    Key Regulatory Authorities Telecom Commission : Policy making  DOT : Licensing  WPC : Spectrum allocation & management  TRAI : Regulator  TEC : Telecom Equipment Approval Role of TRAI:  Provide a fair and transparent policy environment which facilitates fair competition  To provide level playing field  Price Ceiling  In pursuance of above objective TRAI has issued from time to time a large number of regulations
  • 17.
     The younggeneration is attracted more and more towards cell phones and this has become a trend. This assures a high growth in the industry  Most of the service providers have covered majority of the urban population  The untapped rural population further ensures growth in the industry  Significant growth each year due to the impact of economic reforms and pro-active policies of the government.
  • 18.
    The share ofprivate sector in total telephone connections is now 77% as against a meager 5% in 1999 It is also envisaged that internet and broad-band subscribers will increase to 50 million and 25 million, respectively, by 2014  Investor-friendly FDI environment for the growth. At present, 74% to 100% FDI is permitted for various telecom services
  • 19.
     Degree ofConcentration : The telecommunications industry is a vast one with a large number of private players who are constantly bringing down the cost to consumers thereby making services more affordable and helping improve life in general and business in particular  Ease of entry: Friction exists between existing players and the newer entrants, as also between the providers of services based on different technologies. The same is resolved through the regulator in order to further improve the services  Although the industry requires huge capital investments and due to high entry barrier the sector is monopolized by small number of players
  • 20.
     Industry capacity:Conservative estimates put a tag of a 3% increase in the growth of GDP for every 1% rise in the tele-density in the nation  Accordingly, the sector has received a great thrust from the government for investments and development
  • 21.
     The supplyof spectrum by the Government is not meeting the demand of the service providers  The supply for landline telephones are more but the demand for landline telephones are getting reduced as a result extensive use of mobile phones  There is a demand for hi-speed internet connection in different parts of the country but those demands are not met by the service providers in telecom industry and the supply of broadband connection by service providers are not meeting the demand in market
  • 22.
    The spectrum priceshave increased considerably and as the result the expansion requires huge capital investment. Though the subscriber is increasing year on year, but due to heavy competition the tariff rates are lowest in the world The call rates dropped from INR 16.80 in 1995 to INR 0.30 in 2013 Operators have been announcing new promotional schemes including reduction in tariffs for voice call, slashing roaming charges and many more such lucrative offers.
  • 23.
    Due to thefierce price war the profit margin and return of capital has been declining over the years Providers are trying to maintain the profit margins by “economics of scale” and by providing “value added services” Customers, due to competitive pricing have become “elastic” and easily switch to the provider who provides the services at a lower tariff There is not much of brand loyalty as there is hardly any differentiation in the services
  • 24.
    Conclusion (cont..)Economies ofScale Subscribers Costperminute
  • 25.
     Market dominatedby few players  Barrier to entry of new firms  Barriers are economy of scale  High input cost  Govt imposed barriers – spectrum  Game theory  Linking of spectrum with subscriber base – incentive were so great that firms acted in ways that resulted in lower profit Characteristics of Oligopoly
  • 26.
    Oligopolistic Market Structure(Wireless) Top 5 players have 77% of market share – Market Oligopolistic in Nature Each player takes into account other player’s activities – Importance of Strategic Interdependence on certain parameters like prices, promotional schemes, etc Barriers to Entry - Investment and licensing impediments – Sector exhibits characteristics of Oligopoly
  • 27.
     Declining ARPU:Average revenue per user (ARPU) has been falling year on year and most of the major players have been losing between 10 to 20% in ARPU and going to decline further. This trend is having negative impact on the bottom-line of all the players  The EPS for almost all telecom companies are going down and a result share prices is in a declining path  The tariff war and the trend in declining revenue per user is not a sustainable model going forward as bottom line growth is seems muted in the coming years Challenges faced by the Industry
  • 29.
    Return on CapitalMarket Share of Operators
  • 30.
     The Indianmobile subscriber base is likely to sustain the growth  Presence of skilled labour pool, improving telecom infrastructure, favourable demographics, rising disposable incomes of consumers, declining tariffs, increasing demand, growing attraction for mobiles with new features and greater availability of handsets at lower prices, are expected to continue driving the growth of the telecom sector, going forward.  However, the companies are likely to encounter a more challenging business environment in the near future, given the sustained fall in ARPUs, rapidly increasing competition and consequent pressure on margins and regulatory risks
  • 31.
     Companies withgood rural coverage, better operational efficiency, and superior quality of service are likely to stay ahead of competitors  The industry will also witness the mergers of relatively smaller companies with the big players. Only big three or four players will dominate the market and direct price war may stop and Industry will agree on a standard pricing and competition will on the services and offerings
  • 32.