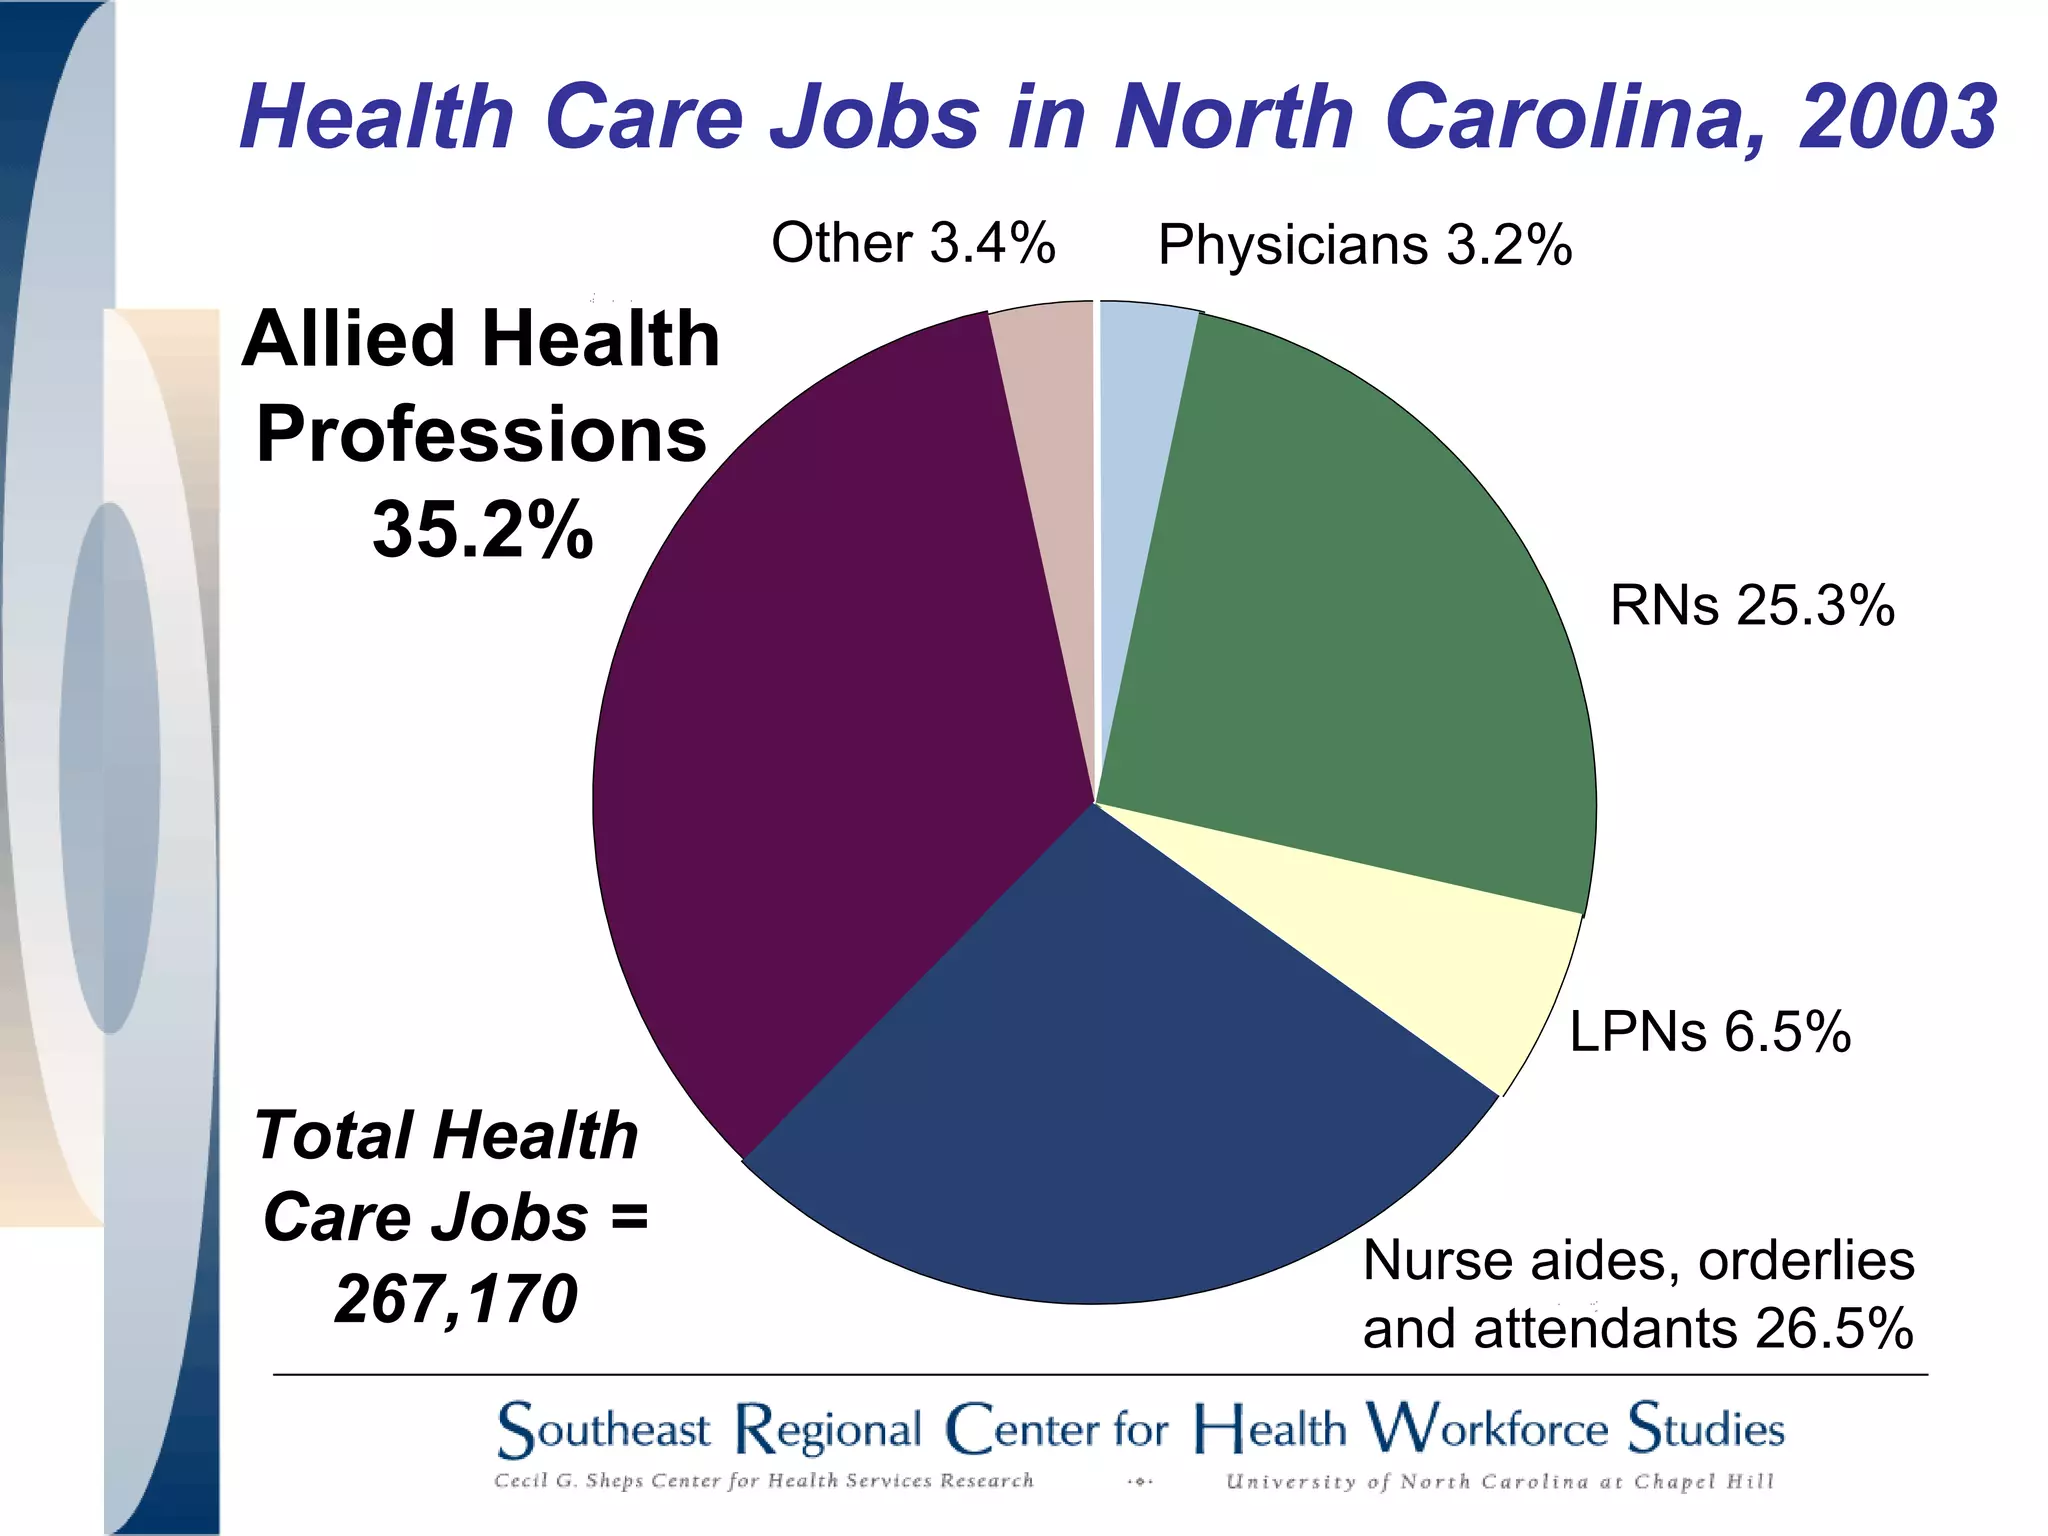
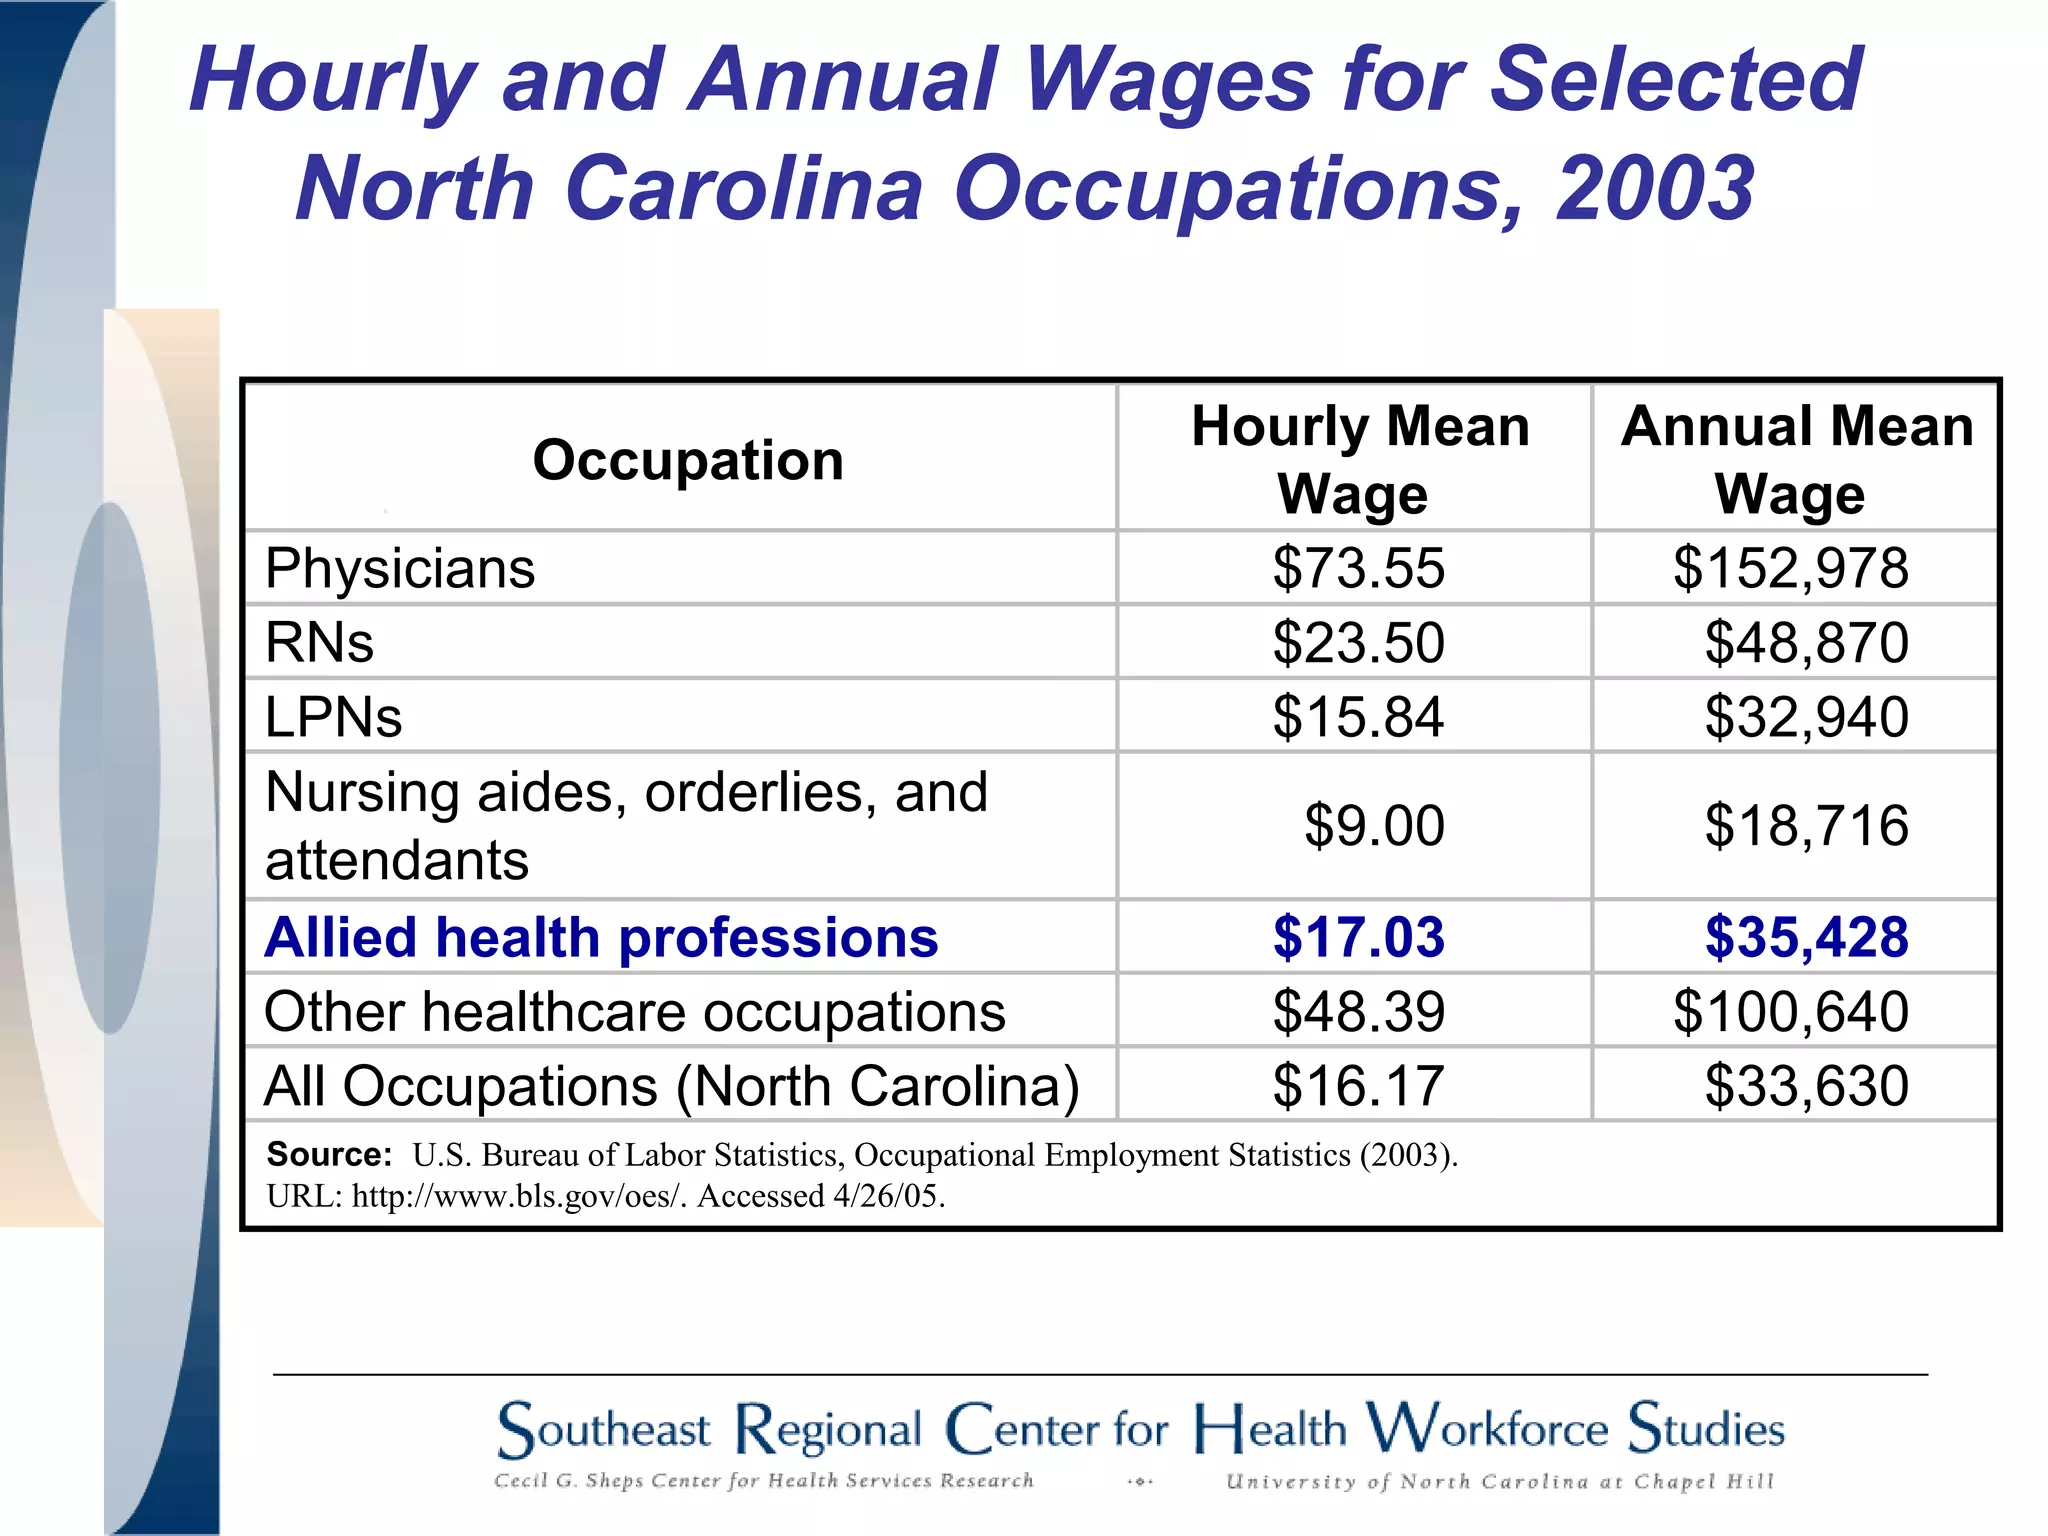
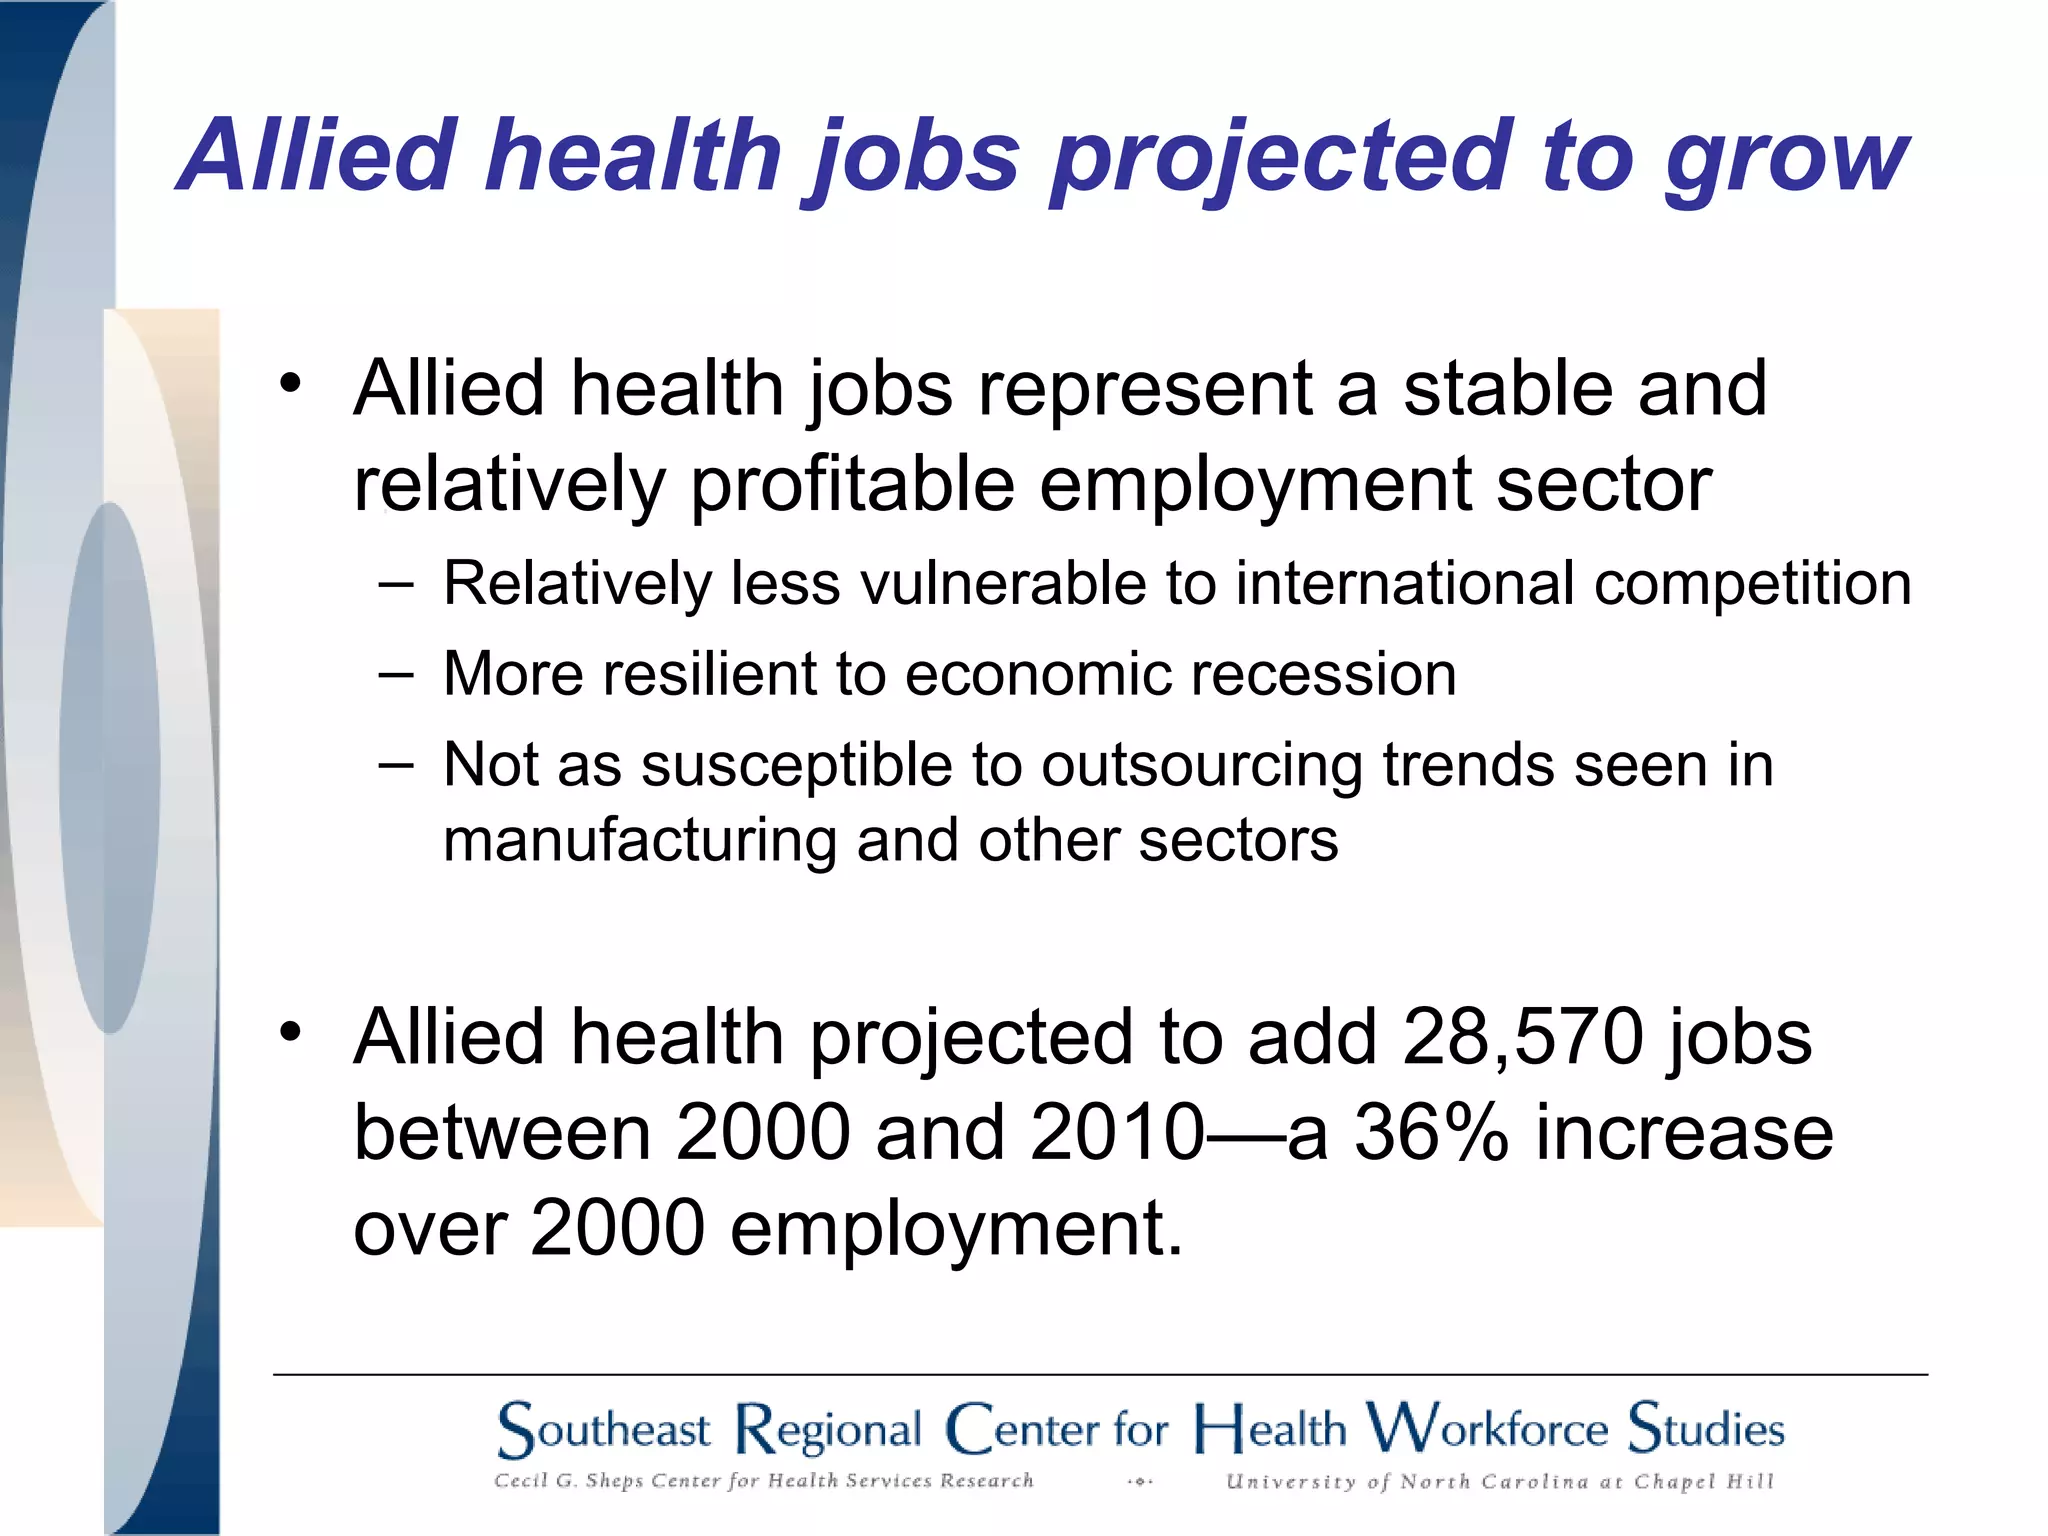
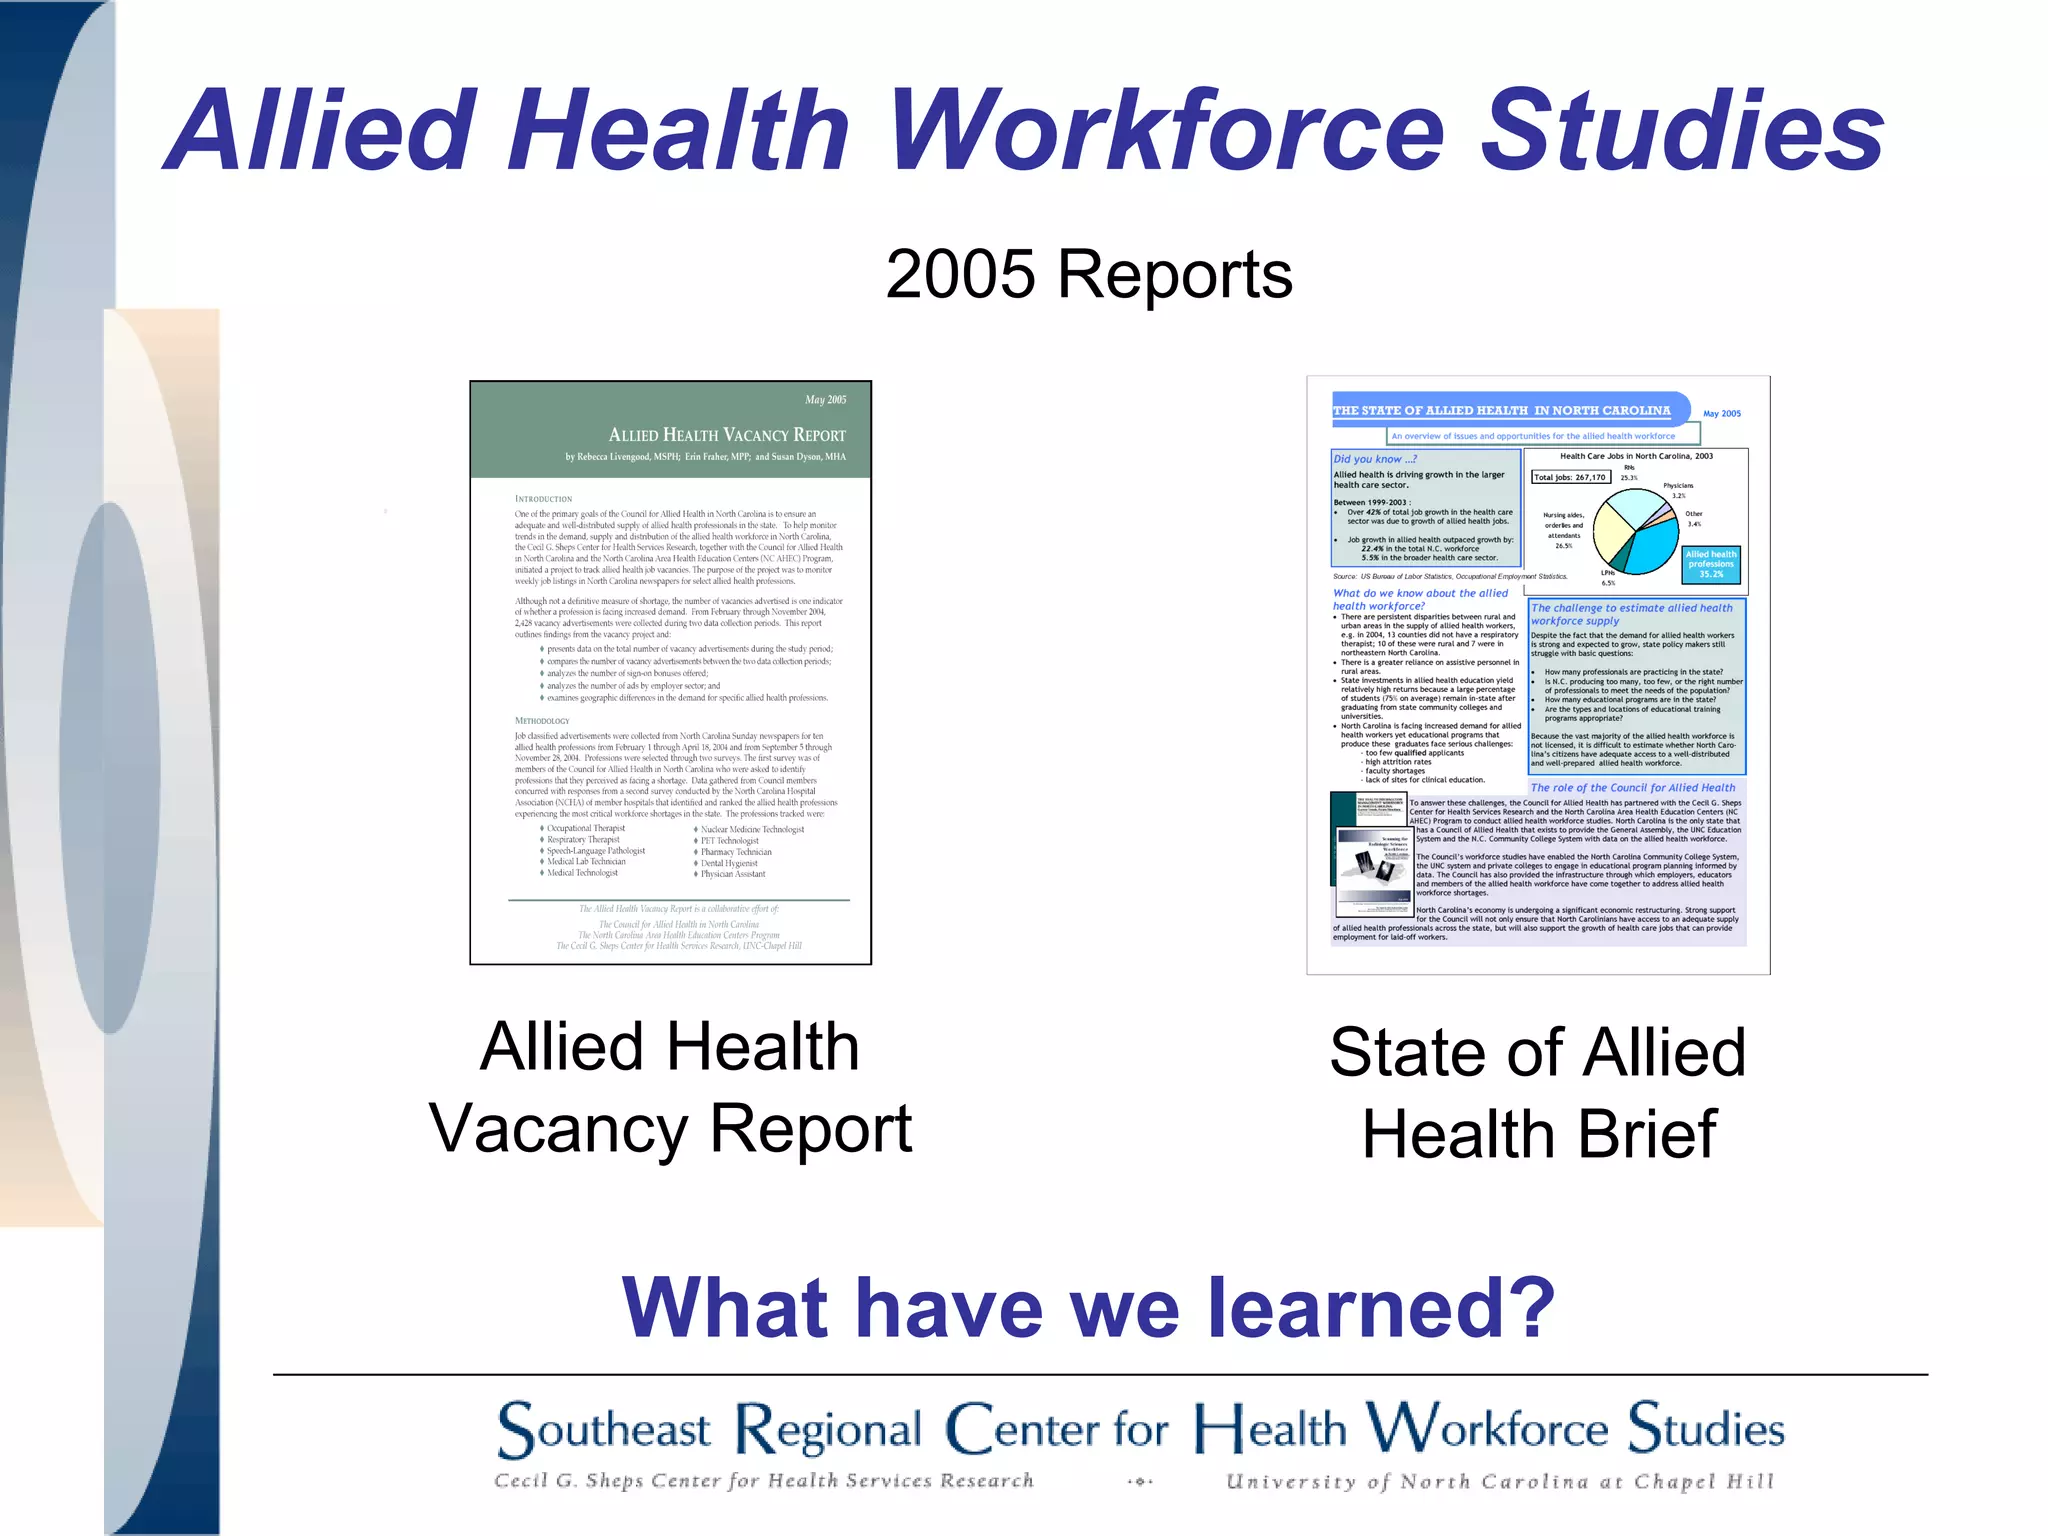
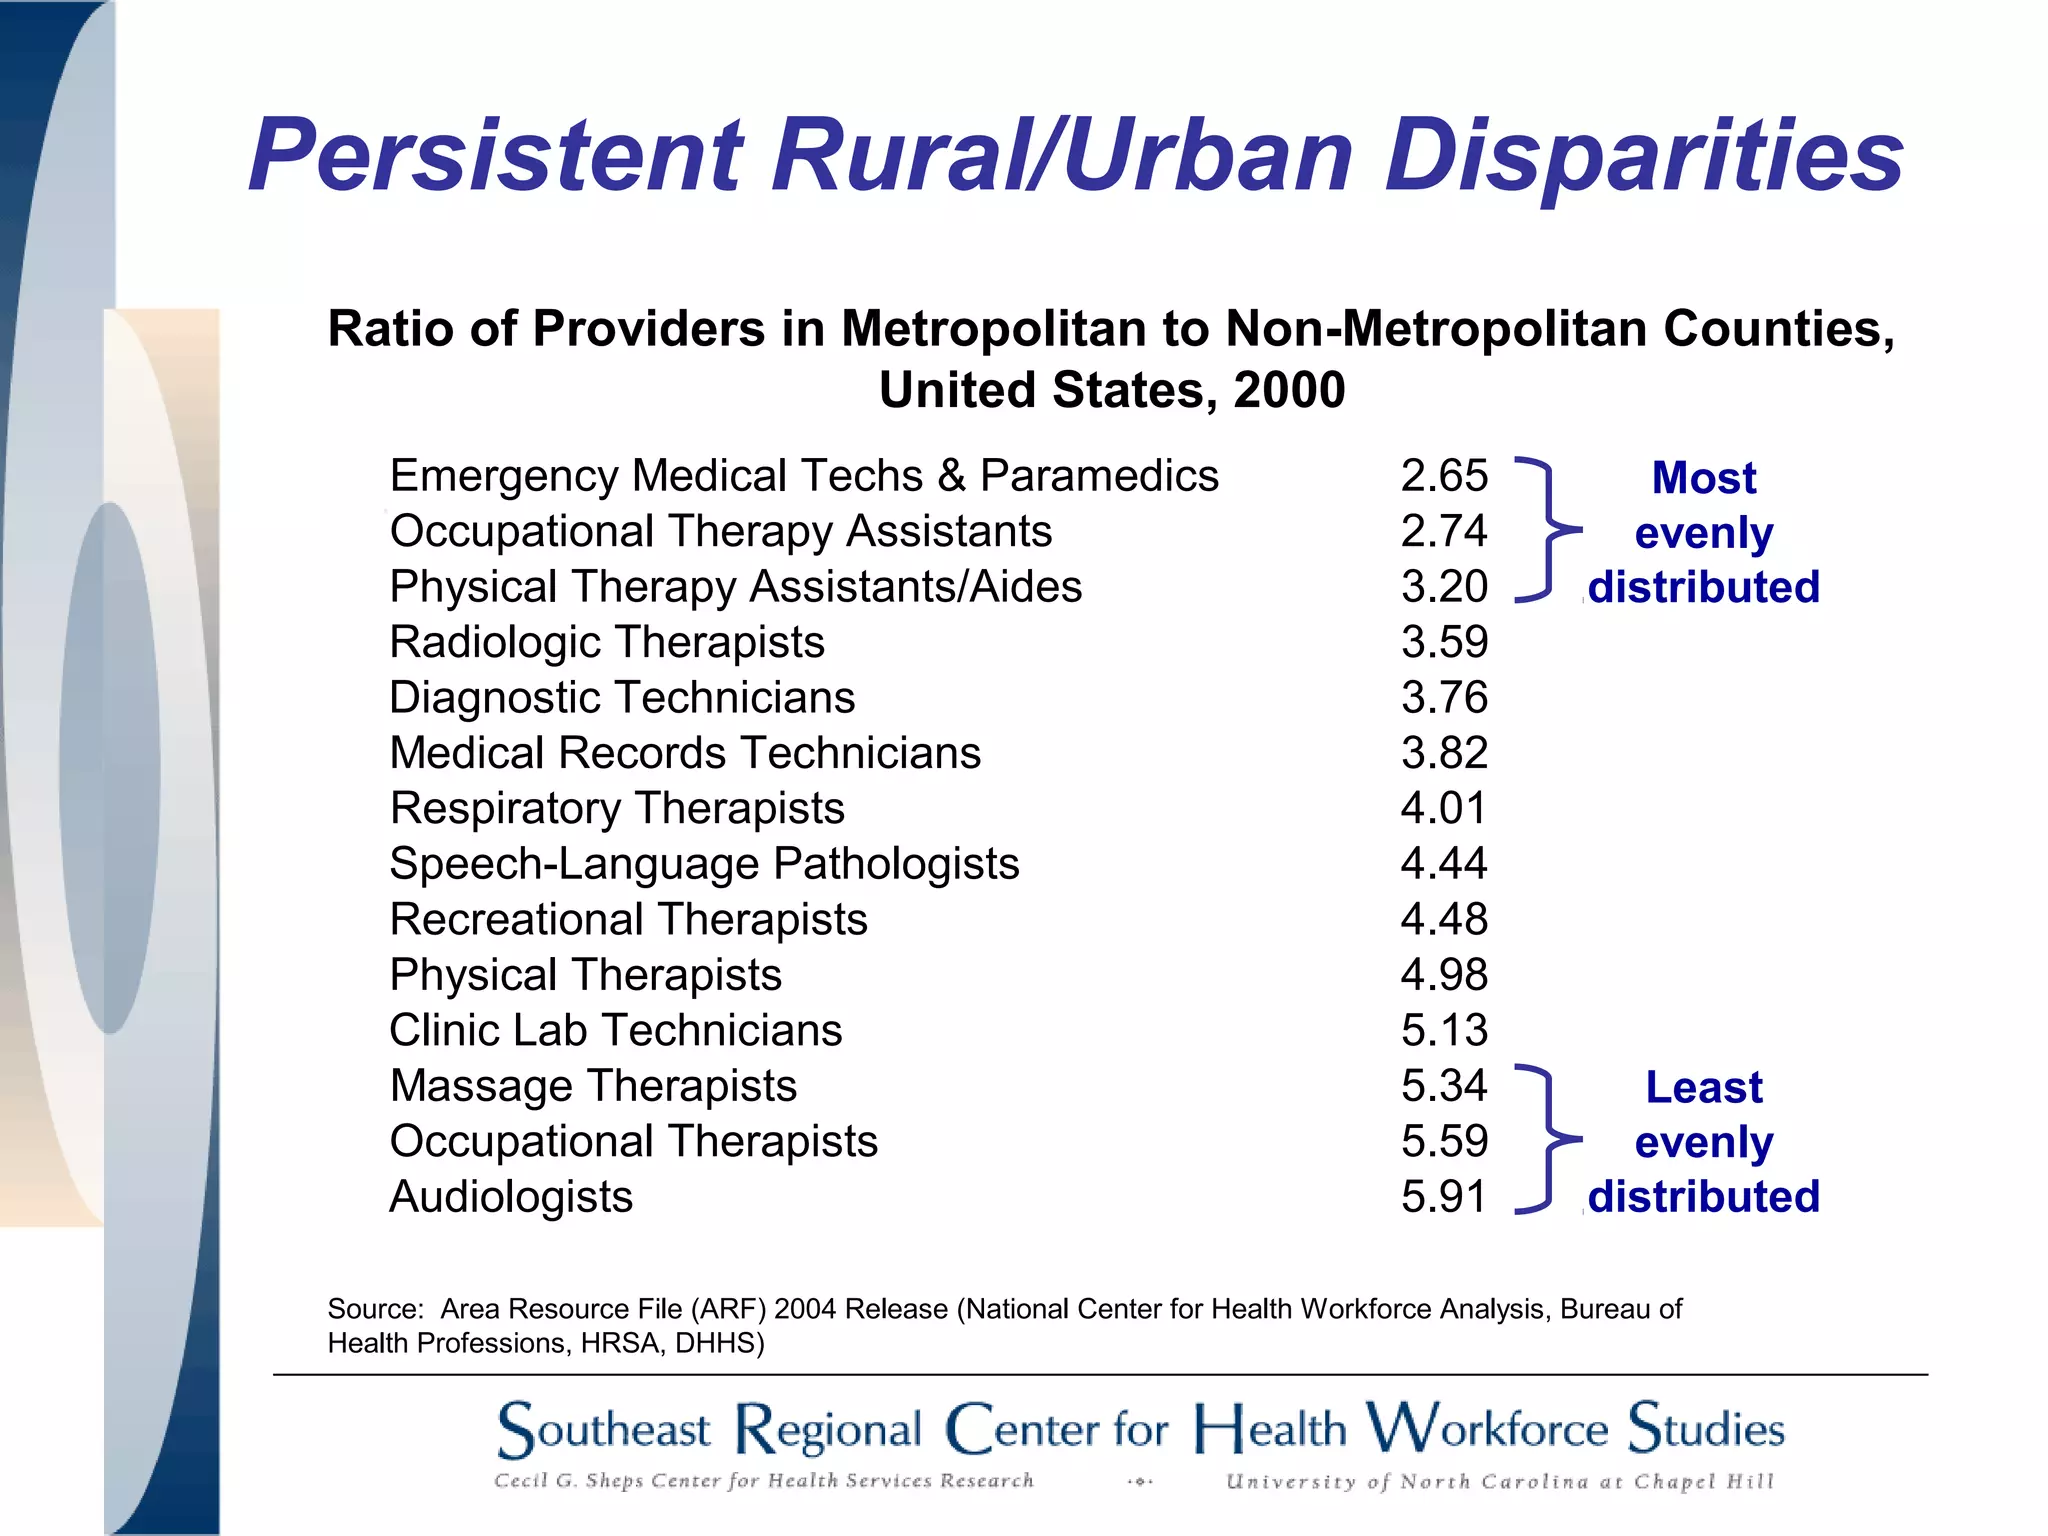
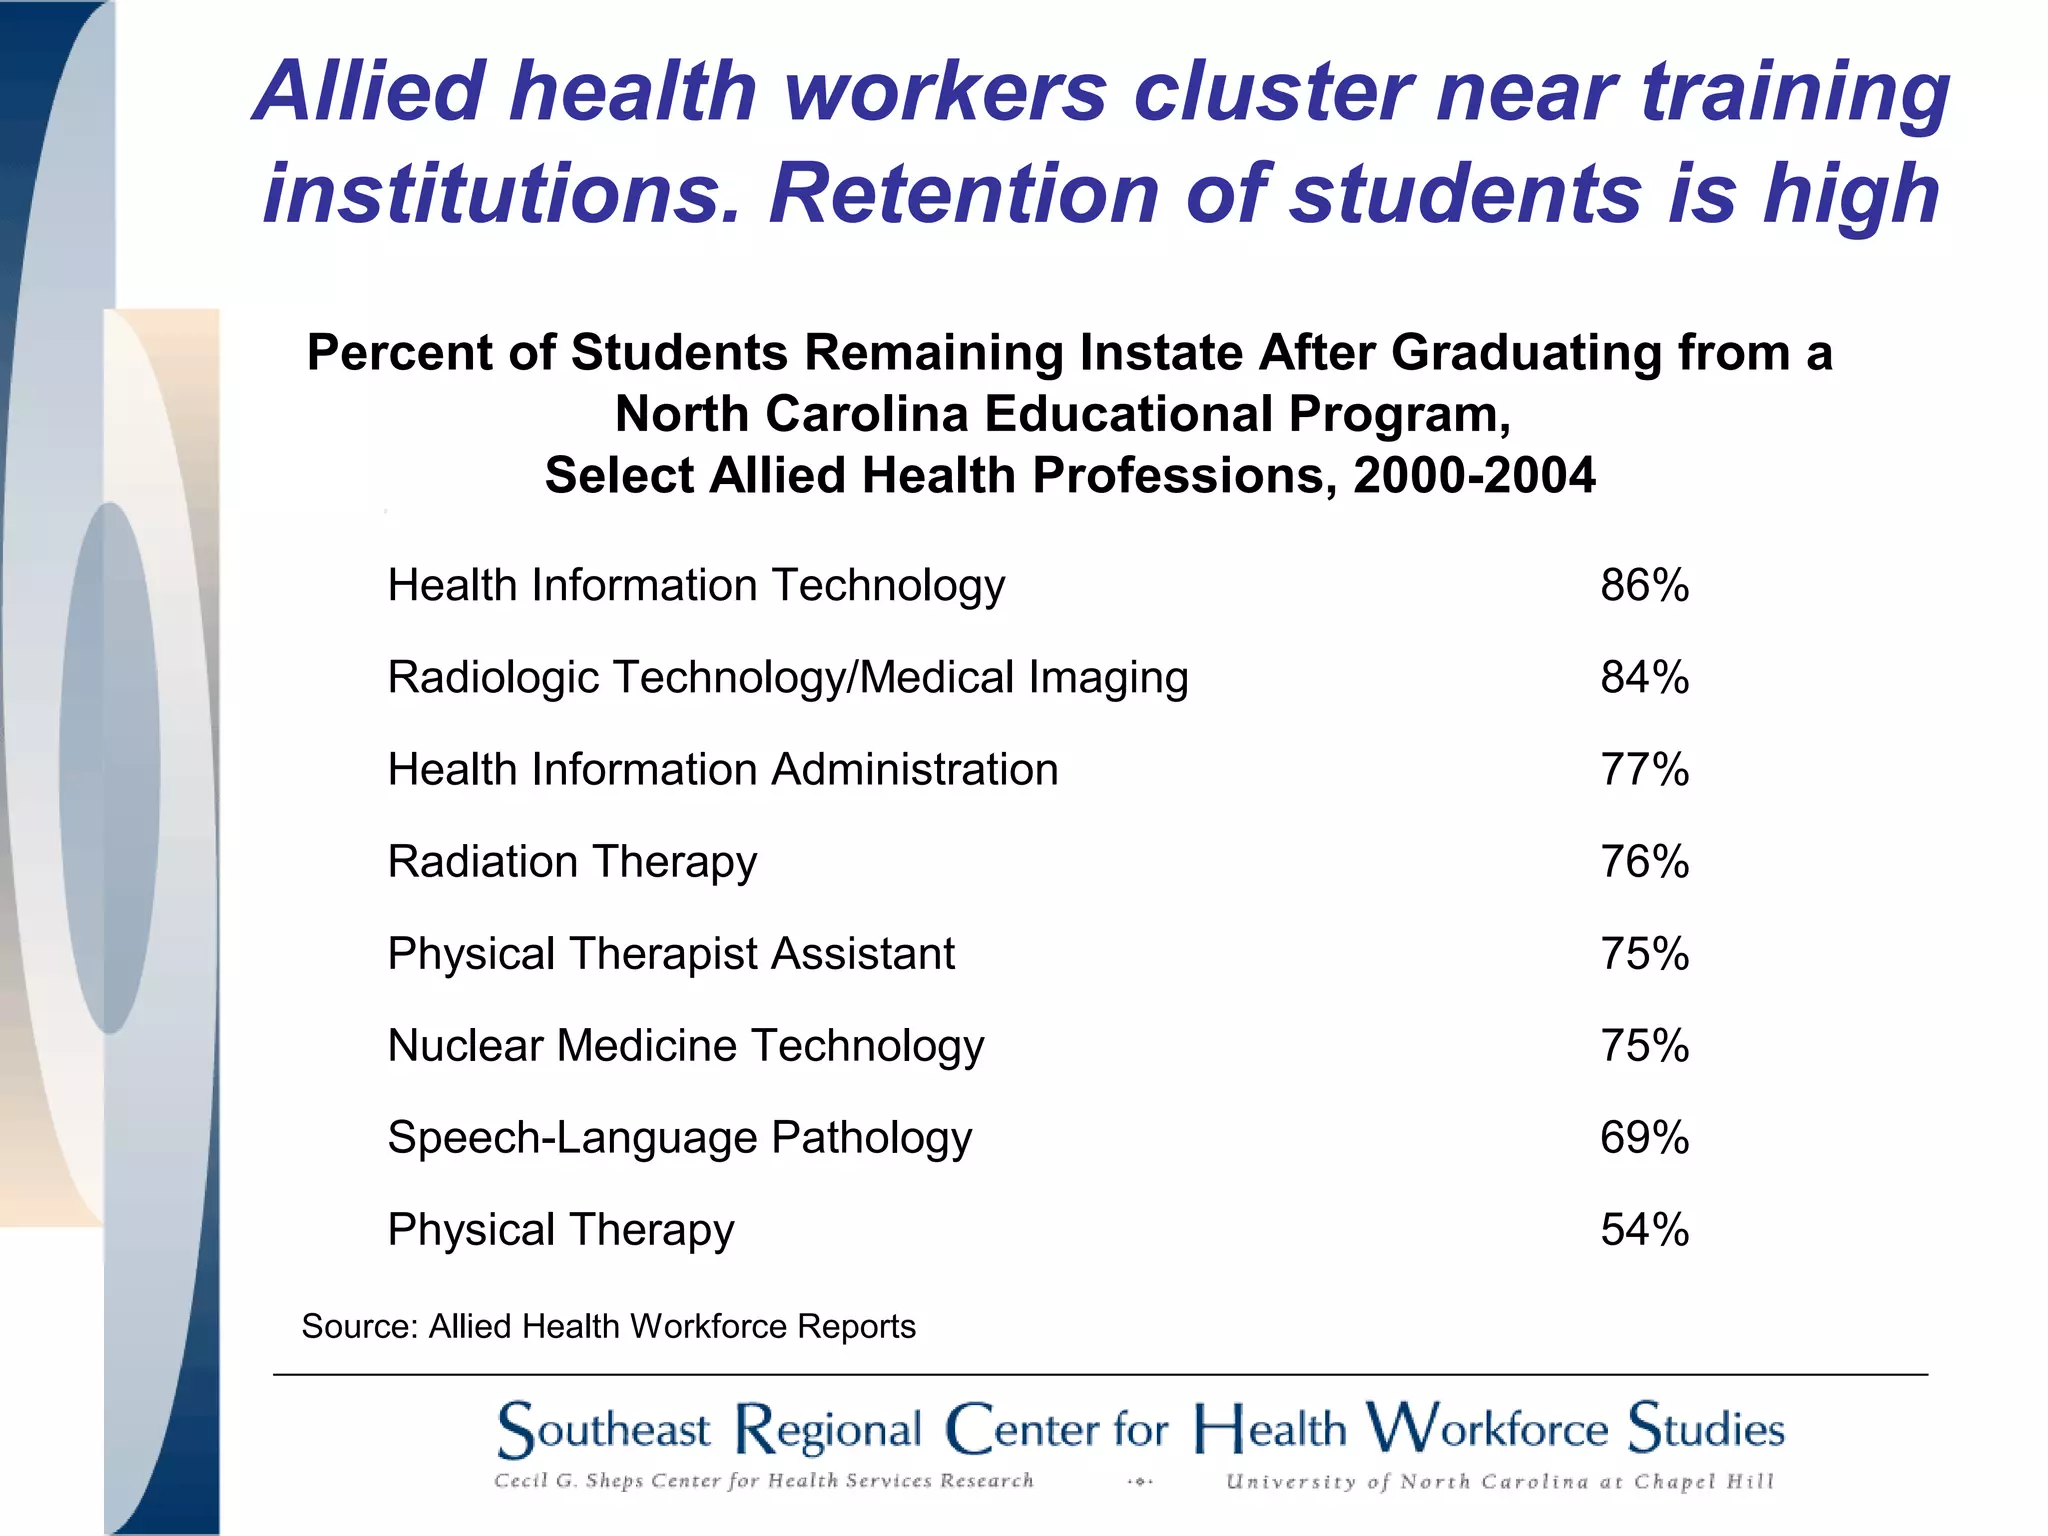
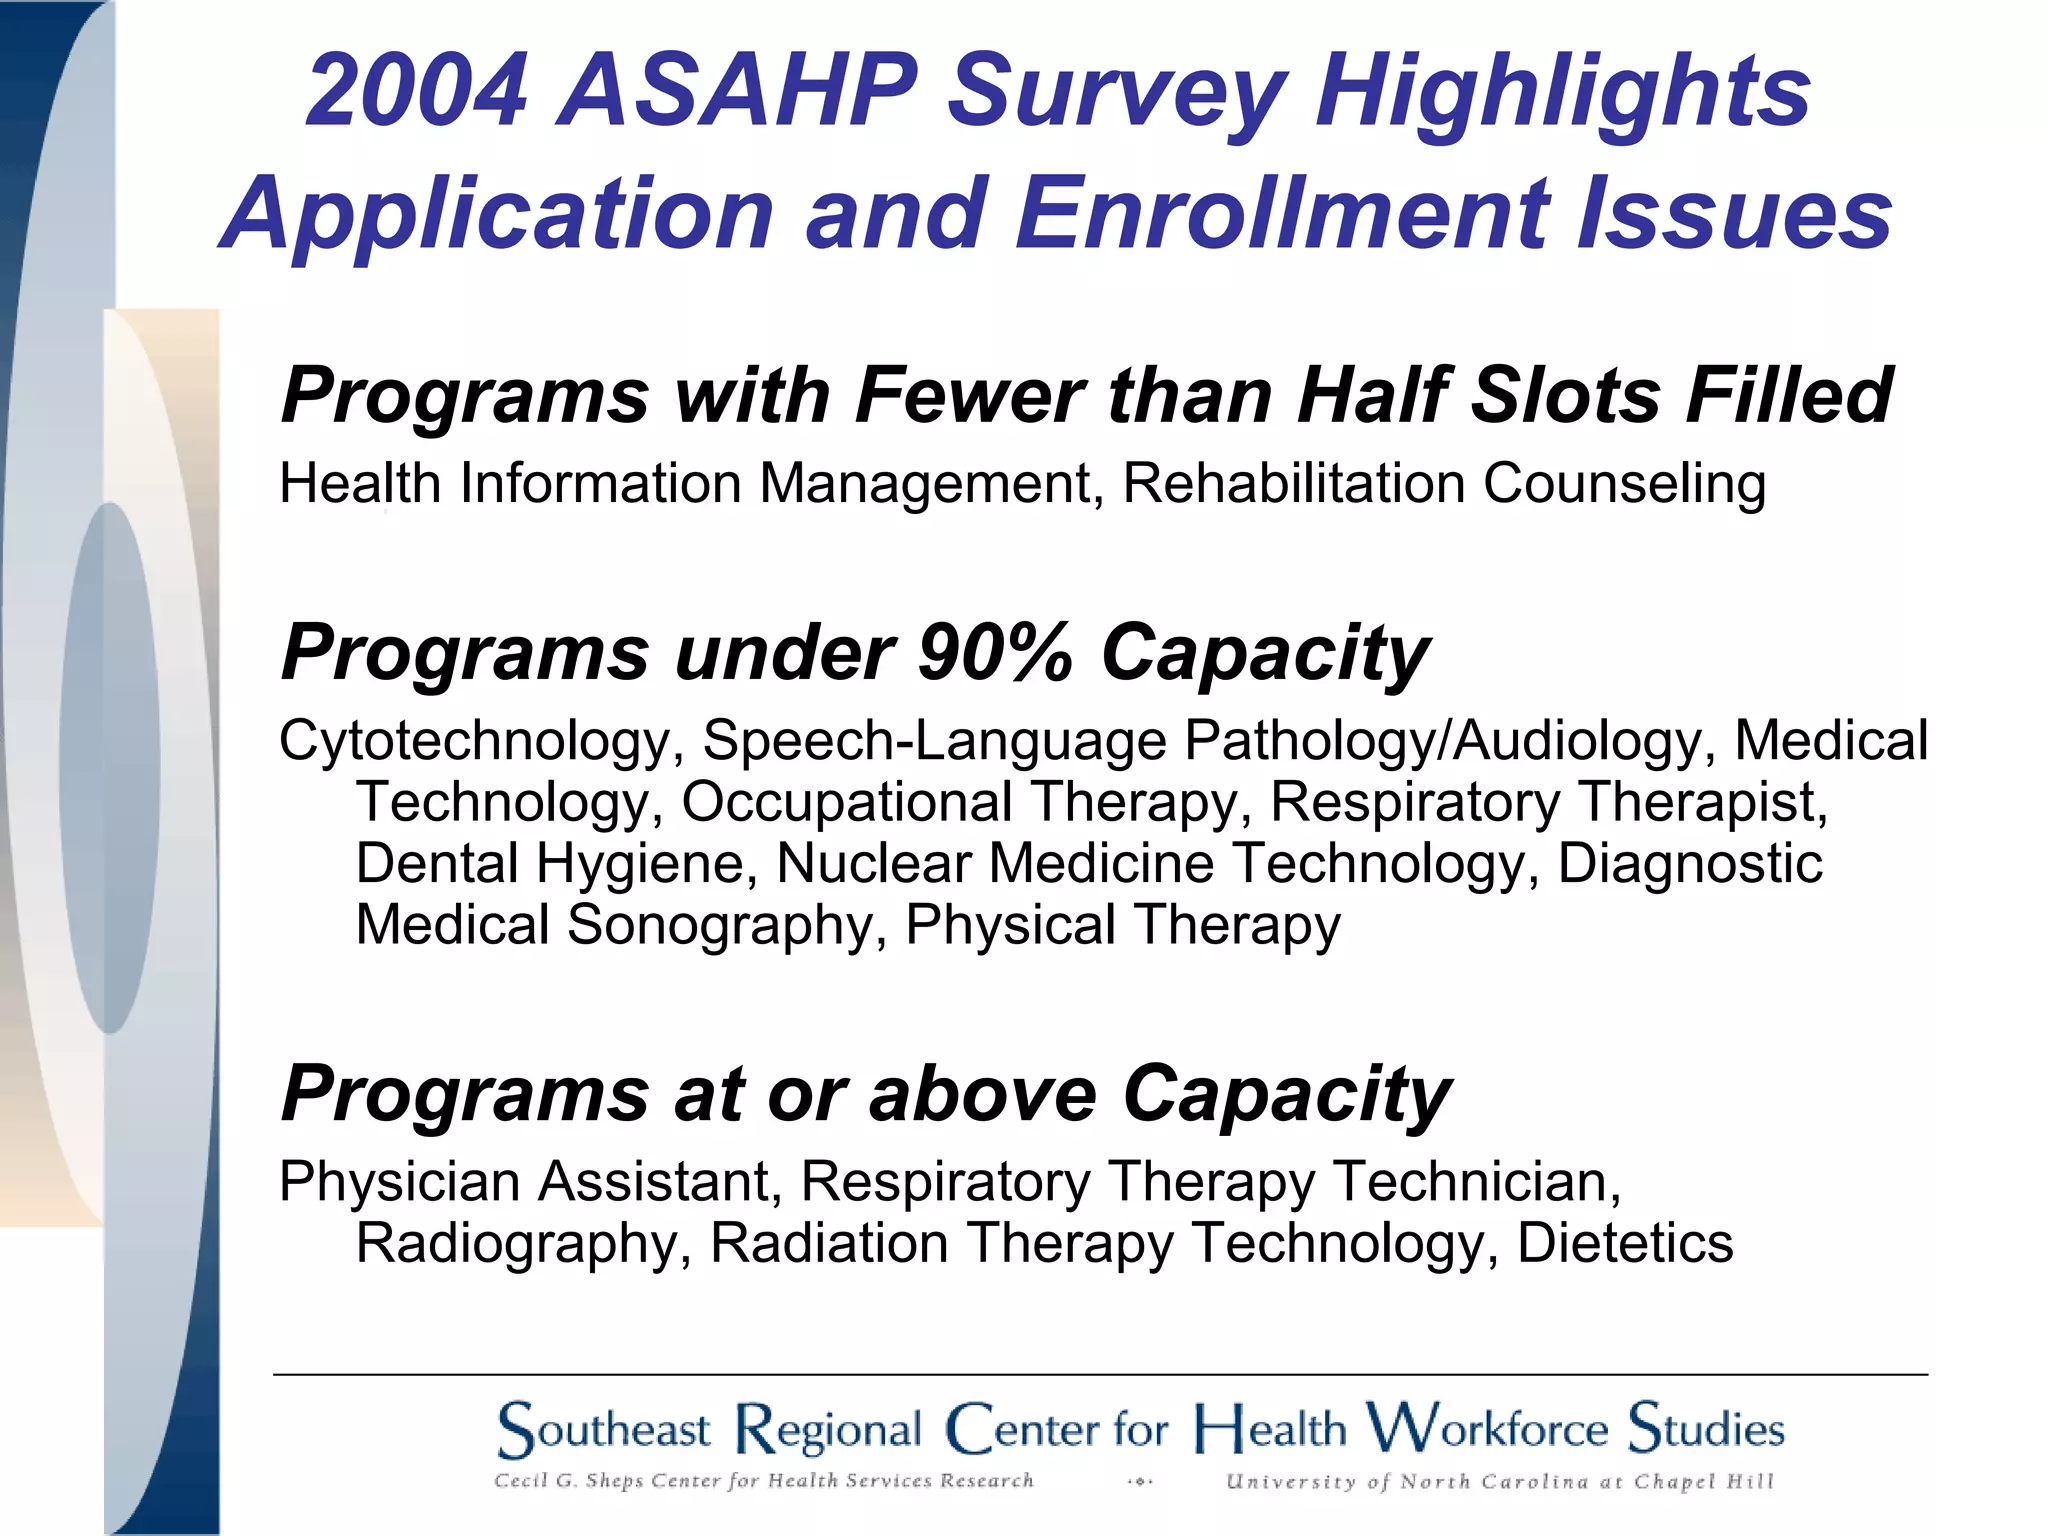
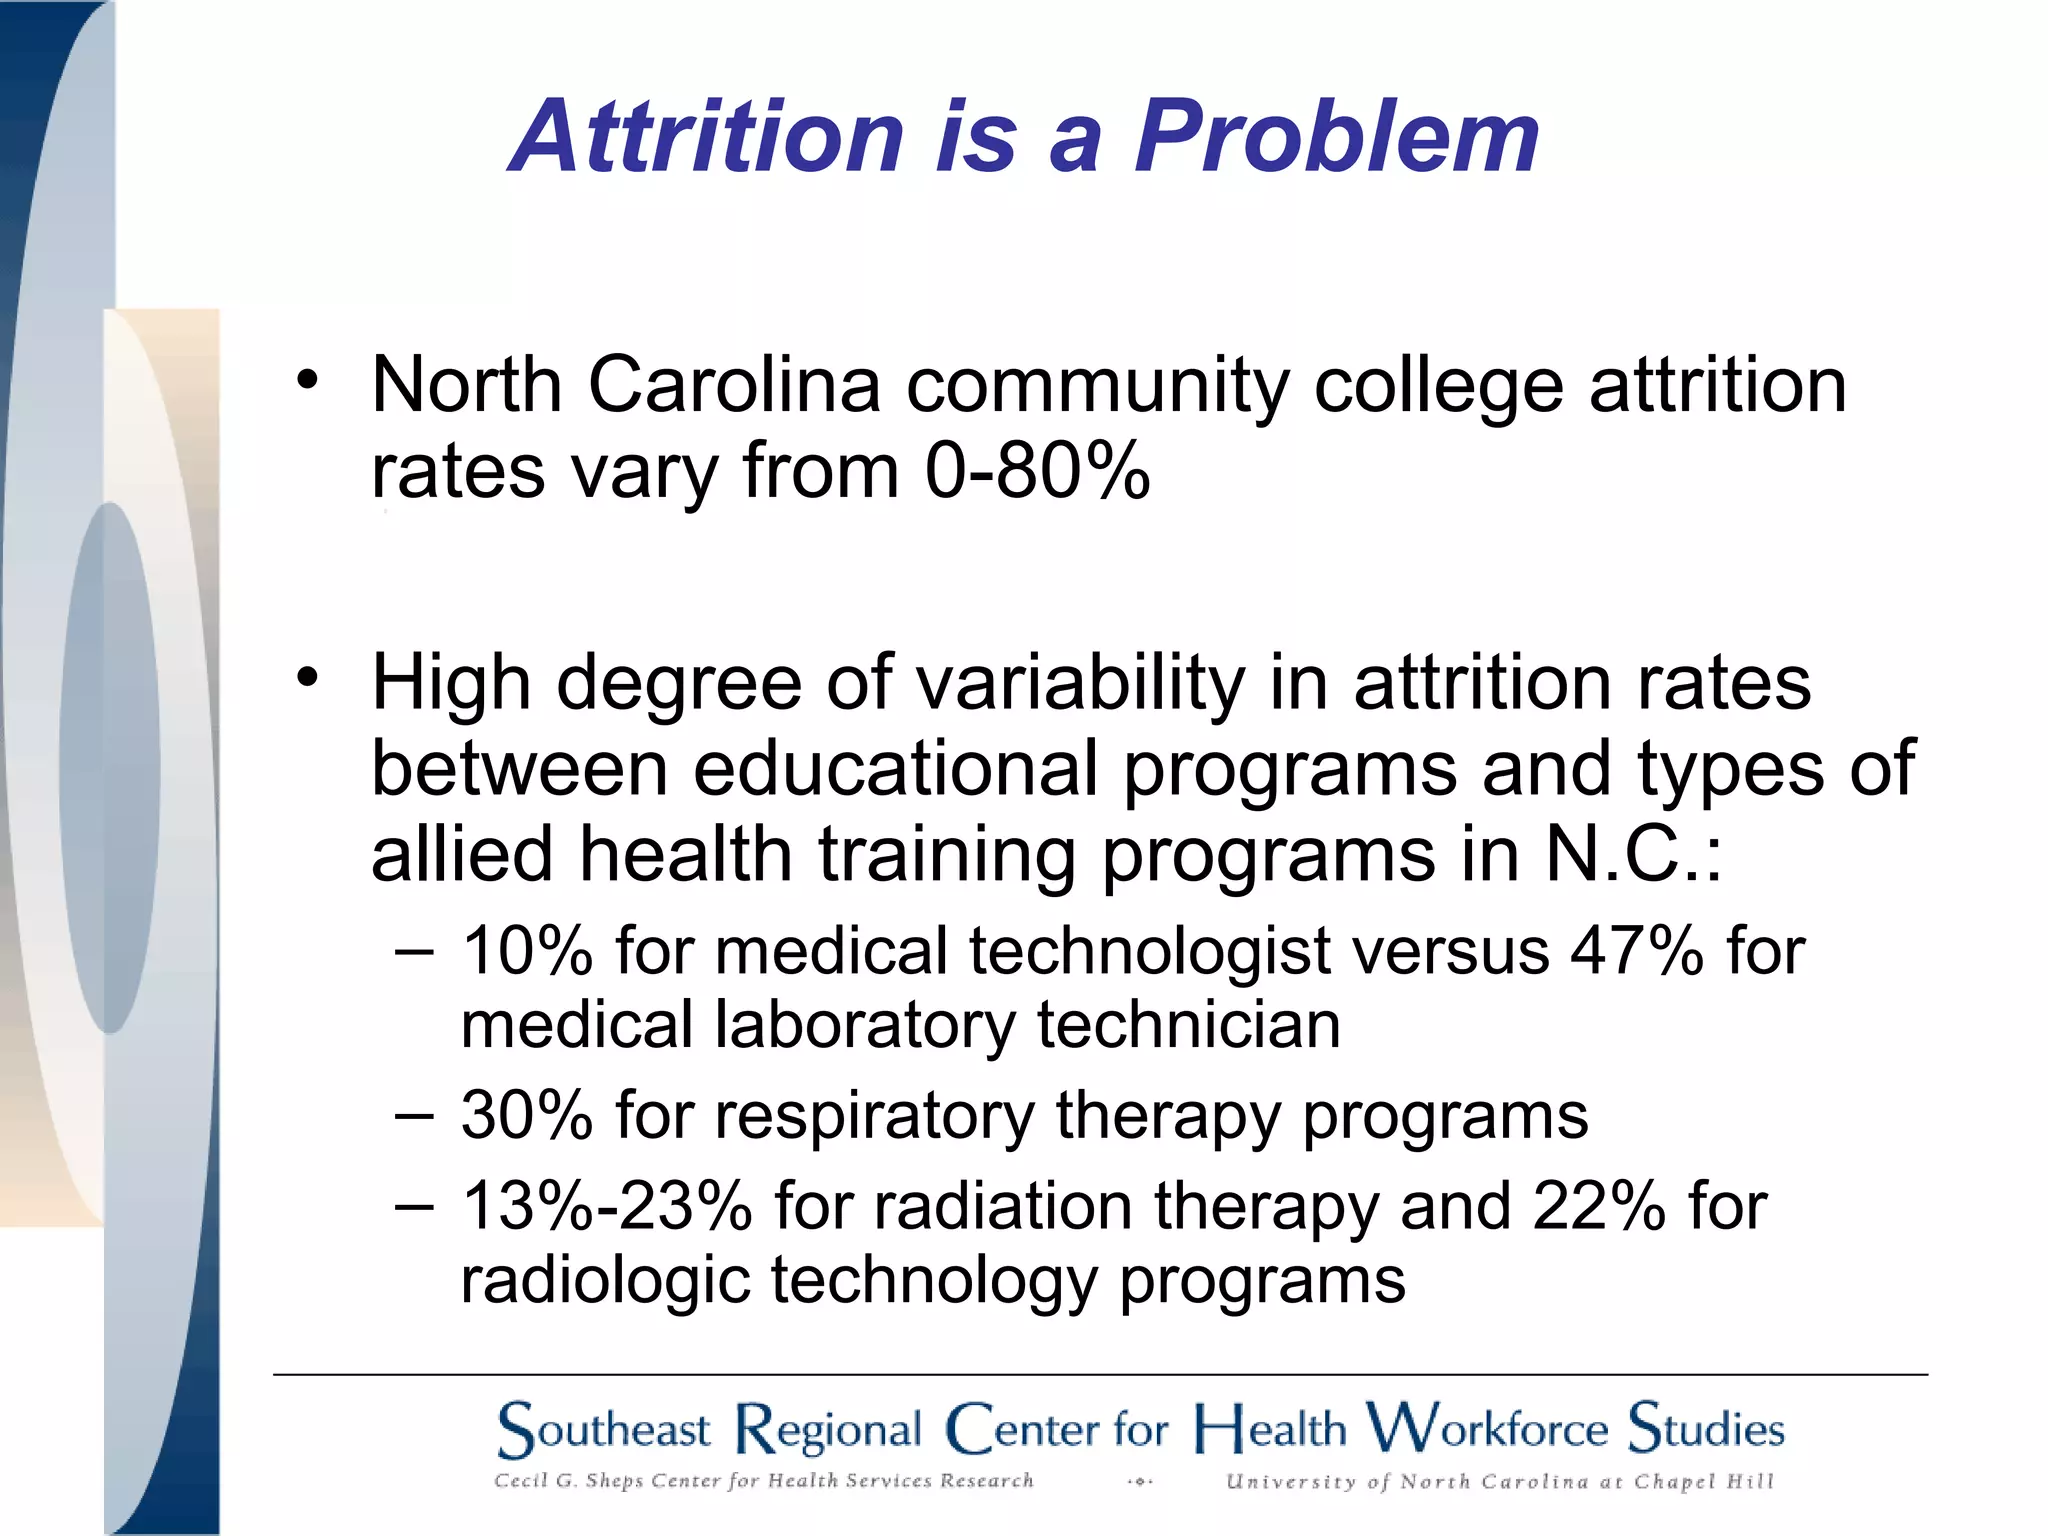
The State of Allied Health:
An Overview of Issues and Opportunities
Facing the Allied Health Workforce
Erin P. Fraher, MPP
Aaron McKethan
Katie Gaul, MA
Association of Schools of Allied Health
Professions
October 20, 2005
The State of Allied Health
• Purpose is to provide an
overview of issues and
opportunities for the allied
health workforce
– Why should policy makers
care about the allied
health workforce?
– What do we know about
workforce challenges?
– What opportunities exist
for future growth and
collaboration?
Report summarizes 6 years of
workforce studies that have
been a collaborative effort of:
Council for Allied Health
in North Carolina
Why Should Policy
Makers Care About
the Allied Health
Workforce?
Economic Restructuring Underway
• Major decline in manufacturing employment
due to:
– International competition
– Increased use of technology and improved
productivity in domestic manufacturing
sector
– Recent economic recession
But…
• Growth in service occupations, including health
care
Manufacturing and Health Care & Social
Assistance Employment, N.C., 1990-2004
0
100
200
300
400
500
600
700
800
900
1990 1991 1992 1993 1994 1995 1996 1997 1998 1999 2000 2001 2002 2003 2004
Employment(000s)
Manufacturing
Health Care and Social Assistance
Healthcare and Allied Health Jobs
Grew While Overall Employment
Contracted
Total State, Healthcare and Allied Health Employment,
North Carolina, 1999-2004
Source: Bureau of Labor Statistics. Occupational Employment Statistics. State
Cross-Industry Estimates: 1998-2003. URL: http://www.bls.gov/oes/. Accessed 4/26/05.
1999 2004
% Growth
(1999-2003)
Total N.C.
Employment
3,801,670 3,722,700 -2.1%
Healthcare
Jobs
251,550 294,870 14.3%
Allied Health
Jobs
76,590 121,300 19.9%
Allied health driving growth in
the larger health care sector
• Over 42% of total job growth in the health
care sector between 1999-2003 was due to
growth of allied health jobs.
• Between 1999-2003, job growth in allied
health outpaced growth in:
– NC’s total workforce by 22.4%
– broader health care sector by 5.5%
Health Care Jobs in North Carolina, 2003
Total Health
Care Jobs =
267,170
Nurse aides, orderlies
and attendants 26.5%
Allied Health
Professions
35.2%
Physicians 3.2%
RNs 25.3%
LPNs 6.5%
Other 3.4%
Hourly and Annual Wages for Selected
North Carolina Occupations, 2003
Occupation
Hourly Mean
Wage
Annual Mean
Wage
Physicians $73.55 $152,978
RNs $23.50 $48,870
LPNs $15.84 $32,940
Nursing aides, orderlies, and
attendants
$9.00 $18,716
Allied health professions $17.03 $35,428
Other healthcare occupations $48.39 $100,640
All Occupations (North Carolina) $16.17 $33,630
Source: U.S. Bureau of Labor Statistics, Occupational Employment Statistics (2003).
URL: http://www.bls.gov/oes/. Accessed 4/26/05.
Allied health jobs projected to grow
• Allied health jobs represent a stable and
relatively profitable employment sector
– Relatively less vulnerable to international competition
– More resilient to economic recession
– Not as susceptible to outsourcing trends seen in
manufacturing and other sectors
• Allied health projected to add 28,570 jobs
between 2000 and 2010—a 36% increase
over 2000 employment.
Now that we have policy
makers’ attention….
what do we tell them?
Policymakers Want to Know:
• How many allied health professionals are
practicing?
• Are we producing too many, too few or the
right number of professionals?
• Are the types and locations of educational
programs appropriate?
• How will new technologies change the
demand for certain skills within the allied
health professions?
• Are changes in licensure/certification
requirements, scope of practice regulations
or practice acts needed?
Speech-Language
Pathology
2001
Health Information
Management
2002
Physical
Therapy
2000
Allied Health Workforce Studies
• Completed 6 workforce studies
Clinical Lab
Sciences
2004
Radiological
Sciences
2003
Respiratory
Care
2004
Allied Health Workforce Studies
• Completed 6 workforce studies
Allied Health Workforce Studies
What have we learned?
Allied Health
Vacancy Report
2005 Reports
State of Allied
Health Brief
Persistent Rural/Urban Disparities
Emergency Medical Techs & Paramedics 2.65
Occupational Therapy Assistants 2.74
Physical Therapy Assistants/Aides 3.20
Radiologic Therapists 3.59
Diagnostic Technicians 3.76
Medical Records Technicians 3.82
Respiratory Therapists 4.01
Speech-Language Pathologists 4.44
Recreational Therapists 4.48
Physical Therapists 4.98
Clinic Lab Technicians 5.13
Massage Therapists 5.34
Occupational Therapists 5.59
Audiologists 5.91
Source: Area Resource File (ARF) 2004 Release (National Center for Health Workforce Analysis, Bureau of
Health Professions, HRSA, DHHS)
Ratio of Providers in Metropolitan to Non-Metropolitan Counties,
United States, 2000
Most
evenly
distributed
Least
evenly
distributed
Allied health workers cluster near training
institutions. Retention of students is high
Percent of Students Remaining Instate After Graduating from a
North Carolina Educational Program,
Select Allied Health Professions, 2000-2004
Health Information Technology 86%
Radiologic Technology/Medical Imaging 84%
Health Information Administration 77%
Radiation Therapy 76%
Physical Therapist Assistant 75%
Nuclear Medicine Technology 75%
Speech-Language Pathology 69%
Physical Therapy 54%
Source: Allied Health Workforce Reports
Programs with Fewer than Half Slots Filled
Health Information Management, Rehabilitation Counseling
Programs under 90% Capacity
Cytotechnology, Speech-Language Pathology/Audiology, Medical
Technology, Occupational Therapy, Respiratory Therapist,
Dental Hygiene, Nuclear Medicine Technology, Diagnostic
Medical Sonography, Physical Therapy
Programs at or above Capacity
Physician Assistant, Respiratory Therapy Technician,
Radiography, Radiation Therapy Technology, Dietetics
2004 ASAHP Survey Highlights
Application and Enrollment Issues
Attrition is a Problem
• North Carolina community college attrition
rates vary from 0-80%
• High degree of variability in attrition rates
between educational programs and types of
allied health training programs in N.C.:
– 10% for medical technologist versus 47% for
medical laboratory technician
– 30% for respiratory therapy programs
– 13%-23% for radiation therapy and 22% for
radiologic technology programs
Faculty Recruitment and Retention Issues
• Faculty salaries cannot compete with clinical salaries
• Increasing accreditation standards require faculty to
have advanced degree. Some faculty prefer to return to
clinical practice or retire.
• Faculty shortages constrict future supply by reducing
number of individuals able to teach courses and
supervise clinical placements:
– Almost two-thirds of respiratory programs and one-
third of medical laboratory programs couldn’t find
enough individuals to supervise clinical rotations
– Nearly half of respiratory therapy programs and one-
third of medical technologist programs couldn’t find
enough faculty to teach coursework.
Clinical Placements
• Lack of clinical sites is chief complaint of some
educational institutions but…
• Not all sites are being used….better
communication needed between educational
institutions and employers.
• Clinical education is expensive. National: average
cost to student of in-state two-year associate
degree in allied health = $5,000, average cost to
community college = $35,000 (AMA).
• North Carolina State Board of Community Colleges
has asked legislature (H.B. 573) to declare allied
health programs high cost.
What Do We Tell Policymakers?
• Allied health workforce important to local, state
and national economy
• Investments in the allied health workforce pay
large and immediate dividends due to high
retention rates
• Investments needed because allied health
educational programs face serious challenges:
– Too few applicants
– Too few qualified applicants
– Attrition
– Faculty shortages
– Lack of clinical placements
Current Allied Health Supply Cycle
time
supply
Allied health professions
Ideal intervention point
Typical intervention point
Ideal Allied Health Supply Cycle
time
supply
Allied health professions
Typical intervention point
Ideal intervention point
How can you improve allied
health workforce planning in
your state, province, country?
Lesson 1. Improve Data Collection
and Workforce Surveillance
• No data, no way to frame argument for allied
health
• Educational institutions and professional
associations need to collect more and better data
• Workforce data need to be put in context of current
budget shortfalls and framed in an economic
context
• Data need to be disseminated to:
– Legislators
– University and community college systems to
assist in educational program planning efforts
and initiatives
– AHECs and Regional Workforce Planning
Groups to be used in collaborative workforce
planning initiatives involving educators,
employers, local workforce development boards
Lesson 2. Data Need to Be Framed in
Economic Context and Disseminated
Need infrastructure to organize workforce analyses and
make policy recommendations. N.C. Council for Allied
Health:
• Receives funding and commissions our studies
• Forms organizational umbrella under which allied
health professions unify
• Uses data to identify and address local/regional/state
workforce shortages
• Develops, nurtures, and sustains solid partnerships
with employers, practitioners and educators
• Goal: Smooth cycle of shortage and over supply
and ensure access to a well-trained and well-
distributed allied health workforce
Lesson 3. Better Allied Health Workforce
Planning Infrastructure Needed
Erin P. Fraher
Director, NC HPDS
Investigator, Southeast Center for
Health Workforce Studies
Cecil G. Sheps Center for Health Services Research
University of NC, Chapel Hill
919-966-5012
erin_fraher@unc.edu
Questions?
PowerPoint Presentation

PowerPoint Presentation

  • 1.
    The State ofAllied Health: An Overview of Issues and Opportunities Facing the Allied Health Workforce Erin P. Fraher, MPP Aaron McKethan Katie Gaul, MA Association of Schools of Allied Health Professions October 20, 2005
  • 2.
    The State ofAllied Health • Purpose is to provide an overview of issues and opportunities for the allied health workforce – Why should policy makers care about the allied health workforce? – What do we know about workforce challenges? – What opportunities exist for future growth and collaboration? Report summarizes 6 years of workforce studies that have been a collaborative effort of: Council for Allied Health in North Carolina
  • 3.
    Why Should Policy MakersCare About the Allied Health Workforce?
  • 4.
    Economic Restructuring Underway •Major decline in manufacturing employment due to: – International competition – Increased use of technology and improved productivity in domestic manufacturing sector – Recent economic recession But… • Growth in service occupations, including health care
  • 5.
    Manufacturing and HealthCare & Social Assistance Employment, N.C., 1990-2004 0 100 200 300 400 500 600 700 800 900 1990 1991 1992 1993 1994 1995 1996 1997 1998 1999 2000 2001 2002 2003 2004 Employment(000s) Manufacturing Health Care and Social Assistance
  • 6.
    Healthcare and AlliedHealth Jobs Grew While Overall Employment Contracted Total State, Healthcare and Allied Health Employment, North Carolina, 1999-2004 Source: Bureau of Labor Statistics. Occupational Employment Statistics. State Cross-Industry Estimates: 1998-2003. URL: http://www.bls.gov/oes/. Accessed 4/26/05. 1999 2004 % Growth (1999-2003) Total N.C. Employment 3,801,670 3,722,700 -2.1% Healthcare Jobs 251,550 294,870 14.3% Allied Health Jobs 76,590 121,300 19.9%
  • 7.
    Allied health drivinggrowth in the larger health care sector • Over 42% of total job growth in the health care sector between 1999-2003 was due to growth of allied health jobs. • Between 1999-2003, job growth in allied health outpaced growth in: – NC’s total workforce by 22.4% – broader health care sector by 5.5%
  • 8.
    Health Care Jobsin North Carolina, 2003 Total Health Care Jobs = 267,170 Nurse aides, orderlies and attendants 26.5% Allied Health Professions 35.2% Physicians 3.2% RNs 25.3% LPNs 6.5% Other 3.4%
  • 9.
    Hourly and AnnualWages for Selected North Carolina Occupations, 2003 Occupation Hourly Mean Wage Annual Mean Wage Physicians $73.55 $152,978 RNs $23.50 $48,870 LPNs $15.84 $32,940 Nursing aides, orderlies, and attendants $9.00 $18,716 Allied health professions $17.03 $35,428 Other healthcare occupations $48.39 $100,640 All Occupations (North Carolina) $16.17 $33,630 Source: U.S. Bureau of Labor Statistics, Occupational Employment Statistics (2003). URL: http://www.bls.gov/oes/. Accessed 4/26/05.
  • 10.
    Allied health jobsprojected to grow • Allied health jobs represent a stable and relatively profitable employment sector – Relatively less vulnerable to international competition – More resilient to economic recession – Not as susceptible to outsourcing trends seen in manufacturing and other sectors • Allied health projected to add 28,570 jobs between 2000 and 2010—a 36% increase over 2000 employment.
  • 11.
    Now that wehave policy makers’ attention…. what do we tell them?
  • 12.
    Policymakers Want toKnow: • How many allied health professionals are practicing? • Are we producing too many, too few or the right number of professionals? • Are the types and locations of educational programs appropriate? • How will new technologies change the demand for certain skills within the allied health professions? • Are changes in licensure/certification requirements, scope of practice regulations or practice acts needed?
  • 13.
  • 14.
  • 15.
    Allied Health WorkforceStudies What have we learned? Allied Health Vacancy Report 2005 Reports State of Allied Health Brief
  • 16.
    Persistent Rural/Urban Disparities EmergencyMedical Techs & Paramedics 2.65 Occupational Therapy Assistants 2.74 Physical Therapy Assistants/Aides 3.20 Radiologic Therapists 3.59 Diagnostic Technicians 3.76 Medical Records Technicians 3.82 Respiratory Therapists 4.01 Speech-Language Pathologists 4.44 Recreational Therapists 4.48 Physical Therapists 4.98 Clinic Lab Technicians 5.13 Massage Therapists 5.34 Occupational Therapists 5.59 Audiologists 5.91 Source: Area Resource File (ARF) 2004 Release (National Center for Health Workforce Analysis, Bureau of Health Professions, HRSA, DHHS) Ratio of Providers in Metropolitan to Non-Metropolitan Counties, United States, 2000 Most evenly distributed Least evenly distributed
  • 17.
    Allied health workerscluster near training institutions. Retention of students is high Percent of Students Remaining Instate After Graduating from a North Carolina Educational Program, Select Allied Health Professions, 2000-2004 Health Information Technology 86% Radiologic Technology/Medical Imaging 84% Health Information Administration 77% Radiation Therapy 76% Physical Therapist Assistant 75% Nuclear Medicine Technology 75% Speech-Language Pathology 69% Physical Therapy 54% Source: Allied Health Workforce Reports
  • 18.
    Programs with Fewerthan Half Slots Filled Health Information Management, Rehabilitation Counseling Programs under 90% Capacity Cytotechnology, Speech-Language Pathology/Audiology, Medical Technology, Occupational Therapy, Respiratory Therapist, Dental Hygiene, Nuclear Medicine Technology, Diagnostic Medical Sonography, Physical Therapy Programs at or above Capacity Physician Assistant, Respiratory Therapy Technician, Radiography, Radiation Therapy Technology, Dietetics 2004 ASAHP Survey Highlights Application and Enrollment Issues
  • 19.
    Attrition is aProblem • North Carolina community college attrition rates vary from 0-80% • High degree of variability in attrition rates between educational programs and types of allied health training programs in N.C.: – 10% for medical technologist versus 47% for medical laboratory technician – 30% for respiratory therapy programs – 13%-23% for radiation therapy and 22% for radiologic technology programs
  • 20.
    Faculty Recruitment andRetention Issues • Faculty salaries cannot compete with clinical salaries • Increasing accreditation standards require faculty to have advanced degree. Some faculty prefer to return to clinical practice or retire. • Faculty shortages constrict future supply by reducing number of individuals able to teach courses and supervise clinical placements: – Almost two-thirds of respiratory programs and one- third of medical laboratory programs couldn’t find enough individuals to supervise clinical rotations – Nearly half of respiratory therapy programs and one- third of medical technologist programs couldn’t find enough faculty to teach coursework.
  • 21.
    Clinical Placements • Lackof clinical sites is chief complaint of some educational institutions but… • Not all sites are being used….better communication needed between educational institutions and employers. • Clinical education is expensive. National: average cost to student of in-state two-year associate degree in allied health = $5,000, average cost to community college = $35,000 (AMA). • North Carolina State Board of Community Colleges has asked legislature (H.B. 573) to declare allied health programs high cost.
  • 22.
    What Do WeTell Policymakers? • Allied health workforce important to local, state and national economy • Investments in the allied health workforce pay large and immediate dividends due to high retention rates • Investments needed because allied health educational programs face serious challenges: – Too few applicants – Too few qualified applicants – Attrition – Faculty shortages – Lack of clinical placements
  • 23.
    Current Allied HealthSupply Cycle time supply Allied health professions Ideal intervention point Typical intervention point
  • 24.
    Ideal Allied HealthSupply Cycle time supply Allied health professions Typical intervention point Ideal intervention point
  • 25.
    How can youimprove allied health workforce planning in your state, province, country?
  • 26.
    Lesson 1. ImproveData Collection and Workforce Surveillance • No data, no way to frame argument for allied health • Educational institutions and professional associations need to collect more and better data
  • 27.
    • Workforce dataneed to be put in context of current budget shortfalls and framed in an economic context • Data need to be disseminated to: – Legislators – University and community college systems to assist in educational program planning efforts and initiatives – AHECs and Regional Workforce Planning Groups to be used in collaborative workforce planning initiatives involving educators, employers, local workforce development boards Lesson 2. Data Need to Be Framed in Economic Context and Disseminated
  • 28.
    Need infrastructure toorganize workforce analyses and make policy recommendations. N.C. Council for Allied Health: • Receives funding and commissions our studies • Forms organizational umbrella under which allied health professions unify • Uses data to identify and address local/regional/state workforce shortages • Develops, nurtures, and sustains solid partnerships with employers, practitioners and educators • Goal: Smooth cycle of shortage and over supply and ensure access to a well-trained and well- distributed allied health workforce Lesson 3. Better Allied Health Workforce Planning Infrastructure Needed
  • 29.
    Erin P. Fraher Director,NC HPDS Investigator, Southeast Center for Health Workforce Studies Cecil G. Sheps Center for Health Services Research University of NC, Chapel Hill 919-966-5012 erin_fraher@unc.edu Questions?