
Uploaded byUWGlobalHealth
Christina Arredondo
The document summarizes a health needs assessment conducted in rural communities in Chiapas, Mexico. It provides demographic data showing that most residents are young, have low levels of education, work in farming or as homemakers, and have low incomes. It also reports on residents' self-reported health issues and living conditions. The study aimed to identify health, economic, and social needs to help guide a new healthcare project in the region. Local promoters were trained to administer surveys to gather data on residents' demographics, symptoms, nutrition, living standards, and physical measurements.
More Related Content


Similar to Christina Arredondo


Christina Arredondo
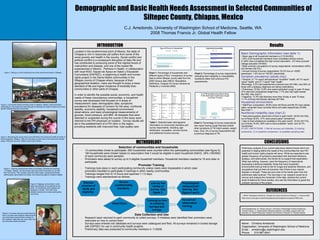
- 1. Name: ChristinaArredondo Organization: University of Washington School of Medicine Email: arredonc@u.washington.edu Phone: 510-967-6041 Demographic and Basic Health Needs Assessment in Selected Communities of Siltepec County, Chiapas, Mexico C.J. Arredondo, University of Washington School of Medicine, Seattle, WA 2008 Thomas Francis Jr. Global Health Fellow Basic Demographic information (see table 1): Mean age of all household members is 21.9 (N=553). 54% of all household members have completed primary school, 21.68% have completed the high school equivalent, .2% have pursued college education (N=553). Most common occupations of survey respondents: homemakers (48%) and farmers (52.3%). Annual Income of survey respondents: 53.2% live on <5000 pesos/year, 1.9% live on >50,001 pesos/year. Symptom prevalence (adults only): General: 21.1% report self-perceived “excellent” health, 48.1% report “good” health, and 21.7 report “bad” health. Neurology: 2.5% had experienced a seizure ever (N=196); only 60% of those with a epilepsy diagnosis are taking medications. Pulmonary: Of the 13.8% who report persistent cough in past 15 days, 37% also had unexplained weight loss, 7.7% also had night sweats (N=196). See chart 3. Digestive: 13.3% had diarrhea more than 3x/day in past 15 days, 11.1% of those had bloody diarrhea (N=196). Household environment: Wall/Floor composition: 29.8% have dirt floors and 66.3% have adobe walls; remainder have concrete floors and walls respectively (N=99). See chart 1. Nutritional instability (see chart 2): Had preoccupation about lack of food in past month: 30.9% (N=184), out of those 30.9%, 51% were preoccupied “sometimes”. Had no food whatsoever available in the past month: 16.5% (N=170), out of those 16.5%, 65% had no food available “rarely” and 34.7% “sometimes”. STUDY LIMITATIONS: 1) Not all surveys yet collected, 2) training constraints, 3) no baseline comparison, 4) possible sampling bias . Selection of communities and households 13 communities chose to participate. 650 households were counted within the participating communities (see figure 5). 180 households were chosen based on assumption that 3 would be eligible in each household (540/3). 28% (180/650) of each community were sampled. Promoters were asked to survey up to 5 eligible household members. Household members needed to 16 and older to participate. Promoter Training Trainings took place in each participating community unless roads were impassable in which case promoters travelled to participate in trainings in other nearby communities. - Trainings ranged from 8-12 hours and spanned 1-1.5 days. Trainings were standardized as follows: Data Collection and Use Research team returned to each community to collect surveys. If mistakes were identified then promoters were instructed on how to correct them. Surveys were entered into database and surveys were catalogued and filed. All surveys remained in locked storage with EAPSEC for use in community health projects. Preliminary data was presented to community members in 11/2008. Preliminary analysis of our current data show distinct trends which are essential in helping define the needs of the communities the new PIH health and human rights projects will serve. While we expected to see greater frequency of symptoms associated with diarrheal infections, epilepsy, and tuberculosis, the trends do no support that expectation. What was striking, however, were the frequency of respondents expressing nutritional instability, those that have household environments that put that at risk for fungal and bacterial infections, and occupations that put them at economic risk if there is any natural disaster or drought. These are just a few of the trends seen from the preliminary data received. The next step in our research would be to recover and analyze the remainder of the data, address the current study limitations for future studies, and use the information to guide the outreach services of the project. Located in the southernmost point of Mexico, the state of Chiapas is rich in resources yet suffers from some of the worst poverty and health in the country. Social conflict and political conflict is a consequent disruption of daily life and has contributed to producing some of the highest levels of malnutrition and disease, and one of the lowest life expectancies in Mexico. Partners in Health, in collaboration with local NGO, Equipo de Apoyo en Salúd y Educación Comunitaria (EAPSEC), is beginning a health and human rights project in the Sierra Madre communities in the Siltepec county of Chiapas where, because of their geographical isolation, many are thought to enjoy a lower standard of life and higher incidence of morbidity than communities in other parts of Chiapas. In order to identify the possible social, economic, and health needs of these mountainous communities, a household survey was developed that focused on 6 areas of measurement: basic demographic data, symptoms prevalence for diseases of concern for the area, nutritional stability, economic stability, household environment observations, and basic physiological measurements of glucose, blood pressure, and BMI. All diseases that were detected or suspected during the course of the study were referred to the PIH physician on location. Survey results will aid in the establishment of a PIH clinic in the region, providing residents with improved free, high-quality care. INTRODUCTION METHODOLOGY 1. INEGI: Resultados Definitivos, Chiapas XII Censo General de Población y Vivienda 2000 . (http://www.e-local.gob.mx/work/templates/enciclo/chiapas/municipios/07080a.htm) . CONCLUSIONS Results REFERENCES Table 1. Selected basic demographic information on community members and survey respondents, including; age distribution, occupation, annual income, and additional income sources. Chart 3. Percentage of survey respondents who report having cough that also exhibit other symptoms of TB (night sweats, weight loss). Only .5% of survey respondents had a previous diagnosis of TB. Chart 1. Percentage of households with different types of floor. Comparison of survey data to entire Siltepec county data from the 2000 Census data ( INEGI: Resultados Definitivos, Chiapas XII Censo General de Población y Vivienda 2000) . Chart 2. Percentage of survey respondents indicating food instability or unavailability. Questions taken from previous PIH assessments. Figure 2. Community health promoters meet in Galeana, Siltepec. Most promoters participating in the project are male although all attempts are made to have one of each gender representing each community. Figure 1. Sitting on a cliff overlooking one of the small communities in Siltepec. Figure 3. Reviewing the survey line by line with Rene, the community health promoter in Nueva Argentina, Siltepec. Often the only place to work was in the community worship space. Wherever we went, children were sure to follow. Figure 4. Teaching measurement skills to promoters, Domitila and Jeremias, in Capitan, Siltepec. All instruments used were left for promoters to use with their community. This included: adult and infant scales, sphygmomanometer, stethoscopes, glucometers and strips, and measuring tapes to measure heights. Figure 5. Mapping communities in order begin the selection of households for the study. All households were mapped and assigned a number. Then 28% were selected randomly from each participating community. Figure 6. Promoter training included learning how to correctly take physical measurements and what those measurements indicate for their patients. Skills they can use in their role as community health promoters. Discuss purpose of study and eligibility. Review confidentiality standards. Line by line review of survey. See figure 3. Physiological measurement training. See figure 4 and 6. Household observation training. Training on how to collating surveys and storage. PRACTICE!! Acknowledgements: Dr. Wendy Johnson, University of Washington School of Medicine; Thomas Francis, Jr. Global Health Fellowship selection committee, support staff, and sponsers; Dr. Daniel Palazuelos, Brigham and Woman’s Hospital; Dr. Rodrigo Zepeda. Age distribution of ALL household members Occupation of survey respondants % Receiving money from US or other parts of Mexico Annual income from all sources (pesos) Total Respondents 538 Homemaker 48.1% Total 15.8% 0-5000 53.2% Mean 21.9 Farmer 52.3% Mexico 16.7% 5001-10,000 15.6% Std. Dev. 18.0 Construction .5% US 79.1% 10,0001-20,000 18.2% Minimum 3 m Student 3.7% Both 4.2% 20,0001-30,000 5.8% Maximum 88 Total Respondents 201 30,001-50,000 4.5% Range 88.9 >50,0001 1.9%