Downloaded 22 times
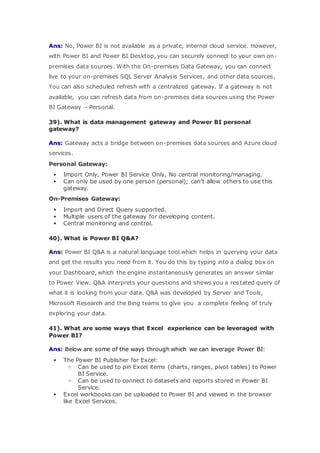
![their data through live dashboards and interactive reports that have been pre-built for them. Microsoft has
released content packs for popular services such as Salesforce.com, Marketo, Adobe Analytics, Azure
Mobile Engagement, CircuitID, comScore Digital Analytix, Quickbooks Online, SQL Sentry and tyGraph.
Organizational content packs provide users, BI professionals, and system integrator the tools to build their
own content packs to share purpose-built dashboards, reports, and datasets within their organization.
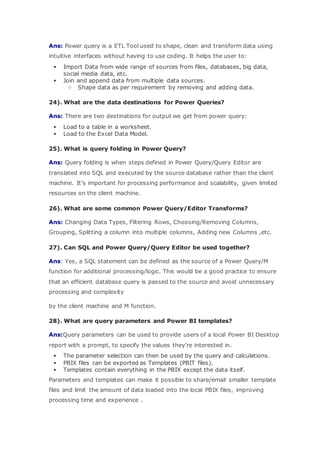
Power BI Interview Questions – DAX
9). What is DAX?
Ans: To do basic calculation and data analysis on data in power pivot, we use Data Analysis Expression
(DAX). It is formula language used to compute calculated column and calculated field.
DAX works on column values.
DAX cannot modify or insert data.
We can create calculated column and measures with DAX but we cannot calculate rows using DAX.
Sample DAX formula syntax:
For the measure named Total Sales, calculate (=) the SUM of values in the [SalesAmount] column in the
Sales table.
A- Measure Name
B- = – indicate beginning of formula
C- DAX Function
D- Parenthesis for Sum Function
E- Referenced Table
F- Referenced column name
10). What are the most common DAX Functions used?
Ans: Below are some of the most commonly used DAX function:
SUM, MIN, MAX, AVG, COUNTROWS, DISTINCTCOUNT
IF, AND, OR, SWITCH
ISBLANK, ISFILTERED, ISCROSSFILTERED
VALUES, ALL, FILTER, CALCULATE,](https://image.slidesharecdn.com/powerbi-181106130017/85/Power-BI-Interview-Questions-3-320.jpg)
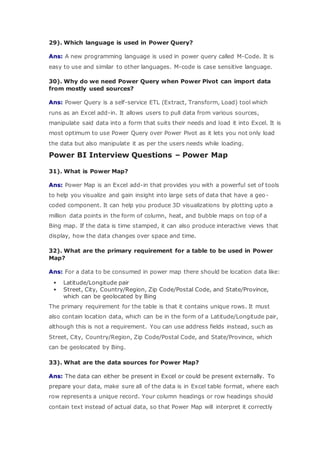
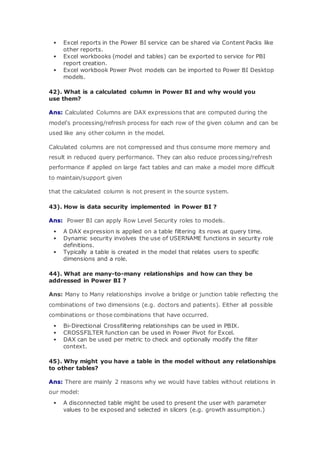
![ UNION, INTERSECT, EXCEPT, NATURALINNERJOIN, NATURALLEFTEROUTERJOIN,
SUMMARIZECOLUMNS, ISEMPTY,
VAR (Variables)
GEOMEAN, MEDIAN, DATEDIFF
11). How is the FILTER function used?
Ans: The FILTER function returns a table with a filter condition applied for each of its source table rows.
The FILTER function is rarely used in isolation, it’s generally used as a parameter to other functions such
as CALCULATE.
FILTER is an iterator and thus can negatively impact performance over large source tables.
Complex filtering logic can be applied such as referencing a measure in a filter expression.
o FILTER(MyTable,[SalesMetric] > 500)
12). What is special or unique about the CALCULATE and CALCULATETABLE functions?
Ans: These are the only functions that allow you modify filter context of measures or tables.
Add to existing filter context of queries.
Override filter context from queries.
Remove existing filter context from queries.
Limitations:
Filter parameters can only operate on a single column at a time.
Filter parameters cannot reference a metric.
13). What is the common table function for grouping data?
Ans: SUMMARIZE()
Main groupby function in SSAS.
Recommended practice is to specify table and group by columns but not metrics.You can use
ADDCOLUMNS function.
SUMMARIZECOLUMNS
New group by function for SSAS and Power BI Desktop; more efficient.
Specify group by columns, table, and expressions.
14). What are some benefits of using Variables in DAX ?
Ans: Below are some of the benefits:
By declaring and evaluating a variable, the variable can be reused multiple times in a DAX
expression, thus avoiding additional queries of the source database.
Variables can make DAX expressions more intuitive/logical to interpret.
Variables are only scoped to their measure or query, they cannot be shared among measures,
queries or be defined at the model level.
15). How would you create trailing X month metrics via DAX against a non-standard calendar?
Ans: The solution will involve:
CALCULATE function to control (take over) filter context of measures.
ALL to remove existing filters on the date dimension.
FILTER to identify which rows of the date dimension to use.
Alternatively, CONTAINS may be used:
CALCULATE(FILTER(ALL(‘DATE’),…….))](https://image.slidesharecdn.com/powerbi-181106130017/85/Power-BI-Interview-Questions-4-320.jpg)

Self-service business intelligence (SSBI) allows business users to analyze and visualize data without extensive technical skills. Microsoft's SSBI solution has two parts - Excel BI Toolkit for creating interactive reports, and Power BI for sharing reports online. Power BI is a cloud-based environment for sharing insights. It can connect to various data sources and features include sharing presentations, updating from data sources, and displaying on multiple devices. Power BI Desktop is a free application for advanced data exploration, modeling, and creating visualizations that can then be published to the Power BI service. [/SUMMARY]