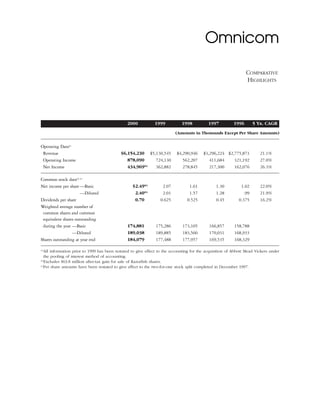
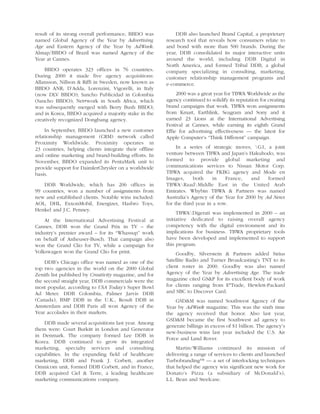
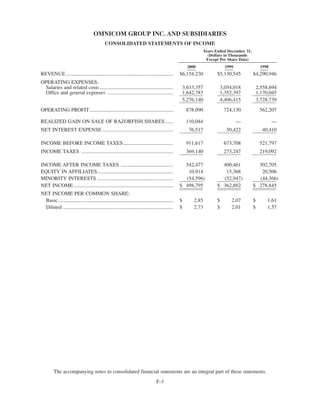
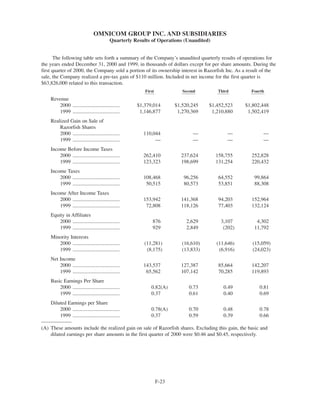
This document is Omnicom's annual report for the year 2000. It summarizes Omnicom's financial and operating highlights for 2000, with revenue reaching $6.2 billion, a 20% increase from 1999. It also discusses the performance of Omnicom's major advertising and marketing agency brands such as BBDO Worldwide, DDB Worldwide, and TBWA Worldwide. The report provides an overview of the company's financial results and growth in revenue, income, and earnings per share for 2000.
Omnicom reported its annual financial results for 2004. Key highlights include:
- Revenues increased 13% to a record $9.7 billion from $8.6 billion in 2003. Net income grew 15% to $723.5 million.
- All of Omnicom's marketing services disciplines (media, CRM, specialty communications, PR) contributed to revenue growth.
- Omnicom successfully completed its certification under the Sarbanes-Oxley Act, a significant and costly undertaking.
- The company intends to continue investing in its business and people to drive future growth, including potential acquisitions.
This document is the annual report for Omnicom from 2001. It summarizes the company's financial performance for 2001 and compares it to previous years. Some key points:
- Revenue reached $6.89 billion in 2001, a record high, though growth slowed due to economic challenges including the recession and 9/11 attacks.
- Operating income was $968 million and net income was $503 million in 2001. Earnings per share were $2.75 excluding a one-time gain.
- The company achieved all of its financial goals for 2001 except improving operating margins, due to a slowdown in client spending in many industries.
- Omnicom won a record $4.
This annual report summarizes Procter & Gamble's (P&G's) financial performance and strategic goals for 2001. Net sales declined slightly but core earnings grew. P&G aims to focus on core brands and businesses, improve performance in key markets like the US and Western Europe, and drive growth through innovation. The report highlights how P&G employees and brands help improve people's lives through stories like a dog saved by a specialized diet and a woman who used Olay for decades.
Tele Celular Sul Participações S.A. announced its results for the fourth quarter and full year 2003. Key highlights include:
- Revenues increased 23.5% to R$1.4 billion for the year driven by a 19% rise in customers to over 2 million.
- EBITDA grew 10.1% to R$383 million and net income increased 83.7% to R$120 million, a record level.
- Investments totaled R$213 million, mainly to expand GSM coverage, while still generating a positive cash flow of R$200 million for the year.
This document provides comparative highlights and financial data for Omnicom for 1999 and 1998. It summarizes that worldwide billings increased 19% to $35.7 billion in 1999. Net income increased 30% to $362.9 million and earnings per share increased 29% to $2.07. It also provides an overview of the strong performance of Omnicom's advertising and marketing services brands in 1999.
This document is Omnicom's 2005 annual report. It highlights that in 2005, Omnicom achieved record financial results, new business wins, and awards for creative excellence. Key metrics included a 12% increase in diluted earnings per share to $4.36, a 9% increase in net income to $791 million, and 8% growth in worldwide revenue to $10.5 billion. The report credits Omnicom's investments in creative talent and integrated agency networks for driving momentum and collaboration across its businesses.
Viacom reported its third quarter 2001 results, with pro forma revenues of $5.7 billion and pro forma EBITDA of $1.3 billion. Four of its six operating segments saw revenue increases, led by 19% growth in cable networks and video. Pro forma free cash flow totaled $883 million, equal to 66% of EBITDA. While results were impacted by lower revenues and higher costs from 9/11 events, the company remains on track for a record year with free cash flow approaching $3 billion. Segment results were mixed, with cable networks, video and publishing seeing revenue and EBITDA gains, while television, infinity and entertainment declined from prior year.
The document is P&G's 2000 annual report which summarizes the company's financial and operating performance for the fiscal year.
1) Net sales grew 5% to $39.9 billion while net earnings fell 6% to $3.5 billion due to higher costs from organizational changes and new investments. Core earnings excluding restructuring costs grew 2% to a record $4.2 billion.
2) The CEO acknowledges the year's challenges but expresses confidence that by focusing on big brands, innovation, customer partnerships, and cost control, P&G can restore balanced growth in sales and profits.
3) Looking forward, the new organizational structure aims to leverage P&G's strengths in understanding consumer needs
The document summarizes Ideiasnet's 1Q09 earnings. It saw a 4.5% increase in net revenue but a 60% decrease in EBITDA. The e-commerce segment grew revenues and EBITDA while infrastructure/telecom revenues slightly declined with negatively impacted EBITDA. Media/content grew revenues with negative EBITDA due to investments. The company invested R$7.9 million in its portfolio and saw a decrease in net debt. Overall revenues grew but margins compressed, impacting net income.
The document summarizes key trends in the Asia Pacific outsourcing market in 2011 based on an analysis of contracts over $25 million. It finds that while contract activity reached record levels, total contract value declined 10% from 2010 due to a rise in smaller deals. Total contract value was pulled down by weaker performance in India and key industries like financial services and manufacturing. However, the Asia Pacific market remains attractive with annualized revenue and active contracts growing at a 4-8% compound annual rate between 2007-2011.
The Walt Disney Company reported sharply higher earnings for the first quarter of fiscal year 2004, ended December 31, 2003. Earnings per share increased to $0.33 from $0.05 in the prior year quarter, driven by growth across all business segments. Revenues increased 19% to $8.5 billion due to strong performance of home entertainment releases from Studios and higher affiliate fees and advertising at Media Networks. The company expects continued earnings growth of over 30% for fiscal year 2004.
Viacom reported record full year 2001 results with a 16% increase in revenues, 28% gain in EBITDA, and 80% increase in free cash flow. For the fourth quarter, pro forma EBITDA increased 15% in Cable Networks and 15% in Video. Viacom expects double-digit pro forma EBITDA growth for full year 2002 if economic conditions remain the same.
Computer Sciences Corporation (CSC) is an information technology services company that saw record revenues and earnings in fiscal year 1997. Some key events included winning $9 billion in new contracts, acquiring companies in the financial services and healthcare industries to expand its capabilities, and forming new vertical market organizations in financial services and healthcare. CSC also is well-positioned to help clients address the upcoming "Year 2000" computer issue. The company's chairman expressed optimism about CSC's prospects given its world-class offerings and talented employees.
Omnicom reported strong financial results for 2007, with revenue increasing 11.6% to $12.7 billion and net income growing 13% to $976 million. Diluted earnings per share rose 18% to $2.95. The company continued to invest in its businesses, adding capabilities and talent to better serve major clients globally. Omnicom agencies received numerous awards for creative excellence. Looking ahead, Omnicom is well positioned with a diversified portfolio to navigate potential economic challenges while continuing to deliver consistent long-term results.
Kohl's Corporation reported on its strong financial performance in fiscal year 2000. Net sales increased 35% to $6.2 billion and net income rose 44% to $372 million. Kohl's opened 61 new stores in 2000, bringing the total to 320 stores across 28 states. The company plans to continue its aggressive nationwide expansion strategy, with plans to open approximately 60 additional stores in 2001. Kohl's also aims to become a national retailer by entering new regions across the country over the next three years, including major markets like Los Angeles and Boston.
P&G's annual report discusses embracing the future through increased innovation and organization vitality. It summarizes the company's fiscal year results, noting earnings growth despite economic challenges. It outlines changes through the Organization 2005 initiative to accelerate growth by restructuring and improving innovation processes. The report emphasizes connecting technologies across business units and unleashing innovation to capitalize on a faster-paced global marketplace.
This document summarizes the financial results of Tele Celular Sul Participações S.A. for the fourth quarter and full year of 2002.
Some key highlights include EBITDA of R$81.6 million in Q4 2002 and R$352.4 million for the full year, with EBITDA margins of 42.1% and 47.1% respectively. Net income was R$17.3 million in Q4 2002 and R$65.8 million for the full year. Total revenues increased 8.6% in Q4 2002 and 8.5% for the full year driven by increased handset and service sales. Cost controls helped offset rising interconnection costs.
The Progressive Corporation reported financial results for February 2005, with net premiums written up 12% and net income down 12% compared to February 2004. Progressive saw growth in both its Personal and Commercial Auto business lines. The combined ratio was 85.2%, an increase of 1.5 percentage points from the prior year. Policies in force increased 12% overall, with growth across all business segments.
Viacom reported record second quarter 2002 results, with revenues increasing 2% to $5.85 billion and operating income rising 5% to $1.18 billion compared to the previous year. Free cash flow increased 22% to $1.03 billion. The company saw increased results in its cable networks, television, and video segments. Viacom expects double-digit growth in earnings per share, operating income, and EBITDA for the full year 2002 based on continued improvement in the advertising market.
- Disney reported improved financial results for its fiscal year ended September 30, 2003 compared to the previous year. Earnings per share increased 8% for the full year and 122% for the fourth quarter.
- Strong performances from Studio Entertainment and Media Networks drove the overall earnings growth, though Parks and Resorts experienced declines in revenue and profits.
- Cash flow from operations increased significantly over the previous year, allowing Disney to reduce its total and net borrowings.
The document discusses Ingram Micro, the world's largest technology distributor. It provides an overview of Ingram Micro's financial performance in 1999, including revenue of $28.1 billion, a 27% increase from 1998. It discusses challenges faced in 1999 from intense pricing competition and rising costs. The CEO discusses strategies to leverage Ingram Micro's global scale and infrastructure to expand outsourcing partnerships and e-commerce operations.
- EPS for Disney increased 27% in the quarter and 15% over the prior six months, driven by growth across all operating segments led by Studio Entertainment.
- Revenues increased 9% in the quarter to $7.8 billion and 5% over six months to $16.5 billion. Segment operating income rose 14% in the quarter and 8% over six months.
- EPS and revenue growth were driven by increases in operating income from Media Networks, Parks and Resorts, Studio Entertainment, and Consumer Products.
Présentation des résultats financiers Ericsson (Q4 2009)Ericsson France
Ericsson a publié ce matin les résultats de l’entreprise pour l’année 2009. Hans Vestberg, nouvellement président-directeur général du groupe depuis le 1er janvier 2010, a commenté les faits saillants au cours d’une conférence de presse en Suède. L’intégralité de ses commentaires est disponible ci-dessous.
Plus d'informations : http://www.blog-ericssonfrance.com/2010/01/le-pdg-du-groupe-ericsson-commente-les-resultats-2009/
- DuPont reported second quarter 2006 earnings of $1.04 per share, up from $1.01 per share in second quarter 2005. Excluding significant items, earnings per share were $1.01, up 12% from $0.90 per share last year.
- Local prices were up 2% while volumes increased 1%, but currency effects reduced sales by 1%, for a total sales increase of 2%.
- The company expects strong earnings growth in the second half of 2006 compared to 2005, and reaffirms its full year 2006 earnings outlook.
Social media gets more engaging with age - Adobe q1 2014 social intelligence ...Mediamaispasque
Social buzz, ads, and content can all be used as a way to reach and monitor individual
consumers. Facebook continues to dominate the social realm, but each social site has a
unique audience and route that can lead to more loyal fans, brand awareness,
and eventual revenue.
2009 Barcamp Nashville Web Security 101brian_dailey
A super-brief (25 minute) talk on the basics of web security. A video (with poor audio that doesn't kick in until 9 minutes in, I'm sorry) is available here:
http://www.ustream.tv/recorded/2369801
The document provides tips for saving money on petrol/gas purchases. It recommends filling up in the early morning when the ground is cold to get the most accurate volume of petrol. It also advises pumping slowly to minimize vapors and shorting at the pump, and to fill up when the tank is half full to reduce air space and evaporation. The final tip is to avoid filling up during delivery to avoid dirt stirred up in the storage tanks. Sharing these tips could help many petrol buyers save money.
This document discusses exploring biological structures and forms as building blocks for novel wearables and applications. It considers how biological geometries like viruses can be deconstructed while maintaining certain elements. Examples of precedents that transform 2D shapes into 3D forms or use biology are provided. The target user is fashion/design enthusiasts. Prototypes could involve physical kits or screen-based interfaces. Challenges include social assumptions, scalability, and interface friendliness. New directions explored are geodesic domes, Delaunay triangulation, and creating movement and juxtaposing rigidity with fluidity in designs.
This document provides an introduction to programming in Go. It discusses the origins and intentions of the Go language, where it is commonly used today, and what Go is and isn't. Go was created to be a systems programming language with better productivity than C++. It has seen widespread adoption beyond its original use cases. While Go isn't a functional or object-oriented language, it is compiled, statically typed, memory managed, concurrent, and ideal for building cloud infrastructure. The document also covers Go syntax including variables, types, loops, conditionals, functions, and more.
This document discusses how media companies and marketers can navigate the multi-platform digital world. It notes that the proliferation of smartphones and tablets has led to media fragmentation as consumers access content across different devices. The document recommends that companies understand their audiences' multi-platform behaviors to optimize content, advertising, and monetization strategies. It provides data showing how top media properties extend their reach significantly through mobile audiences alone. The key is for companies to adopt a unified, customer-centric approach and measure audiences across all platforms.
A Changing Paradigm: Is Your Content Strategy Keeping Up?Laura Blaydon
Technology’s continued evolution is changing customer expectations and needs, offering content strategists new opportunities and challenges in the race to win “share of mind.” To reach this empowered, digitally connected audience, content providers must offer information that’s timely, relevant and integrated into (and across) the products and tools consumers use every day.
Khursheed khawar peshawar night Part-1Ahmed Hashmi
The document discusses the history of chocolate, describing how it originated from cacao beans grown by the Olmecs and Mayans in Mexico and Central America. It then explains how Spanish conquistadors brought cacao back to Europe in the 16th century, where it eventually became popular as a drink among the elite. Over time, chocolate became widely consumed in powder and bar form across Europe and North America.
1) The document discusses Fidelity National Information Services, a leading global payment and core processing services provider. It presents information on FIS's business segments, revenue breakdown, competitive positioning, and technology platform.
2) Key metrics highlighted include $3.47 billion in total revenue, $839 million in adjusted EBITDA, serving over 13,000 financial institutions clients in more than 80 countries.
3) The presentation also reviews FIS's diverse and recurring revenue streams, strong operating leverage and customer service, and execution through organic revenue growth and improving EBITDA margins.
The document discusses the potential for economic and business cooperation between countries in the Americas region. It notes that the President of the Dominican Republic hopes to transition the country's economy from labor-intensive manufacturing to a knowledge-based, technology-driven model through developing a new Cyberpark. The Cyberpark aims to become the technological hub of the Americas within 10-15 years and represent a new paradigm for social and economic development in the Dominican Republic. The document also examines the nearshore outsourcing industry in various countries in the Americas and considerations for companies looking to establish operations in the region.
Paymantix is an innovative developer and provider of e-commerce payment solutions, including payment gateways and processing platforms. It has been in business since 2011 and processes over €190 million in monthly transactions. Paymantix offers customizable payment solutions to banks, fintech startups, online merchants, and other organizations to help increase the effectiveness of their businesses.
How to Structure a Blog Post to Attract Google and Create More LeadsMariana Wagner
How to Structure a Blog Post to Attract Google and Create More Leads - Leverage Your Blogging Efforts to Enhance Your Real Estate Business
www.MarianaWagner.com
The document is a collection of photos from various wedding photography websites and does not contain any accompanying text. It consists solely of photo credits to different photographers and does not provide any other information about the photos.
This document is the annual report for Omnicom from 2001. It provides an overview of the company's financial performance for 2001 compared to previous years, as well as highlights from each of its major advertising agency networks - BBDO Worldwide, DDB Worldwide, and TBWA Worldwide. The report discusses how each agency network expanded its client roster and won various industry awards in 2001 despite challenges from economic slowdown. It also notes some leadership changes that occurred within the company.
Embraer reported strong financial results for the second quarter and first half of 2000. Net income increased 113.1% for the first half compared to 1999, reaching R$210.4 million. Net sales increased 62.3% for the first half, totaling R$2,219.9 million. Embraer delivered 72 aircraft in the first half, a significant increase from 38 in the same period of 1999. The company also reduced its net debt and continued investing in research and development programs as well as industrial capabilities.
Computer Sciences Corporation (CSC) reported financial results for the third quarter of fiscal year 2001, ended December 29, 2000. Revenues increased 12.9% to $2.7 billion due to growth in the federal government vertical market and commercial outsourcing. Earnings before special items increased 9.6% to $122.9 million. Major new business awards totaled $1.8 billion for the quarter. For the nine-month period, revenues increased 12.2% to $7.6 billion and earnings before special items increased 13.1% to $327.9 million, though results were impacted by currency effects and restructuring costs. CSC also discussed several new contracts and engagements.
- Tele Celular Sul Participações S.A. is a holding company for cellular telecom providers in southern Brazil that announced its 4th quarter and full year 2000 results.
- In 2000, it reached 1.416 million subscribers, a 37% increase, with a 75% market share. EBITDA was R$218.7 million for the year, a 28% increase over 1999.
- For 4Q2000 specifically, subscribers grew to 1.416 million, EBITDA was R$67.3 million with a margin of 38%, and net income was R$8.2 million.
- Emerson reported strong financial results for the second quarter of 2008, with sales up 12% and earnings per share up 23% compared to the previous year. Underlying sales growth was 6% led by international growth.
- Operating profit margin improved 100 basis points to 16.4% due to cost containment programs and a $30M commodity hedging benefit. Cash flow also increased significantly.
- The Process Management segment saw sales growth of 19% driven by strong underlying growth of 16% internationally, while the Industrial Automation segment grew sales 11%.
- Emerson's balance sheet remains strong, allowing flexibility for investments and shareholder returns.
Press Release 1 Q00 Tele Nordeste Celular EnTIM RI
Tele Nordeste Celular Participações S.A. announced its first quarter 2000 results. Key highlights include:
- The company added 125,340 new customers, reaching 1.3 million total customers.
- Net income was R$11.2 million, down from R$13.6 million in the first quarter of 1999. Revenue increased 52.6% to R$214.4 million.
- Expenses increased 154% to R$85.4 million due to higher selling, administrative and financing costs from increased operations and debt levels.
- The company estimates its market share was 69% and continued investing in network digitization during the quarter.
This document provides an overview and analysis of Illinois Tool Works Inc.'s financial statements for 2001, 2000 and 1999. It summarizes revenues, operating income, and margins for each of ITW's five business segments for each year. It also discusses factors affecting revenues and costs, including the impact of acquisitions, divestitures, currency fluctuations, and end market demand. Additionally, it provides details on ITW's investments in mortgage-related assets and the expected future cash flows from these investments.
This document provides an overview and analysis of Illinois Tool Works Inc.'s financial statements for 2001, 2000 and 1999. It summarizes revenues, operating income, and margins for each of ITW's five business segments for each year. It also discusses factors affecting revenues and costs, including lower demand in North America, currency fluctuations, acquisitions, and nonrecurring costs. Additionally, it provides details on ITW's investments in mortgage-related assets and the expected future cash flows from these investments.
Press Release 2 Q00 Tele Nordeste Celular EnTIM RI
Tele Nordeste Celular Participações S.A. announced its results for the second quarter of 2000.
1) Operational highlights included adding 165,364 new clients, reaching a total of 1,362,000 clients, with market share estimated at 65%.
2) Financially, net income was R$0.9 million with revenues of R$210.8 million for the quarter. EBITDA was R$52.9 million representing an EBITDA margin of 25%. Bad debt expenses were R$29 million.
This annual report summarizes Lennar Corporation's performance in 1999. Key points include:
1) Lennar grew total revenues to $3.1 billion, a 29% increase over 1998, with net earnings increasing 20% to $173 million.
2) Lennar reduced its debt to total capital ratio from 43% to 37% and reduced its revolving credit balance to $0 by the end of 1999.
3) Lennar exceeded its goals for revenue, earnings, and home delivery growth while maintaining a focus on return on capital and equity.
1) Lennar Corporation had another record year in 1999, growing total revenues to $3.1 billion, a 29% increase, and growing net earnings by 20% to $173 million.
2) The company maintained a simple four-tiered strategy of operating model, expansion, diversification, and conservative fiscal policies, focusing on maintaining a strong balance sheet, diversifying earnings, and maximizing returns.
3) Lennar streamlined operations through two main divisions, Lennar Homes and Lennar Financial Services, allowing the company to cover most aspects of homebuilding and buying while keeping processes simple.
1) Lennar Corporation had another record year in 1999, growing total revenues to $3.1 billion, a 29% increase, and growing net earnings by 20% to $173 million.
2) The company maintained a simple four-tiered strategy of operating model, expansion, diversification, and conservative fiscal policy while focusing on maintaining a strong balance sheet, diversifying earnings, and maximizing returns.
3) Lennar's "Everything's Included" program and Zero Defects policy aim to maximize home value for customers through standard luxury features and a streamlined production process.
Clear Channel Communications reported financial results for the fourth quarter and full year of 2002. For the fourth quarter, revenues increased 19% to $2.2 billion and EBITDA increased 68% to $579 million. For the full year, revenues increased 6% to $8.4 billion and EBITDA rose 14% to $2.2 billion. Radio revenues increased 10% for the quarter and 8% for the year. Outdoor revenues grew 17% for the quarter and 6% for the year. Entertainment revenues were up 28% for the quarter but down 1% for the year. The company had strong free cash flow of $273 million for the quarter and $1.25 billion for the full year. Management credited
Tele Celular Sul Participações S.A. announced its results for the fourth quarter and full year 2003. Key highlights include:
- Revenue increased 23.5% to R$1.4 billion for the year driven by a 19% rise in customers to over 2 million.
- EBITDA grew 10.1% to R$383 million and net income increased 83.7% to R$120 million.
- The company invested R$213 million in network expansion while maintaining a strong positive cash flow of R$200 million.
- Management is proposing a 30.9% payout ratio to shareholders of R$37 million in dividends and interest on capital.
Omnicom's 2002 annual report summarizes the company's financial and operating highlights for the year. Some key points include:
- Revenue increased 9% to $7.5 billion, with domestic revenue up 15% and international revenue up 3%.
- Net income increased 10% to $643 million. Earnings per share were $3.44, up from $3.13 the prior year.
- Omnicom continued its strategy of targeted acquisitions, adding around $360 million in revenue.
- The company's businesses won $4.2 billion in new business billings, outpacing competitors despite a lackluster global economy.
- Creative agencies within Omnicom
Omnicom's 2002 annual report summarizes the company's financial and operating highlights for the year. Key points include:
- Revenue increased 9% to $7.5 billion, with net income up 10% to $643 million.
- Traditional media advertising grew 9% while CRM and specialty communications grew over 14% and 17% respectively.
- Omnicom continued its strategy of targeted acquisitions, adding around $360 million in revenue.
- The company's businesses won $4.2 billion in new business, outpacing competitors despite a lackluster global economy.
- Omnicom maintained its position as the most creative agency network in the world.
This document is Textron's 1999 Annual Report. The key points are:
1) Textron achieved record financial results in 1999 with revenues increasing 20% to $11.6 billion and earnings per share increasing 51%.
2) Textron's four business segments - Aircraft, Automotive, Industrial, and Finance - saw strong growth and profitability in 1999.
3) Textron is focused on consistent growth through strategic investments, acquisitions, driving operational excellence, and leveraging e-business.
Dover Corporation is a $7 billion global provider of industrial products, fluid management, engineered systems and electronic technologies. In 2008, Dover exceeded 3 of its 5 performance targets and achieved strong free cash flow of $834.6 million. Looking ahead, Dover is focused on cost savings initiatives, restructuring programs, and strategic capital allocation to deliver solid results in a challenging economic environment. Guidance for 2009 anticipates an 11-13% decline in total revenue but maintains a target for free cash flow to remain above 10% of revenue.
Dover Corporation is a $7 billion global provider of industrial products, fluid management, engineered systems, and electronic technologies. In 2008, Dover exceeded 3 of its 5 performance targets and achieved 3% earnings growth and 15.3% operating margins. For 2009, Dover expects revenues to decline 11-13% due to weakness in core markets, while pursuing restructuring efforts and synergies to offset declines and deliver EPS of $2.75-$3.05. Dover will continue strategic capital allocation including acquisitions and share repurchases.
Burlington Northern Santa Fe Corporation's 2000 Annual Report summarizes the company's performance for the year. Key points include:
- Revenues grew to $9.2 billion while operating expenses only increased 1% despite a $230 million rise in fuel costs.
- Intermodal revenues increased 6% to a record level while safety and efficiency improvements were made.
- However, weak coal demand, high fuel prices, and a slow US economy impacted results for the year.
- Over the past five years since the Burlington Northern and Santa Fe merger, significant progress has been made in safety, service, efficiency and financials.
This document outlines AutoZone's Code of Ethical Conduct for Financial Executives. It establishes principles that financial executives are expected to adhere to and advocate for, including acting with honesty and integrity, providing full and accurate information to stakeholders, and complying with all applicable laws and regulations. It details responsibilities of financial executives and procedures for reporting violations of the code or unethical behavior.
This document outlines AutoZone's Code of Ethical Conduct for Financial Executives. It establishes principles that financial executives are expected to adhere to and advocate for, including acting with honesty and integrity, providing full and accurate information to stakeholders, and complying with all applicable laws and regulations. The code defines financial executives and lists responsibilities such as avoiding conflicts of interest, maintaining confidentiality, and reporting any violations or issues regarding financial disclosures, controls, or legal compliance.
This document outlines the restated articles of incorporation for AutoZone, Inc. It details the company name, authorized shares including 200 million shares of common stock and 1 million shares of preferred stock. It establishes that the board of directors will set the stock consideration and that stock will not be assessable. The board can also set rights and designations of preferred stock series. It limits director personal liability and allows the board to adopt, amend or repeal bylaws.
This document outlines the restated articles of incorporation for AutoZone, Inc. It establishes the company name as AutoZone, Inc. and authorizes 201 million total shares made up of 200 million common shares and 1 million preferred shares. It also limits the personal liability of directors and officers, establishes that shareholders have no preemptive or cumulative voting rights, and allows the board of directors to determine the number of directors and adopt/amend company by-laws.
This document outlines the by-laws of Autozone, Inc. regarding meetings of stockholders. It specifies that the annual meeting will be held each year to elect directors and conduct business, and stockholders must give advance notice to the Secretary of any additional business to be addressed. It also describes how special meetings may be called, the information that must be provided to stockholders prior to meetings, and requirements for stockholder lists and quorums. Stockholders may only take actions at annual or special meetings and not by written consent without a meeting.
AutoZone has strong corporate governance practices according to Institutional Shareholder Services. Its board is comprised of the CEO, founder and seven independent directors who are elected annually. All board committees consist solely of independent directors. The audit committee, comprised of designated financial experts, meets quarterly with external and internal auditors without management present. All AutoZone officers and functional controllers must certify financial reports in writing and are subject to trading restrictions and general counsel approval for option exercises.
This document outlines the by-laws of Autozone, Inc. It discusses procedures for stockholder meetings, including annual meetings, notices of meetings, quorums, voting procedures. It also discusses the board of directors, including the number of directors, nominations, vacancies, meetings, and actions that can be taken without meetings. The by-laws provide the framework for how business is conducted and decisions are made within the corporation.
AutoZone has strong corporate governance practices according to Institutional Shareholder Services. Its board is comprised of the CEO, founder and seven independent directors who are elected annually. All board committees consist solely of independent directors. The audit committee, comprised of designated financial experts, meets quarterly with external and internal auditors without management present. All AutoZone officers and functional controllers must certify financial reports in writing and are subject to trading restrictions and general counsel approval for option exercises.
Este documento presenta el Código de Conducta de AutoZone para el año fiscal 2008. Explica los valores fundamentales de la compañía como poner a los clientes primero, preocuparse por las personas y esforzarse por un desempeño excepcional. También cubre temas como igualdad de oportunidades, acoso, conflictos de interés, confidencialidad y cumplimiento de leyes y regulaciones. El código establece las expectativas de comportamiento ético para todos los empleados de AutoZone.
Este documento presenta el Código de Conducta de AutoZone para el año fiscal 2008. Contiene secciones sobre los valores de AutoZone, las expectativas de conducta para los empleados, políticas sobre igualdad de oportunidades, acoso, conflictos de interés, uso de bienes de la compañía y reporte de comportamientos no éticos. El código busca establecer los más altos estándares éticos y legales para todos los empleados de AutoZone.
This document provides AutoZone's Code of Conduct for fiscal year 2008. It outlines AutoZone's values and expectations for ethical behavior from all employees.
The Code of Conduct covers topics such as equal employment opportunity, harassment, conflicts of interest, treatment of confidential information, fair dealing, and compliance with laws. Employees are expected to perform their jobs ethically and treat all people with dignity and respect. The Code also provides guidance on issues like accepting gifts, outside employment, and relationships within the workplace.
Employees who have questions about the Code of Conduct or face ethical issues are instructed to consult their supervisor. Adherence to the Code and AutoZone's policies is required to ensure responsible and lawful behavior from all.
This document is AutoZone's Code of Conduct for fiscal year 2008. It outlines AutoZone's values and ethical standards that all employees and board members must follow. The Code of Conduct covers topics such as equal employment opportunity, harassment, conflicts of interest, treatment of confidential information, and compliance with laws and regulations. Employees are expected to perform their jobs ethically and in a way that serves customers and shareholders. The Code also provides contact information for employees to report illegal or unethical behavior.
The document outlines AutoZone's corporate governance principles, which were first adopted in 2001 and have been amended several times since. It discusses the board's mission to maximize shareholder value, outlines the responsibilities and core competencies of board members, describes board organization and operations, and establishes policies regarding director independence, compensation, conflicts of interest, succession planning, and annual board evaluations.
- AutoZone reported first quarter fiscal year 2009 results, with net sales up 2% to $1.478 billion and diluted EPS up 10% to $2.23. Operating profit was flat at $239 million and operating margin decreased slightly.
- The company opened 30 new stores and replaced 2 stores in the US, ending the quarter with 4,122 domestic stores. Commercial programs grew 2% and commercial sales increased 1.8% to $170.6 million.
- Inventory increased 6% to $2.192 billion while inventory turns decreased to 1.5x. Working capital was negative $66 million and debt increased 5% to $2.268 billion.
The document summarizes AutoZone's 2008 annual stockholders' meeting. It discusses AutoZone's position as the largest auto parts retailer in the US, with over $6.5 billion in annual sales. It highlights AutoZone's strategic priorities of growing its US retail and commercial segments, expanding in Mexico, and growing its ALLDATA business. The document also reviews AutoZone's strong financial performance in recent years and its focus on continued sales growth, improving customer satisfaction, and managing costs.
This annual report summarizes AutoZone's financial performance in 2000. Some key points:
- Sales reached a record $4.48 billion, up 9% from 1999. Earnings per share grew 23% to $2.00.
- Acquired stores like Chief Auto Parts and Pep Boys Express locations significantly increased same-store sales. Stores in Mexico also saw strong growth.
- Cash flow from operations increased over $200 million to $513 million, allowing AutoZone to repurchase $608 million in stock.
- AutoZone opened 204 new stores in the US, bringing the total to 2,915. International expansion also continued with new stores in Mexico.
This document is AutoZone's 2001 annual report which provides an overview of the company's performance in fiscal year 2001. Some key points:
- AutoZone is the largest retailer of automotive parts and accessories in North America with over 3,000 stores in the US and Mexico.
- In fiscal 2001, the company pursued three strategic priorities: expanding the US retail business, developing the commercial business, and growing in Mexico.
- New marketing initiatives like the "Get in the Zone" campaign helped drive an 8% increase in same-store sales in the fourth quarter.
- The commercial business saw 11% same-store sales growth and now generates over $400 million in revenue.
- Auto
This document is AutoZone's 2001 annual report which provides an overview of the company's performance in fiscal year 2001. Some key points:
- AutoZone is the largest retailer of automotive parts and accessories in North America with over 3,000 stores in the US and Mexico.
- In fiscal 2001, the company pursued three strategic priorities: expanding the US retail business, developing the commercial business, and growing in Mexico.
- New marketing initiatives like the "Get in the Zone" campaign helped drive an 8% increase in same-store sales and 27% EPS growth in Q4.
- The commercial business saw an 11% increase in same-store sales for the year as the company focused on
- The annual report summarizes AutoZone's fiscal year 2002 performance, which saw record sales of $5.3 billion, earnings per share of $4.00, and a 52% return for shareholders.
- The three divisions - U.S. Retail, AZ Commercial, and Mexico - all contributed to growth. U.S. Retail had same-store sales growth of 8% and now operates 3,068 stores across 44 states.
- AZ Commercial grew 20% to $532 million in sales by expanding commercial product offerings and dedicated sales force for commercial customers.
- AutoZone aims to continue delivering strong profitable growth and pursuing opportunities in the large market for automotive maintenance and repairs.
Fabular Frames and the Four Ratio ProblemMajid Iqbal
Digital, interactive art showing the struggle of a society in providing for its present population while also saving planetary resources for future generations. Spread across several frames, the art is actually the rendering of real and speculative data. The stereographic projections change shape in response to prompts and provocations. Visitors interact with the model through speculative statements about how to increase savings across communities, regions, ecosystems and environments. Their fabulations combined with random noise, i.e. factors beyond control, have a dramatic effect on the societal transition. Things get better. Things get worse. The aim is to give visitors a new grasp and feel of the ongoing struggles in democracies around the world.
Stunning art in the small multiples format brings out the spatiotemporal nature of societal transitions, against backdrop issues such as energy, housing, waste, farmland and forest. In each frame we see hopeful and frightful interplays between spending and saving. Problems emerge when one of the two parts of the existential anaglyph rapidly shrinks like Arctic ice, as factors cross thresholds. Ecological wealth and intergenerational equity areFour at stake. Not enough spending could mean economic stress, social unrest and political conflict. Not enough saving and there will be climate breakdown and ‘bankruptcy’. So where does speculative design start and the gambling and betting end? Behind each fabular frame is a four ratio problem. Each ratio reflects the level of sacrifice and self-restraint a society is willing to accept, against promises of prosperity and freedom. Some values seem to stabilise a frame while others cause collapse. Get the ratios right and we can have it all. Get them wrong and things get more desperate.
OJP data from firms like Vicinity Jobs have emerged as a complement to traditional sources of labour demand data, such as the Job Vacancy and Wages Survey (JVWS). Ibrahim Abuallail, PhD Candidate, University of Ottawa, presented research relating to bias in OJPs and a proposed approach to effectively adjust OJP data to complement existing official data (such as from the JVWS) and improve the measurement of labour demand.
Economic Risk Factor Update: June 2024 [SlideShare]Commonwealth
May’s reports showed signs of continued economic growth, said Sam Millette, director, fixed income, in his latest Economic Risk Factor Update.
For more market updates, subscribe to The Independent Market Observer at https://blog.commonwealth.com/independent-market-observer.
South Dakota State University degree offer diploma Transcriptynfqplhm
办理美国SDSU毕业证书制作南达科他州立大学假文凭定制Q微168899991做SDSU留信网教留服认证海牙认证改SDSU成绩单GPA做SDSU假学位证假文凭高仿毕业证GRE代考如何申请南达科他州立大学South Dakota State University degree offer diploma Transcript
"Does Foreign Direct Investment Negatively Affect Preservation of Culture in the Global South? Case Studies in Thailand and Cambodia."
Do elements of globalization, such as Foreign Direct Investment (FDI), negatively affect the ability of countries in the Global South to preserve their culture? This research aims to answer this question by employing a cross-sectional comparative case study analysis utilizing methods of difference. Thailand and Cambodia are compared as they are in the same region and have a similar culture. The metric of difference between Thailand and Cambodia is their ability to preserve their culture. This ability is operationalized by their respective attitudes towards FDI; Thailand imposes stringent regulations and limitations on FDI while Cambodia does not hesitate to accept most FDI and imposes fewer limitations. The evidence from this study suggests that FDI from globally influential countries with high gross domestic products (GDPs) (e.g. China, U.S.) challenges the ability of countries with lower GDPs (e.g. Cambodia) to protect their culture. Furthermore, the ability, or lack thereof, of the receiving countries to protect their culture is amplified by the existence and implementation of restrictive FDI policies imposed by their governments.
My study abroad in Bali, Indonesia, inspired this research topic as I noticed how globalization is changing the culture of its people. I learned their language and way of life which helped me understand the beauty and importance of cultural preservation. I believe we could all benefit from learning new perspectives as they could help us ideate solutions to contemporary issues and empathize with others.
2. Omnicom
COMPARATIVE
HIGHLIGHTS
2000 1999 1998 1997 1996 5 YR. CAGR
(Amounts in Thousands Except Per Share Amounts)
Operating Data(a)
$6,154,230 $5,130,545
Revenue $4,290,946 $3,296,224 $2,775,873 21.1%
878,090
Operating Income 724,130 562,207 411,684 321,192 27.0%
434,969(b)
Net Income 362,882 278,845 217,300 162,076 26.3%
Common stock data(a), (c)
$2.49(b)
Net income per share —Basic 2.07 1.61 1.30 1.02 22.0%
2.40(b)
—Diluted 2.01 1.57 1.28 .99 21.9%
0.70
Dividends per share 0.625 0.525 0.45 0.375 16.2%
Weighted average number of
common shares and common
equivalent shares outstanding
174,881
during the year —Basic 175,286 173,105 166,857 158,788
189,038
—Diluted 189,885 183,560 170,031 168,933
184,079
Shares outstanding at year end 177,488 177,957 169,535 168,329
All information prior to 1999 has been restated to give effect to the accounting for the acquisition of Abbott Mead Vickers under
(a)
the pooling of interest method of accounting.
Excludes $63.8 million after-tax gain for sale of Razorfish shares.
(b)
Per share amounts have been restated to give effect to the two-for-one stock split completed in December 1997.
(c)
3. LETTER PRESIDENT
FROM THE
DEAR FELLOW SHAREHOLDERS:
Second in Quality of Products and Services;
2000 was an excellent year for Omnicom Group.
Second in Use of Corporate Assets; Third in
I am pleased to report that it was our 14th
Financial Soundness; and Third in Long-Term
consecutive year of record-breaking financial results.
Investment Value.
The fourth quarter was Omnicom’s 38th quarter in a
row of year-over-year gains in revenue and earnings. These achievements are a credit to both our
Our company’s 16.6% organic growth continued to holding company and our operating company
outpace the market, whose overall advance last year employees everywhere, who make up some of the
was at a single-digit rate. most entrepreneurial and talented individuals in
management today.
In 2000, our operating companies won
$4.9 billion in net new business – another record. We
FINANCIAL REVIEW
achieved these results in a challenging economic
Worldwide revenue increased 20% to $6.2 billion
climate because we have built positions of strong
in 2000, from $5.1 billion in 1999. Domestic revenues
market leadership in each category of services we
increased 29% to $3.3 billion, compared with
offer. Clients engage our companies for their
$2.5 billion in 1999. We reported international
excellent strategic counsel and outstanding creative
revenues for the twelve months of $2.9 billion, an
execution in all key marketing disciplines, and in
11% increase from the $2.6 billion in 1999. The
every important geographic region of the world.
growth of our international business in dollar terms
Today we have built leadership positions in
was cut nearly in half by currency translation effects.
more than 30 marketing disciplines, and we
Net income increased 37% last year, to $498.8
provide our services in more than 100 countries.
million, up from $362.9 million in 1999. Diluted
Non-advertising marketing and communications
earnings per share gained 36%, reaching $2.73 per
services account for 56% of our revenue, up
share in 2000, an advance from the $2.01 per share
from 30% at the start of the last decade. Advertising
earned in 1999. This includes a pre-tax realized gain
and media services account for the balance.
of $110.0 million ($63.8 million after-tax) on the sale
Approximately one-half of our revenue came from
of a portion of the company’s ownership position in
the U.S. in 2000, vs. 57% in 1990, with the rest
Razorfish. Excluding the Razorfish gain, net income
coming from a mix of mature and emerging markets
for the twelve months increased 20% year-over-year
around the world.
to $435 million and diluted earnings per share
This balance of breadth, depth and diversity
increased 19% to $2.40 per share.
reduces our exposure to any single industry or an
Our operating margin widened to 14.3%,
economic reversal in any world region. It also
compared to 14.1% in 1999.
provides us with significant opportunities to benefit
from growth in marketing expenditures.
2000 OPERATING REVIEW
Our success last year was also evident from the
Advertising and Media Agency Brands
significant industry and media recognition we
Omnicom Group’s three global advertising
received.
networks – BBDO Worldwide, DDB Worldwide and
• Omnicom’s standing as the creative leader in
TBWA Worldwide – were, once again, ranked among
advertising was reaffirmed yet again. Our
the most creative agency networks in the world by
advertising agencies, BBDO Worldwide,
the Gunn Report, placing first, second and fifth.
DDB Worldwide, TBWA Worldwide and
BBDO Worldwide expanded its business with
Goodby, Silverstein & Partners, dominated
established and new clients, including the award by
the International Advertising Festival at
DaimlerChrysler of its recently consolidated account.
Cannes, winning 64 awards, including the
Other notable new assignments included: Cingular
Grand Prix, the industry’s most prestigious.
Wireless, Kentucky Fried Chicken, Miranda and 7Up
• Fortune magazine ranked Omnicom Number
from PepsiCo, Gillette’s Venus for Women and
One among our competitors on its list of
Pharmacia’s Nicorette.
America’s Most Admired Companies. Out of
BBDO Worldwide won more awards at the
more than 600 companies in 52 industries,
International Advertising Festival at Cannes than any
Omnicom ranked First in Quality of
Management; First in Employee Talent; other agency, a feat duplicated at the Clios. As a
4. result of its strong overall performance, BBDO was DDB also launched Brand Capital, a proprietary
named Global Agency of the Year by Advertising research tool that reveals how consumers relate to
Age and Eastern Agency of the Year by AdWeek. and bond with more than 500 brands. During the
Almap/BBDO of Brazil was named Agency of the year, DDB consolidated its major interactive units
Year at Cannes. around the world, including DDB Digital in
North America, and formed Tribal DDB, a global
BBDO operates 323 offices in 76 countries. company specializing in consulting, marketing,
During 2000 it made five agency acquisitions: customer relationship management programs and
Allansson, Nillson & Riffi in Sweden, now known as e-commerce.
BBDO ANR; D’Adda, Lorenzini, Vigorelli, in Italy
2000 was a great year for TBWA Worldwide as the
(now DLV BBDO); Sancho Publicidad in Colombia
agency continued to solidify its reputation for creating
(Sancho BBDO); Net#work in South Africa, which
brand campaigns that work. TBWA won assignments
was subsequently merged with Berry Bush BBDO;
from Kmart, Earthlink, Seagram and Sony and it
and in Korea, BBDO acquired a majority stake in the
earned 23 Lions at the International Advertising
creatively recognized Dongbang agency.
Festival at Cannes, while earning its eighth Grand
In September, BBDO launched a new customer Effie for advertising effectiveness — the latest for
relationship management (CRM) network called Apple Computer’s “Think Different” campaign.
Proximity Worldwide. Proximity operates in
In a series of strategic moves, G1, a joint
23 countries, helping clients integrate their offline
venture between TBWA and Japan’s Hakuhodo, was
and online marketing and brand-building efforts. In
formed to provide global marketing and
November, BBDO expanded its PentaMark unit to
communications services to Nissan Motor Corp.
provide support for DaimlerChrysler on a worldwide
TBWA acquired the FKBG agency and Mode en
basis.
Images, both in France, and formed
TBWARaadMiddle East in the United Arab
DDB Worldwide, which has 206 offices in
Emirates. Whybin TBWA & Partners was named
99 countries, won a number of assignments from
Australia’s Agency of the Year for 2000 by Ad News
new and established clients. Notable wins included:
for the third year in a row.
AOL, DHL, ExxonMobil, Energizer, Hasbro Toys,
Henkel and J.C. Penney.
TBWADigerati was implemented in 2000 – an
initiative dedicated to raising overall agency
At the International Advertising Festival at
competency with the digital environment and its
Cannes, DDB won the Grand Prix in TV – the
implications for business. TBWA proprietary tools
industry’s premier award – for its “Whassup” work
have been developed and implemented to support
on behalf of Anheuser-Busch. That campaign also
this program.
won the Grand Clio for TV, while a campaign for
Volkswagen won the Grand Clio for print. Goodby, Silverstein & Partners added Sirius
Satellite Radio and Turner Broadcasting’s TNT to its
DDB’s Chicago office was named as one of the
client roster in 2000. Goodby was also named
top two agencies in the world on the 2000 Global
Agency of the Year by Advertising Age. The trade
Zenith list published by Creativity magazine, and for
magazine cited GS&P for its excellent body of work
the second straight year, DDB commercials were the
for clients ranging from E*Trade, Hewlett-Packard
most popular, according to USA Today’s Super Bowl
and SBC to Discover Card.
Ad Meter. DDB Colombia, Palmer Jarvis DDB
(Canada), BMP DDB in the U.K., Result DDB in GSD&M was named Southwest Agency of the
Amsterdam and DDB Paris all won Agency of the Year by AdWeek magazine. This was the sixth time
Year accolades in their markets. the agency received that honor. Also last year,
GSD&M became the first Southwest ad agency to
DDB made several acquisitions last year. Among
generate billings in excess of $1 billion. The agency’s
them were: Court Burkitt in London and Generator
new-business wins last year included the U.S. Air
in Denmark. The company formed Lee DDB in
Force and Land Rover.
Korea. DDB continued to grow its integrated
marketing, specialty services and consulting Martin/Williams continued its mission of
capabilities. In the expanding field of healthcare delivering a range of services to clients and launched
marketing, DDB and Frank J. Corbett, another Turbobranding™ — a set of interlocking techniques
Omnicom unit, formed DDB Corbett, and in France, that helped the agency win significant new work for
DDB acquired Ciel & Terre, a leading healthcare Donato’s Pizza (a subsidiary of McDonald’s),
marketing communications company. L.L. Bean and Steelcase.
5. Omnicom Media Group is among the leading of clients seeking diversified marketing strategies
media services companies in the world. It ended that address a fragmented media environment.
2000 with more than $2.5 billion in new — media
Public Relations remains the largest sector within
only — business won in cooperation with Omnicom
DAS. Our global PR agency networks — Fleishman-
global advertising agencies. OMG is comprised of
Hillard, Ketchum and Porter Novelli — rank among
two global media buying and planning networks,
the top seven public relations networks globally.
Optimum Media Direction (OMD) and PHD Group.
Specialist agencies Brodeur Worldwide, Clark &
OMD opened a dozen new offices in 2000, Weinstock, Cone, Inc. and Gavin Anderson round
including seven new offices in Europe, bringing its out DAS’ public relations portfolio – the largest in
total European coverage to over 20 countries. OMD the world.
also launched in Australia and added offices in
Fleishman-Hillard finished first among all PR
several Latin American countries. OMD USA began
agencies in quality reputation in the Thomas L.
operating in April 2000 with offices in eight cities
Harris/Impulse Research Survey. Fleishman-Hillard
and as the largest buyer of television in the U.S.
added to its slate of services with the acquisition of
OMD also was the recipient of several industry one of Washington, D.C.’s largest public affairs
awards in 2000, including a Media Lion at the agencies, Greer, Margolis, Mitchell, Burns &
International Advertising Festival in Cannes. OMD Associates. Fleishman-Hillard also added to its global
U.K. and OMD France were the most highly technology base with the acquisition of Herald
awarded companies at the U.K. Media Week Awards Communications, as well as Lois Paul and KVO
and the French Effie 2000 Awards, respectively. public relations. Recently, GPC joined with
OMD Asia was recognized for Best Use of Media in Fleishman-Hillard to create a leading global public
the Media Asia 2000 Awards. affairs group.
Following two consecutive years as Campaign’s
Ketchum launched a multi-year digital strategy
Media Agency of the Year, PHD was recognized by
to transform its global client service model that
the magazine as having the top media-planning
provides a new system of knowledge-sharing within
capability among all media agencies in the U.K.
its network. Ketchum also expanded its base of
Headquartered in London, PHD was formed in 2000
client services with acquisitions in Spain and Brazil
by combining Omnicom’s strongest independent
and the introduction of Ketchum Entertainment
media agencies in Canada, the U.S. and the U.K. as
Marketing. Ketchum won PR Week’s business-to-
its nucleus. While providing buying and strategic
business Campaign of the Year award and both
media services as well as dedicated international
Fleishman-Hillard and Ketchum shared a record
planning, PHD also offers a range of specialist
eight Silver Anvils from the Public Relations Society
services from sponsorship to program placement,
of America.
econometric modeling, data mining, online strategy
and media buying. Porter Novelli continued to expand its core
business and acquired Nelson Communications, a
Marketing Services and Specialty Sacramento agency focused on California-based
Communications Brands public affairs. Inside PR magazine cited Porter
Novelli for the Best Public Relations Campaign in
Diversified Agency Services (DAS) continued its
2000. Cone, Inc. won three awards from Inside PR
strong growth in 2000. DAS now includes more than
for its work in cause marketing and Brodeur was
100 marketing services companies in 30 professional
named PR Week’s 2000 PR Agency of the Year
disciplines, with 600 offices in over 65 countries.
overall.
DAS companies are market leaders in the fields
Gavin Anderson & Company acquired Chlopak,
of public relations, customer relationship
Leonard, Schechter & Associates to strengthen its
management and such specialized areas as
public affairs capabilities in Washington, D.C.
healthcare communications, recruitment advertising,
financial communications, sports, entertainment and
During the year, DAS also acquired Washington
event marketing. DAS also owns top-performing
Speakers Bureau, the number one lecture agency in
units serving the brand identity, custom publishing
the world that represents distinguished world
and research needs of global clients.
leaders, members of the media, futurists and
The strong performance within DAS results from humorists for corporate and organizational
its companies’ abilities to meet the growing demands appearances.
6. Customer Relationship Marketing is one of the and consumer insight, was acquired. M/A/R/C
most rapidly expanding of DAS’ services. Clients are Research provides marketing insight and proprietary
pursuing the commercial benefits of developing research for both offline and online marketing
more focused communications that produce communications.
measurable results. Traditional direct response DAS expanded its presence in sports and
channels combined with digital technologies are sponsorship marketing last year with The Marketing
allowing companies like Claydon Heeley Jones Arm’s acquisition of Steiner Sports Marketing, a
Mason, Direct Partners, Rapp Collins, and Targetbase collectible and memorabilia marketing company.
— all innovators in customer relationship marketing DAS also acquired an equity stake in Horrow Sports
and database technology — to benefit from this Ventures, an advisor on sports and entertainment
trend. sponsorship facility opportunities.
In the area of promotions, events and field
Digital Services Brands
marketing, DAS had a good year. Alcone Marketing
Despite the slowdown in technology spending,
Group and the Integer Group focus on the strategy
digital media represents an increasingly important
and tactics of retail programs, including database-
means for enriching customer relationships and
linked incentives and customer loyalty programs.
delivering sophisticated marketing communications
GMR Marketing grew strongly in event marketing
messages. Our companies will continue to pursue a
and DAS acquired US Marketing and Promotions
variety of interactive initiatives to benefit from the
(USM&P), which Promo magazine named the
long-term trends in this sector, and we will consider
number one agency for 2000. USM&P joins three
strategic investment opportunities presented by the
other strong brands in field marketing, including
currently depressed conditions in the capital markets
U.S.-based Marketstar, TLP-Tracy Locke Partnership
for digital businesses.
and European leader CPM International Group.
In 2000, DAS continued to expand its global A Balance for Future Growth
healthcare marketing practice. Under the TARGIS
In conclusion, despite the weakening economic
brand, DAS oversees an international network
environment in the United States, 2000 was an
of healthcare agencies, six of which are ranked
outstanding year for our company. We continued to
among the top 25 healthcare agencies by
perform well across all of our operating divisions.
Medical Advertising News. DAS acquired Eden
Our strategically balanced advertising and marketing
Communications Group in 2000, a leading provider
services portfolio and diverse geographic reach
of healthcare education and marketing services and
allow us to continue to increase our services to
took a minority stake in Apothecom Associates, a
existing clients and win new accounts. Our sound
medical communications company. DAS also
financial position and strong balance sheet provide a
completed the acquisition of Mathews Media Group,
solid foundation for our ongoing operations, and
which works with its pharmaceutical company
serve as a base for our expansion.
clients at the earliest stages of product development
Our primary goal: to remain the leading
to design clinical evaluation programs as well as
marketing communications company in the world,
commercialization and branding strategies.
measured in terms of the quality of our employees,
Merkley Newman Harty successfully integrated
the quality of our client relationships, the quality of
Consumer Health Networks into its operations and
our work and the rewards we provide for our
also joined two other DAS companies — Bayless
shareholders. As we continue our relentless pursuit
Cronin and Team South (now I2i Communications) —
of these objectives, we are thankful for the skill,
while forming strong partnerships with other
creativity and commitment of our employees around
Omnicom and DAS agencies including Footsteps, a
the world and the commitment and confidence of
multicultural marketing agency.
our shareholders.
Bernard Hodes Group remains the world’s
Thank you all for your continued support.
leading human resource communications company
and in 2000 expanded its award-winning creative
work in all areas of recruitment advertising and
employee communications.
Interbrand retained its position as a global
leader in brand consulting. New Solutions, the
leading U.K.-based strategic marketing consultancy John Wren
that specializes in brand and business strategy
7. UNITED STATES
SECURITIES AND EXCHANGE COMMISSION
Washington, D.C. 20549
[X] ANNUAL REPORT PURSUANT TO SECTION 13 OR 15(d) OF THE SECURITIES
EXCHANGE ACT OF 1934
For the fiscal year ended: December 31, 2000
OR
[ ] TRANSITION REPORT PURSUANT TO SECTION 13 OR 15(d) OF THE
SECURITIES EXCHANGE ACT OF 1934
Commission File Number: 1-10551
OMNICOM GROUP INC.
(Exact name of registrant as specified in its charter)
New York 13-1514814
(State or other jurisdiction of (I.R.S. Employer Identification No.)
incorporation or organization)
437 Madison Avenue, New York, NY 10022
(Address of principal executive offices) (Zip Code)
Registrant’s telephone number, including area code: (212) 415-3600
Securities Registered Pursuant to Section 12(b) of the Act:
Name of each Exchange
Title of each class on which Registered
___________________________________________ ___________________________________________
Common Stock, $.15 Par Value New York Stock Exchange
Securities Registered Pursuant to Section 12(g) of the Act: None
The registrant has (1) filed all reports required to be filed by Section 13 or 15(d) of the Securities
Exchange Act of 1934 during the preceding 12 months and (2) been subject to such filing requirements
for the past 90 days.
Disclosure of delinquent filers pursuant to Item 405 of Regulations S-K is not contained herein
and will not be contained in the definitive proxy or information statements incorporated by reference in
Part III of this form 10-K or any amendment to this Form 10-K.
At March 15, 2001, 184,372,879 shares of Omnicom Common Stock, $.15 par value, were
outstanding; the aggregate market value of the voting stock held by nonaffiliates at March 15, 2001 was
$15,317,326,000.
Certain portions of Omnicom’s definitive proxy statement relating to its annual meeting of
shareholders scheduled to be held on May 22, 2001 are incorporated by reference into Part III of this
report.
8. OMNICOM GROUP INC.
ANNUAL REPORT ON FORM 10-K FOR
THE YEAR ENDED DECEMBER 31, 2000
INDEX AND CROSS-REFERENCE SHEET
PURSUANT TO INSTRUCTIONS G(4) AND H AND FORM 10-K
Page
________
PART 1
Item 1. Business .......................................................................................................................... 1
Item 2. Properties ........................................................................................................................ 2
Item 3. Legal Proceedings .......................................................................................................... 2
Item 4. Submission of Matters to a Vote of Security Holders.................................................... 2
PART II
Item 5. Market for Registrant’s Common Equity and Related Stockholder Matters ................ 3
Item 6. Selected Financial Data .................................................................................................. 3
Items 7/7A. Management’s Discussion and Analysis of Financial Condition and Results of
Operations; Quantitative and Qualitative Disclosures about Market Risk............ 4
Item 8. Financial Statements and Supplementary Data.............................................................. 6
Item 9. Changes in and Disagreements with Accountants on Accounting and Financial
Disclosure .............................................................................................................. 6
PART III
Item 10. Directors and Executive Officers of the Registrant........................................................ *
Item 11. Executive Compensation ................................................................................................ *
Item 12. Security Ownership of Certain Beneficial Owners and Management .......................... *
Item 13. Certain Relationships and Related Transactions ............................................................ *
PART IV
Item 14. Exhibits, Financial Statement Schedules and Reports on Form 8-K ............................ 8
Index to Financial Statements ...................................................................................... 8
Index to Financial Statement Schedules ........................................................................ 8
Exhibit Index .................................................................................................................. 8
Signatures ............................................................................................................................................ 10
Management Report .............................................................................................................................. F-1
Report of Independent Public Accountants .......................................................................................... F-2
Consolidated Financial Statements ...................................................................................................... F-3
Notes to Consolidated Financial Statements ........................................................................................ F-7
* The information called for by Items 10, 11, 12 and 13, to the extent not included in this document, is
incorporated herein by reference to the information to be included under the captions “Election of Directors,”
“Management’s Stock Ownership,” “Director Compensation” and “Executive Compensation,” in the Company’s
definitive proxy statement, which is expected to be filed by April 11, 2001.
9. PART I
Introduction
This report is both our 2000 annual report to shareholders and our 2000 annual report on Form 10K
required under the federal securities laws. The specific items of Form 10-K are set forth in the index and
cross-reference sheet appearing on the inside cover of this report.
We are a holding company; our business is conducted through subsidiaries. For convenience of reference,
however, the terms “Omnicom,” “we” or “us” mean Omnicom Group Inc. and our subsidiaries unless the
context indicates otherwise.
Statements of our beliefs or expectations regarding future events are “forward-looking statements” within
the meaning of the federal securities laws. These statements are subject to various risks and uncertainties,
including as a result of the specific factors identified under the caption “Risks” on page 2 and elsewhere in this
report. There can be no assurance that these beliefs or expectations will not change or be affected by actual
future events.
1. Business
General. We are one of the largest marketing and corporate communications companies in the world. Our
company was formed through a 1986 combination of three marketing and corporate communications networks,
BBDO, Doyle Dane Bernbach and Needham Harper. We have grown our holdings to over 1400 companies
operating in more than 100 countries. Our companies provide an extensive range of marketing and corporate
communications services, including advertising, media planning and buying, promotional marketing, sports and
event marketing, direct marketing, database management, field marketing, digital and interactive marketing,
public relations, marketing research, custom publishing, brand consultancy, directory and business-to-business
advertising, healthcare communications, recruitment communications and other specialty communications.
Marketing and corporate communications services are provided to clients through worldwide, national and
regional independent agency brands. These brands include, among others, BBDO Worldwide, DDB Worldwide,
TBWA Worldwide, Abbott Mead Vickers, Accel Healthcare, Adelphi Group Ltd., Alcone Marketing Group,
Bernard Hodes Group, BGM-FMJ Healthcomm, Brodeur Worldwide, Clark & Weinstock, Claydon Heeley
Jones Mason, Cline Davis & Mann, Cone, Corbett Healthcare Group, CPM International, Direct Partners,
Doremus, Eden Communications Group, Fleishman-Hillard, Gavin Anderson & Company, GMR Marketing,
Goodby, Silverstein & Partners, Griffin Bacal, GSD&M, Harrison & Star Business Group, Harrison Wilson &
Associates, Horrow Sports Ventures, Integer Group, Interbrand, InterOne Marketing Group, Kaleidoscope,
Ketchum, Ketchum Directory Advertising, KPR, Lieber Levett Koenig Farese Babcock, Lyons Lavey Nickel
Swift, M/A/R/C Research, MarketStar Corporation, Martin/Williams, Matthews Media Group, Merkley
Newman Harty, Millsport, Moss Dragoti, Optimum Media Direction, PhD, PentaMark Worldwide, Porter
Novelli International, Pauffley, PGC Advertising, Premier Media Partners, Proximity Worldwide, QED
Technologies, Rapp Collins Worldwide, Russ Reid Company, Targetbase, TARGIS Healthcare Communications
Worldwide, Tequila, The Designory, The Marketing Arm, TicToc, TLP-Tracy Locke Partnership, Tribal DDB,
U.S. Marketing & Promotions, Washington Speakers Bureau, Zimmerman & Partners Advertising and
@tmosphere Interactive.
Our total consolidated revenue is about evenly divided between U.S. and non-U.S. operations. For
financial information concerning domestic and foreign operations and segment reporting, see Note 5 to the
Consolidated Financial Statements at pages F-13 to F-14 of this report. For Financial information concerning
acquisitions in 2000, see Note 2 to the Consolidated Financial Statements at page F-10 of this report.
Clients. We had over 5,000 clients in 2000, many of which were served by more than one of our agency
brands. Our 10 largest and 200 largest clients accounted for 18% and 48%, respectively, of our 2000
consolidated revenue. Fourteen of our agencies provided services to our largest client in 2000. This client
accounted for 5.2% of our 2000 consolidated revenue.
Employees. We employed 56,000 people at December 31, 2000. About 38% of these people were
employed in our U.S. operations.
1
10. Risks. We face risks typical of marketing and corporate communications services companies and other
services businesses generally, including risks arising out of changes in general economic conditions, competitive
factors, client communication requirements, the hiring and retention of human resources and other factors. In
addition, our international operations are subject to the risk of currency fluctuations, exchange controls and
similar risks discussed in Item 7 on page 5. For financial information on our operations by geographic area, see
Note 5 to the Consolidated Financial Statements at pages F-13 to F-14 of this report. Revenue is dependent
upon marketing and corporate communication requirements of clients and tends to be highest in the second and
fourth quarters of the calendar year.
Government agencies and consumer groups have directly or indirectly affected or attempted to affect the
scope, content and manner of presentation of advertising. We presently believe the total volume of advertising in
general media will not be materially affected by future legislation or regulation, although the scope, content and
manner of presentation of advertising will continue to be affected.
2. Properties
We maintain office space in many of the major cities around the world, including our corporate
headquarters in New York City. Certain of our leases are subject to rent reviews under escalation clauses and
require payment of expenses. Our consolidated rent expense was $429.0 million in 2000, $341.6 million in 1999
and $311.5 million in 1998, after reduction for rents received from subleases of $19.9 million, $17.4 million and
$14.7 million, respectively. Substantially all of these properties are leased. See Note 10 to the Consolidated
Financial Statements on pages F-18 to F-19 of this report for a discussion of our lease commitments, including
our leased properties.
3. Legal Proceedings
We are involved from time to time in various legal proceedings in the ordinary course of business. We do
not presently expect that these proceedings will have a material adverse effect on our financial position or
results of operations.
4. Submission of Matters to a Vote of Security Holders
No matters were submitted to a vote of our shareholders during the last quarter of 2000.
2
11. PART II
5. Market for Registrant’s Common Equity and Related Stockholder Matters
Our common shares are listed on the New York Stock Exchange under the symbol “OMC”. On March 15,
2001, we had 4,197 holders of record of our common shares. The table below shows the range of quarterly high
and low closing prices reported on the New York Stock Exchange Composite Tape for our common shares and
the dividends paid per share for these periods.
Dividends Paid
Period High Low Per Share
____________ ________ _______ ________________________
Q1 1999 . . . . . . . . . . . . . . . . . . $ 79.94 $56.50 $0.15
Q2 1999 . . . . . . . . . . . . . . . . . . 85.13 67.00 0.15
Q3 1999 . . . . . . . . . . . . . . . . . . 80.69 67.06 0.15
Q4 1999 . . . . . . . . . . . . . . . . . . 107.13 71.63 0.175
Q1 2000 . . . . . . . . . . . . . . . . . . $ 99.63 $79.88 $0.175
Q2 2000 . . . . . . . . . . . . . . . . . . 97.25 82.13 0.175
Q3 2000 . . . . . . . . . . . . . . . . . . 90.44 70.00 0.175
Q4 2000 . . . . . . . . . . . . . . . . . . 92.25 72.69 0.175
Q1 2001 (through March 15) . . $ 94.51 $78.69 $0.175
We are subject to a number of financial tests under the terms of our debt and are in compliance with those
tests as of December 31, 2000. We are not aware of any restrictions on our ability to continue to pay dividends.
In February 2001, we completed the issuance and sale to Merrill Lynch & Co., as initial purchaser, of
$850 million aggregate principal amount of Liquid Yield Option Notes due 2031, or LYONs, for net cash
proceeds of $830.2 million. Merrill Lynch & Co. resold the LYONs to a limited number of qualified
institutional buyers. The sale of the LYONs was effected pursuant to the exemption afforded by Section 4(2) of
the Securities Act of 1933 and Rule 144A under that Act in reliance upon the representations of Merrill Lynch.
6. Selected Financial Data
The following selected financial data should be read in conjunction with our consolidated financial
statements which begin on page F-1. Information below and in the next section of this report has been restated
to give effect to our accounting for our 1999 acquisition of Abbott Mead Vickers (“AMV”) under the
pooling of interests method of accounting. See Note 2 to the Consolidated Financial Statements page F-10 of
this report. Per share amounts for 1996 have been restated to give effect to our two-for-one stock split
completed in December 1997.
(Dollars in Thousands Except Per Share Amounts)
______________________________________________________________
2000 1999 1998 1997 1996
________ ________ ________ ________ ________
For the year:
Revenue.............................................. $6,154,230 $5,130,545 $4,290,946 $3,296,224 $2,775,873
498,795(a)
Net income ........................................ 362,882 278,845 217,300 162,076
Earnings per common share,
excluding Razorfish gain
Basic .............................................. 2.49 2.07 1.61 1.30 1.02
Diluted .......................................... 2.40 2.01 1.57 1.28 0.99
Earnings per common share,
including Razorfish gain
Basic .............................................. 2.85
Diluted .......................................... 2.73
Dividends declared per common
share .............................................. 0.70 0.625 0.525 0.45 0.375
At year end:
Total assets ........................................ $9,891,499 $9,017,637 $7,121,968 $5,114,364 $4,192,156
Long-term obligations:
Long-term debt and convertible
subordinated debentures .......... 1,245,387 711,632 717,410 341,665 208,329
Deferred compensation and
other liabilities .......................... 296,921 300,746 269,966 166,492 130,606
(a) Includes $63.8 million after-tax gain on sale of Razorfish shares.
3
12. 7/7A. Management’s Discussion and Analysis of Financial Condition and Results of Operations;
Quantitative and Qualitative Information about Market Risk
Results of Operations
Revenue: In 2000, our consolidated worldwide revenue increased 20.0% to $6,154.2 million from
$5,130.5 million in 1999, reflecting the growth in both domestic and international operations described below.
In 1999, our consolidated worldwide revenue increased 19.6% to $5,130.5 million from $4,290.9 million in
1998. These increases reflecting the growth in both our domestic and international operations described below.
Our 2000 domestic revenue increased 28.6% to $3,258.2 million from $2,532.9 million in 1999. The
effect of acquisitions, net of divestitures, accounted for a 10.7% increase. The remaining 17.9% increase was
due to net new business wins and higher net revenue from existing clients. Our 1999 domestic revenue increased
20.7% as compared to 1998. The effect of acquisitions, net of divestitures, accounted for 6.1% increase. The
remaining 14.6% increase was due to net new business wins and higher net revenue from existing clients.
Our 2000 international revenue increased 11.5% to $2,896.0 million from $2,597.6 million in 1999. The
effect of acquisitions, net of divestitures, accounted for a 7.1% increase. Changes in translation of foreign
currencies to the US dollar decreased international revenue by 11.0% as compared to 1999, driven primarily by
decreases in the value of the Euro and the British pound relative to the US dollar. The remaining 15.4% increase
was due to net new business wins and higher net revenue from existing clients. Our 1999 international revenue
increased 18.4% as compared to 1998. The effect of acquisitions, net of divestitures, accounted for a
10.9% increase in international revenue. Changes in the translation of foreign currencies to the U.S. dollar
decreased international revenue by 6.0% as compared to 1998. The remaining 13.5% increase was due to net
new business wins and higher net revenue from existing clients.
Operating Expenses and Net Interest Expense: Our 2000 worldwide operating expenses increased
19.7% to $5,276.1 million from $4,406.4 million in 1999, primarily as a result of increased operating costs in
support of our increased revenue base. Net interest expense increased to $76.5 million from $50.4 million in
1999, due principally to increased interest rates and higher average borrowings as compared to 1999. Higher
average borrowings related primarily to acquisitions and share repurchases during the year. Changes in
translation of foreign currencies to the US dollar decreased worldwide expenses, including net interest expense,
by 5.6% as compared to 1999.
Our 1999 worldwide operating expenses increased 18.2% to $4,406.4 million from $3,728.7 million in
1998, primarily as a result of increased operating expenses. Our net interest expense in 1999 increased to
$50.4 million from $40.4 million in 1998. This increase primarily reflects higher average borrowings during the
year and higher interest rates. Changes in the translation of foreign currencies to the U.S. dollar decreased
worldwide expenses, including net interest expense, by 2.8% as compared to 1998.
Income Before Income Taxes (“Pretax Margin”) and Operating Margin: Operating margin, which
excludes net interest expense, improved to 14.3% as compared to 14.1% in 1999, reflecting improved operating
leverage and continued emphasis on cost controls and corporate purchasing efficiencies. Additionally, we sold a
portion of our investment in Razorfish, Inc. in the first quarter of 2000, resulting in a $110.0 million pretax gain
($63.8 million after tax). Excluding the Razorfish gain, our pretax margin for the year 2000 was 13.0%
compared to 13.1% in 1999.
Our operating margin increased to 14.1% in 1999 from 13.1% in 1998, primarily as a result of improved
operating leverage. In addition, 1998 included transaction costs incurred by AMV. Our 1999 pretax margin was
13.1% compared to 12.2% in 1998.
Income Taxes: Our consolidated effective income tax rate was 40.5% in 2000 as compared to 40.6% in
1999. The decrease was primarily attributable to lower effective tax rates at our international operations,
partially offset by an increase in our domestic effective tax rate resulting from a higher marginal tax rate on the
sale of Razorfish shares. Our 1999 consolidated effective tax rate decreased to 40.6% from 42.0% in 1998. The
decrease reflects lower international effective tax rates.
Equity in Affiliates and Minority Interests: In 2000, equity in affiliates decreased to $10.9 million from
$15.4 million in 1999. The decrease resulted from increased ownership positions in some of our affiliates that
resulted in the subsequent consolidation of their income in our 2000 financial statements and non-cash losses
from restructuring actions taken by one of our affiliated companies.
4
13. In 1999, equity in affiliates decreased to $15.4 million from $20.5 million in 1998, primarily as a result of
increased ownership positions in some of our affiliates that resulted in their subsequent consolidation in our
1999 financial statements. Lower aggregate profits by the remaining affiliate companies accounted for by the
equity method also contributed to the decrease.
The increase in minority interest of $1.6 million in 2000 and $8.6 million in 1999 was primarily due to
acquisitions, including increased ownership positions in some of our affiliates that resulted in their subsequent
consolidation and greater earnings by subsidiaries where minority interests are held by third parties.
Earnings Per Share (EPS): Including the gain on sale of Razorfish shares, our consolidated net income
increased 37.5% to $498.8 million from $362.9 million in 1999 and our diluted earnings per share increased
35.8% to $2.73. Excluding the Razorfish gain, our net income increased 19.9% to $435 million and our diluted
EPS increased 19.4% to $2.40. The effect of translation of foreign currency to the US dollar on diluted EPS was
a decrease of $0.10 per share.
Our 1999 consolidated net income increased 30.1% to $362.9 million from $278.8 million in 1998.
Diluted EPS increased 28.0% to $2.01 from $1.57 in 1998. The effect of translation of foreign currency to the
US dollar on diluted EPS was a decrease of $0.06 per share.
Changes in the translation of foreign currencies to the U.S. dollar decreased our consolidated net income,
including Razorfish, by 3.7%, and 3.2% in 2000 and 1999, respectively.
Quantitative and Qualitative Disclosures Regarding Market Risk: Our results of operations are subject
to the risk of currency exchange rate fluctuations related to our international operations. This economic risk is
generally limited to the net income of the operations as the revenue and expenses of the operations are generally
denominated in the same currency. Our major international markets are the United Kingdom, Euro currency
countries, Brazil, Canada and Japan. We are also subject to interest rate risk on our commercial paper
borrowings. In some cases we enter into hedging transactions to mitigate the risk of adverse currency exchange
and interest rate fluctuations.
We periodically purchase derivative financial instruments as part of managing exposures to currency
exchange and market interest rates. Derivative financial instruments are subject to market and counterparty risk.
Market risk is the potential for loss resulting from changes in market conditions. We periodically determine the
potential loss from market risk by performing a value-at-risk computation. Value-at-risk analysis is a statistical
model that utilizes historic currency exchange and interest rate data to measure the potential impact on future
earnings of our existing portfolio of derivative financial instruments. The value-at-risk analysis we performed on
our December 31, 2000 portfolio of derivative financial instruments indicated that the risk of loss was
immaterial. Counterparty risk arises from the inability of a counterparty to meet its obligations. To mitigate
counterparty risk, we enter into derivative contracts with major financial institutions that have credit ratings at
least equal to our own.
Our derivative activities are limited in volume and confined to risk management activities related to our
worldwide operations. We have established a reporting system to evaluate the effects of changes in interest rates,
currency exchange rates and other relevant market risks. This system is designed to enable us to initiate
remedial action, if appropriate, and results are periodically reviewed with our audit committee. See Note 12 to
the Consolidated Financial Statements on pages F-20 to F-21 of this report for disclosure of the fair value of
each type of derivative.
At December 31, 2000, we had forward foreign exchange contracts outstanding with an aggregate
notional principal amount of $254 million, most of which were denominated in our major international market
currencies. These contracts predominantly hedge certain intercompany receivables and payables which are not
recorded in the respective company’s functional currency. The terms of these contracts are generally three
months or less. At December 31, 2000, we had Japanese yen 16.3 billion aggregate notional principal amount of
cross currency interest rate swaps. The swaps hedge our net investment in Japanese yen denominated assets. At
December 31, 2000, we had no other derivative contracts outstanding.
Capital Resources and Liquidity
We had cash and cash equivalents totalling $516.8 million and $576.4 million at December 31, 2000 and
1999, respectively. Net cash provided by our operating activities was $685.9 million in 2000 compared to
$972.6 million in 1999, reflecting revenue and net income growth offset by a decline in the increase to accounts
5
14. payable and an increase in prepaid expenses related primarily to an increase in current deferred tax assets. Our
operating cash flows are impacted by the spending patterns of clients.
Cash flows used in our investing activities in 2000 were $1,034.6 million and included $884.3 million
used for acquisitions and investments, net of cash acquired and proceeds from sales of investments, and $150.3
million used for capital expenditures.
Cash flows from our financing activities in 2000 were $282.1 million and included net borrowings of
$731.5 million and proceeds from employee stock plans of $50.0 million, offset by dividends paid to
shareholders, and net loans to affiliates and minority interests totalling $262.3 million and payments to
repurchase stock totalling $237.1 million.
In February 2001, we completed the issuance of $850 million aggregate principal amount of Liquid Yield
Option Notes (“LYONs”) due February 7, 2031. The net proceeds from the LYONs offering were $830.2
million. The LYONs are unsecured, unsubordinated zero-coupon securities that may be converted into our
common shares, subject to specified conditions relating to the price of our common shares. The initial
conversion price is $110.01 per share subject to antidilutive adjustment. We may be required to purchase the
LYONs after February 7, 2002 using, at our election, cash or common stock or a combination of both and we
have the option of redeeming the LYONs after February 7, 2006 for cash. In addition, we may be obligated to
pay contingent cash interest after February 7, 2006, if our stock price reaches specified thresholds, equal to the
amount of dividends we pay to common shareholders during specified six-month periods.
In the fourth quarter of 2000, we redeemed our 41⁄4% Convertible Subordinate Debentures, which had a
scheduled maturity in 2007. The debentures were convertible into our common stock at a conversion price of
$31.50 per share, subject to adjustments in certain events. Prior to redemption, substantially all of the
bondholders exercised the conversion rights and 6.9 million of our common shares were issued. The conversion
had no impact to diluted earnings per share for the year. These debentures were issued in 1997.
We maintain two revolving credit facilities with consortiums of banks. One facility, for $500 million,
expires June 30, 2003 and the other, for $1 billion, expires April 26, 2001. We have the option at maturity to
extend and convert the $1 billion facility to a one-year term loan. We intend to renew this facility for an
additional year and we have notified the banks of our request, which we believe will be accepted. Under the
terms of these facilities, we may either borrow directly or issue commercial paper. During 2000, we issued
$13.4 billion of commercial paper and we redeemed $12.6 billion of commercial paper. The average term of the
commercial paper was 21 days. At December 31, 2000, $831.5 million of commercial paper was outstanding at
interest rates ranging from 6.65% to 6.80%.
From time to time we have completed other financings when we have felt that conditions in the capital
markets were favorable. Information about our other debt is included in Notes 3 and 7 of our Notes to
Consolidated Financial Statements at pages F-11 and F-16 to F-17 of this report. Last year, we increased the
amount of securities registered under shelf registration statements with the SEC to $1 billion in the aggregate. The
shelf filings provide for the issuance of debt or equity securities from time to time, either directly or in acquisitions.
We believe that our operating cash flow combined with our access to the capital markets and available
lines of credit are sufficient to support our foreseeable cash requirements, including dividends, capital
expenditures, acquisitions and working capital.
8. Financial Statements and Supplementary Data
Our financial statements and supplementary data are included at the end of this report beginning on page
F-1 of this report. See the index appearing on page 8 of this report.
9. Changes in and Disagreements with Accountants on Accounting and Financial Disclosure
None
6
15. PART III
Executive Officers
Our executive officers are:
Name Position Age
__________ ______________ _______
Bruce Crawford . . . . . . . . . . . Chairman 72
John D. Wren . . . . . . . . . . . . . President and Chief Executive Officer 48
Randall J. Weisenburger . . . . . Executive Vice President and Chief Financial Officer 42
Peter Mead . . . . . . . . . . . . . . . Vice Chairman 62
Barry J. Wagner . . . . . . . . . . . Secretary and General Counsel 60
Robert Profusek . . . . . . . . . . . Executive Vice President 50
Philip J. Angelastro . . . . . . . . Controller 36
Allen Rosenshine . . . . . . . . . . Chairman and Chief Executive Officer of BBDO Worldwide 62
James A. Cannon . . . . . . . . . . Vice Chairman and Chief Financial Officer of BBDO Worldwide 62
Keith L. Reinhard . . . . . . . . . . Chairman and Chief Executive Officer of DDB Worldwide 66
Thomas L. Harrison . . . . . . . . Chairman and Chief Executive Officer of Diversified Agency Services 53
All of the executive officers have held their present positions at Omnicom for at least five years except as
specified below.
John Wren was appointed Chief Executive Officer of the Company effective January 1, 1997, succeeding
Bruce Crawford in the position. He had previously been President of the Company and Chairman of our
Diversified Agency Services Division.
Randall Weisenburger joined the Company in September 1998 and became Executive Vice President and
Chief Financial Officer on January 1, 1999. Mr. Weisenburger was previously President and Chief Executive
Officer of Wasserstein Perella Management Partners, a merchant bank.
Peter Mead was appointed Vice Chairman on May 16, 2000. He had previously been Group Chief
Executive of Abbot Mead Vickers plc and Joint Chairman of AMV BBDO.
Philip Angelastro was promoted to Controller February 1, 1999. Mr. Angelastro joined the Company in
June 1997 as Vice President of Finance of Diversified Agency Services after being a Partner at Coopers &
Lybrand LLP.
Robert Profusek joined the Company on May 15, 2000 as Executive Vice President and assumed oversight
responsibilities for corporate administrative matters in March 2001. He previously headed the transactional
practice group of Jones, Day, Reavis & Pogue, a global law firm.
Thomas Harrison has served as Chairman and Chief Executive Officer of the Diversified Agency Services
since May 1998, having previously served as its President since February 1997. He also has served as Chairman
of the Diversified Healthcare Communications Group since its formation in 1994.
Additional information about our directors and executive officers appears under the captions “Election of
Directors,” “Management’s Stock Ownership,” “Director Compensation” and “Executive Compensation” in our
2001 proxy statement.
7
16. PART IV
14. Exhibits, Financial Statement Schedules, and Reports on Form 8-K
(a)(1) Financial Statements: Page
_____
Management Report .......................................................................................................................... F-1
Report of Independent Public Accountants ........................................................................................ F-2
Consolidated Statements of Income for the Three Years Ended December 31, 2000 ...................... F-3
Consolidated Balance Sheets at December 31, 2000 and 1999 ........................................................ F-4
Consolidated Statements of Shareholders’ Equity for the Three Years Ended
December 31, 2000 ........................................................................................................................ F-5
Consolidated Statements of Cash Flows for the Three Years Ended
December 31, 2000 ........................................................................................................................ F-6
Notes to Consolidated Financial Statements ...................................................................................... F-7
Quarterly Results of Operations (Unaudited) .................................................................................... F-23
(a)(2) Financial Statement Schedules:
Schedule II — Valuation and Qualifying Accounts (for the three years ended
December 31, 2000)........................................................................................................................ S-1
All other schedules are omitted because they are not applicable.
(a)(3) Exhibits:
Exhibit
Numbers Description
______ ________
(3)(i) Certificate of Incorporation (Exhibit 4.1 to our Registration Statement No. 333-46303 and
incorporated herein by reference).
(ii) Amendment to Certificate of Incorporation (Exhibit A to our 2000 Proxy Statement filed on
April 11, 2000 and incorporated herein by reference).
(iii) By-laws (incorporated by reference to our Annual Report on Form 10-K for the year ended
December 31, 1987).
4.1 Subscription Agreement, dated December 14, 1994, in connection with our issuance of DM
200,000,000 Floating Rate Bonds due January 5, 2000 of BBDO Canada Inc., including
form of Guaranty by us (Exhibit 4.2 to our Annual Report on Form 10-K for the year ended
December 31, 1994 (the “1994 10-K”) and incorporated herein by reference).
4.2 Paying Agency Agreement, dated January 4, 1995, in connection with the issuance of DM
200,000,000 Floating Rate Bonds due January 5, 2000 by BBDO Canada Inc. (Exhibit 4.3 to
the 1994 10-K and incorporated herein by reference).
4.3 Indenture, dated January 3, 1997, between The Chase Manhattan Bank, as trustee, and us in
connection with the issuance of our 41⁄4% Convertible Subordinated Debentures due 2007
(Exhibit 4.2 to our Form S-3 Registration Statement No. 333-22589 (the “41⁄4% Convert
Registration Statement”) and incorporated herein by reference).
4.4 Form of Debentures (included in Exhibit 4.3 above) (Exhibit 4.3 to our 41⁄4% Convert
Registration Statement and incorporated herein by reference).
4.5 Registration Rights Agreement, dated January 3, 1997, related to our 41⁄4% Convertible
Subordinated Debentures due 2007 (Exhibit 4.4 to our 41⁄4% Convert Registration Statement
and incorporated herein by reference).
4.6 Indenture, dated January 6, 1998, between The Chase Manhattan Bank, as trustee, and us in
connection with our issuance of 21⁄4% Convertible Subordinated Debentures due 2013
(Exhibit 4.1 to our Report on Form 8-K, dated January 20, 1998 (the “1-20-98 8-K”) and
incorporated herein by reference).
4.7 Form of Debentures (included in Exhibit 4.8 above) (Exhibit 4.2 to our 1-20-98 8-K and
incorporated herein by reference).
8
17. 4.8 Registration Rights Agreement, dated January 6, 1998, related to our 21⁄4% Convertible
Subordinated Debentures due 2013 (Exhibit 4.3 to our 1-20-98 8-K and incorporated herein
by reference).
4.9 Fiscal Agency Agreement, dated June 24, 1998, in connection with our issuance of
1,000,000,000 5.20% Notes due 2005 (the “5.20% Notes”) (Exhibit 4.1 to our Quarterly
Report on Form 10-Q for the quarter ended June 30, 1998 (“the 6-30-98 10Q”) and
incorporated herein by reference).
4.10 Subscription Agreement, dated June 22, 1998, in connection with our issuance of the 5.20%
Notes (Exhibit 4.2 to our 6-30-98 10-Q and incorporated herein by reference).
4.11 Deed of Covenant, dated June 24, 1998, in connection with our issuance of the 5.20% Notes
(Exhibit 4.3 to the 6-30-98 10-Q and incorporated herein by reference).
4.12 Indenture, dated February 7, 2001, between Chase Manhattan Bank, as trustee, and us in
connection with our issuance of $850,000,000 Liquid Yield Option Notes due 2031 (Exhibit
4.1 to our Registration Statement No. 333-55386 and incorporated herein by reference).
10.1 Amendment No. 1, dated July 7, 2000, to $500,000,000 Amended and Restated Credit
Agreement, dated as of February 20, 1998, among Omnicom Finance Inc., Omnicom
Finance PLC, Omnicom Capital Inc., Omnicom Group Inc., ABN AMRO Bank N.V., New
York Branch and the financial institutions party thereto (Exhibit 10-2 to our quarterly report
on Form 10-Q for the quarter ended June 30, 2000 (the “6-30-00 10-Q”) and incorporated
herein by reference).
10.2 Second Amendment and Restatement, dated as of July 31, 2000, of the 364-Day Credit
Agreement, dated as of April 30, 1999, amended and restated as of April 27, 2000, among
Omnicom Finance Inc., Omnicom Finance PLC, Omnicom Capital Inc., the financial
institutions party thereto, Citibank, N.A., The Bank of Nova Scotia and San Paolo IMI SPA,
as syndication agent (Exhibit 10-3 to our 6-30-00 10-Q and incorporated herein by reference).
10.3 List of Contents of Exhibits to the 364-Day Credit Agreement, dated as of April 30, 1999
(Exhibit 10.2 to our quarterly report on Form 10-Q for the quarter ended March 31, 1999
(the “3-31-99 10-Q”) and incorporated herein by reference).
10.4 Guaranty, dated as of April 30, 1999, made by Omnicom Group Inc. (Exhibit 10.3 to our
3-31-99 10-Q and incorporated herein by reference).
10.5 Amended and Restated 1998 Incentive Compensation Plan, (Exhibit B to our Proxy
Statement, dated April 11, 2000, and incorporated herein by reference).
10.6 Restricted Stock Plan for Non-employee Directors (Exhibit 10.10 to our Annual Report on
Form 10-K for the year ended December 31, 1999).
10.7 Standard form of our Executive Salary Continuation Plan Agreement (Exhibit 10.24 to our
Annual Report on Form 10-K for the year ended December 31, 1998 and incorporated
herein by reference).
10.8 Standard form of the our Director Indemnification Agreement (Exhibit 10.25 to our Annual
Report on Form 10-K for the year ended December 31, 1989 and incorporated herein by
reference).
10.9 Severance Agreement, dated July 6, 1993, between Keith Reinhard and DDB Worldwide
Communications Group, Inc. (Exhibit 10.11 to our Annual Report on Form 10-K for the
year ended December 31, 1993 and incorporated herein by reference).
21.1 Subsidiaries of the Registrant.
23.1 Consent of Arthur Andersen LLP.
24.1 Powers of Attorney from Richard I. Beattie, Bernard Brochand, Robert J. Callander, James
A. Cannon, Leonard S. Coleman, Jr., Bruce Crawford, Susan S. Denison, Peter Foy, Michael
Greenlees,Thomas L. Harrison, John R. Murphy, John R. Purcell, Keith L. Reinhard, Linda
Johnson Rice, Allen Rosenshine and Gary L. Roubos.
(b) Reports on Form 8-K:
We did not file any reports on Form 8-K during the fourth quarter of 2000.
9
18. SIGNATURES
Pursuant to the requirements of Section 13 or 15(d) of the Securities Exchange Act of 1934, the
Registrant has duly caused this report to be signed on its behalf by the undersigned, thereunto duly
authorized.
OMNICOM GROUP INC.
March 26, 2001
By: /s/ RANDALL J. WEISENBURGER
Randall J. Weisenburger
Executive Vice President and Chief Financial Officer
Pursuant to the requirements of the Securities Exchange Act of 1934, this report has been signed
below by the following persons on behalf of the Registrant and in the capacities and on the dates
indicated.
Signature Title Date
_________________ ________ _________
/s/ BRUCE CRAWFORD* Chairman and Director March 26, 2001
(Bruce Crawford)
/s/ JOHN D. WREN Chief Executive Officer March 26, 2001
and President and Director
(John D. Wren)
/s/ RANDALL J. WEISENBURGER Executive Vice President and March 26, 2001
Chief Financial Officer
(Randall J. Weisenburger)
/s/ PHILIP J. ANGELASTRO Controller (Principal March 26, 2001
Accounting Officer)
(Philip J. Angelastro)
/s/ RICHARD I. BEATTIE* Director March 26, 2001
(Richard I. Beattie)
Director
(Bernard Brochand)
/s/ ROBERT J. CALLANDER* Director March 26, 2001
(Robert J. Callander)
/s/ JAMES A. CANNON* Director March 26, 2001
(James A. Cannon)
/s/ LEONARD S. COLEMAN, JR.* Director March 26, 2001
(Leonard S. Coleman, Jr.)
/s/ SUSAN S. DENISON* Director March 26, 2001
(Susan S. Denison)
/s/ PETER FOY* Director March 26, 2001
(Peter Foy)
/s/ MICHAEL GREENLEES* Director March 26, 2001
(Michael Greenlees)
/s/ THOMAS L. HARRISON* Director March 26, 2001
(Thomas L. Harrison)
Director
(John R. Murphy)
/s/ JOHN R. PURCELL* Director March 26, 2001
(John R. Purcell)
/s/ KEITH L. REINHARD* Director March 26, 2001
(Keith L. Reinhard)
/s/ LINDA JOHNSON RICE* Director March 26, 2001
(Linda Johnson Rice)
/s/ ALLEN ROSENSHINE* Director March 26, 2001
(Allen Rosenshine)
/s/ GARY L. ROUBOS* Director March 26, 2001
(Gary L. Roubos)
*By /s/ BARRY J. WAGNER March 26, 2001
Barry J. Wagner
Attorney-in-fact
10
19. MANAGEMENT REPORT
Omnicom Group Inc. management is responsible for the integrity of the financial data reported by
Omnicom. Management uses its best judgement to ensure that the financial statements present fairly, in all
material respects, Omnicom’s consolidated financial position and results of operations. These financial
statements have been prepared in accordance with accounting principles generally accepted in the United States.
Omnicom’s system of internal controls, augmented by a program of internal audits, is designed to provide
reasonable assurance that assets are safeguarded and records are maintained to substantiate the preparation of
financial information in accordance with accounting principles generally accepted in the United States.
Underlying this concept of reasonable assurance is the premise that the cost of control should not exceed the
benefits derived therefrom.
The financial statements have been audited by independent public accountants. Their report expresses the
independent accountant’s judgement as to the fairness of management’s reported operating results, cash flows
and financial position. This judgement is based on the procedures described in the second paragraph of their
report.
Omnicom’s Audit Committee meets periodically with representatives of financial management, internal
audit and the independent public accountants to assure that each group believes they are properly discharging
their responsibilities. To aid in ensuring independence, the Audit Committee communicates directly and
separately with the independent public accountants, internal audit and financial management to discuss the
results of their audits, the adequacy of internal accounting controls and the quality of financial reporting.
/s/ JOHN D. WREN /s/ RANDALL J. WEISENBURGER
________________________________________ _________________________________________
John D. Wren Randall J. Weisenburger
Chief Executive Officer and President Executive Vice President and Chief Financial Officer
February 15, 2001
F-1
20. REPORT OF INDEPENDENT PUBLIC ACCOUNTANTS
To the Board of Directors and
Shareholders of Omnicom Group Inc.:
We have audited the accompanying consolidated balance sheets of Omnicom Group Inc. (a New York
corporation) and subsidiaries as of December 31, 2000 and 1999, and related consolidated statements of
income, shareholders’ equity, and cash flows for each of the three years in the period ended December 31, 2000.
These consolidated financial statements and the schedule referred to below are the responsibility of the
Company’s management. Our responsibility is to express an opinion on these consolidated financial statements
and schedule based on our audits.
We conducted our audits in accordance with auditing standards generally accepted in the United States.
Those standards require that we plan and perform the audit to obtain reasonable assurance about whether the
financial statements are free of material misstatement. An audit includes examining, on a test basis, evidence
supporting the amounts and disclosures in the financial statements. An audit also includes assessing the
accounting principles used and significant estimates made by management, as well as evaluating the overall
financial statement presentation. We believe that our audits provide a reasonable basis for our opinion.
In our opinion, the financial statements referred to above present fairly, in all material respects, the
financial position of Omnicom Group Inc. and subsidiaries as of December 31, 2000 and 1999, and the results
of their operations and their cash flows for each of the three years in the period ended December 31, 2000 in
conformity with accounting principles generally accepted in the United States.
Our audits were made for the purpose of forming an opinion on the basic financial statements taken as a
whole. The schedule on page S-1 is presented for purposes of complying with the Securities and Exchange
Commission’s rules and is not part of the basic financial statements. This schedule has been subjected to the
auditing procedures applied in the audits of the basic financial statements and, in our opinion, fairly states in all
material respects the financial data required to be set forth therein in relation to the basic financial statements
taken as a whole.
ARTHUR ANDERSEN LLP
New York, New York
February 15, 2001
F-2
21. OMNICOM GROUP INC. AND SUBSIDIARIES
CONSOLIDATED STATEMENTS OF INCOME
Years Ended December 31,
(Dollars in Thousands
Except Per Share Data)
____________________________________
2000 1999 1998
____ ____ ____
REVENUE .................................................................................. $6,154,230 $5,130,545 $4,290,946
OPERATING EXPENSES:
Salaries and related costs ........................................................ 3,633,357 3,054,018 2,558,694
Office and general expenses .................................................. 1,642,783 1,352,397 1,170,045
__________________ __________________ __________________
5,276,140 4,406,415 3,728,739
__________________ __________________ __________________
OPERATING PROFIT................................................................ 878,090 724,130 562,207
REALIZED GAIN ON SALE OF RAZORFISH SHARES ...... 110,044 — —
NET INTEREST EXPENSE ...................................................... 76,517 50,422 40,410
__________________ __________________ __________________
INCOME BEFORE INCOME TAXES ...................................... 911,617 673,708 521,797
INCOME TAXES ...................................................................... 369,140 273,247 219,092
__________________ __________________ __________________
INCOME AFTER INCOME TAXES ........................................ 542,477 400,461 302,705
EQUITY IN AFFILIATES.......................................................... 10,914 15,368 20,506
MINORITY INTERESTS .......................................................... (54,596) (52,947) (44,366)
__________________ __________________ __________________
NET INCOME ............................................................................ $ 498,795 $ 362,882 $ 278,845
__________________ __________________ __________________
__________________ __________________ __________________
NET INCOME PER COMMON SHARE:
Basic........................................................................................ $ 2.85 $ 2.07 $ 1.61
Diluted .................................................................................... $ 2.73 $ 2.01 $ 1.57
The accompanying notes to consolidated financial statements are an integral part of these statements.
F-3
22. OMNICOM GROUP INC. AND SUBSIDIARIES
CONSOLIDATED BALANCE SHEETS
ASSETS
December 31,
(Dollars in Thousands)
________________________
2000 1999
________ ________
CURRENT ASSETS:
Cash and cash equivalents .................................................................................... $ 516,817 $ 576,427
Short-term investments at market, which approximates cost .............................. 59,722 41,760
Accounts receivable, less allowance for doubtful accounts of
$72,745 and $53,720 (Schedule II).................................................................. 3,857,182 3,358,304
Billable production orders in process, at cost ...................................................... 403,565 299,209
Prepaid expenses and other current assets ............................................................ _________ 529,597 453,862
_________
Total Current Assets .............................................................................................. 5,366,883 4,729,562
FURNITURE, EQUIPMENT AND LEASEHOLD IMPROVEMENTS, at cost, less
accumulated depreciation and amortization of $557,210 and $522,294 .............. 483,105 444,722
INVESTMENTS IN AFFILIATES........................................................................................ 432,664 367,755
INTANGIBLES, less accumulated amortization of $410,396 and $352,081 ................ 2,948,821 2,414,941
DEFERRED TAX BENEFITS ............................................................................................ 136,196 120,346
LONG-TERM INVESTMENTS AVAILABLE-FOR-SALE ...................................................... 79,554 785,406
DEFERRED CHARGES AND OTHER ASSETS .................................................................. _________ 444,276 154,905
_________
$9,891,499 $9,017,637
_________ _________
_________ _________
L I A B I L I T I E S A N D S H A R E H O L D E R S’ E Q U I T Y
CURRENT LIABILITIES:
Accounts payable .................................................................................................. $4,351,039 $4,112,777
Current portion of long-term debt ........................................................................ 29,307 82,621
Bank loans ............................................................................................................ 72,813 47,748
Advance billings .................................................................................................. 630,502 417,044
Accrued taxes on income ...................................................................................... 159,238 77,584
Other accrued taxes .............................................................................................. 167,898 154,825
Other accrued liabilities ........................................................................................ 1,183,199 1,085,323
Dividends payable ................................................................................................ _________31,056 31,141
_________
Total Current Liabilities ........................................................................................ _________
6,625,052 6,009,063
_________
LONG-TERM DEBT ...................................................................................................... 1,015,419 263,149
CONVERTIBLE SUBORDINATED DEBENTURES ................................................................ 229,968 448,483
DEFERRED COMPENSATION AND OTHER LIABILITIES .................................................... 296,921 300,746
DEFERRED INCOME TAXES ON UNREALIZED GAINS...................................................... 37,792 320,176
MINORITY INTERESTS .................................................................................................. 137,870 123,122
COMMITMENTS AND CONTINGENT LIABILITIES (NOTE 10)
SHAREHOLDERS’ EQUITY:
Preferred stock, $1.00 par value, 7,500,000 shares authorized, none issued ...... — —
Common stock, $.15 and $.50 par value in 2000 and 1999, respectively,
1,000,000,000 and 300,000,000 shares authorized in 2000 and 1999,
respectively, 194,102,812 and 187,086,161 shares issued in 2000
and 1999, respectively...................................................................................... 29,115 93,543
Additional paid-in capital .................................................................................... 1,166,076 808,154
Retained earnings.................................................................................................. 1,258,568 882,051
Unamortized restricted stock ................................................................................ (119,796) (85,919)
Accumulated other comprehensive (loss) income ................................................ (232,063) 285,234
Treasury stock, at cost, 10,023,674 and 9,598,602 shares in
2000 and 1999, respectively ............................................................................ _________ (553,423) (430,165)
_________
Total Shareholders’ Equity .............................................................................. _________ 1,548,477 1,552,898
_________
$9,891,499 $9,017,637
_________ _________
_________ _________
The accompanying notes to consolidated financial statements are an integral part of these statements.
F-4