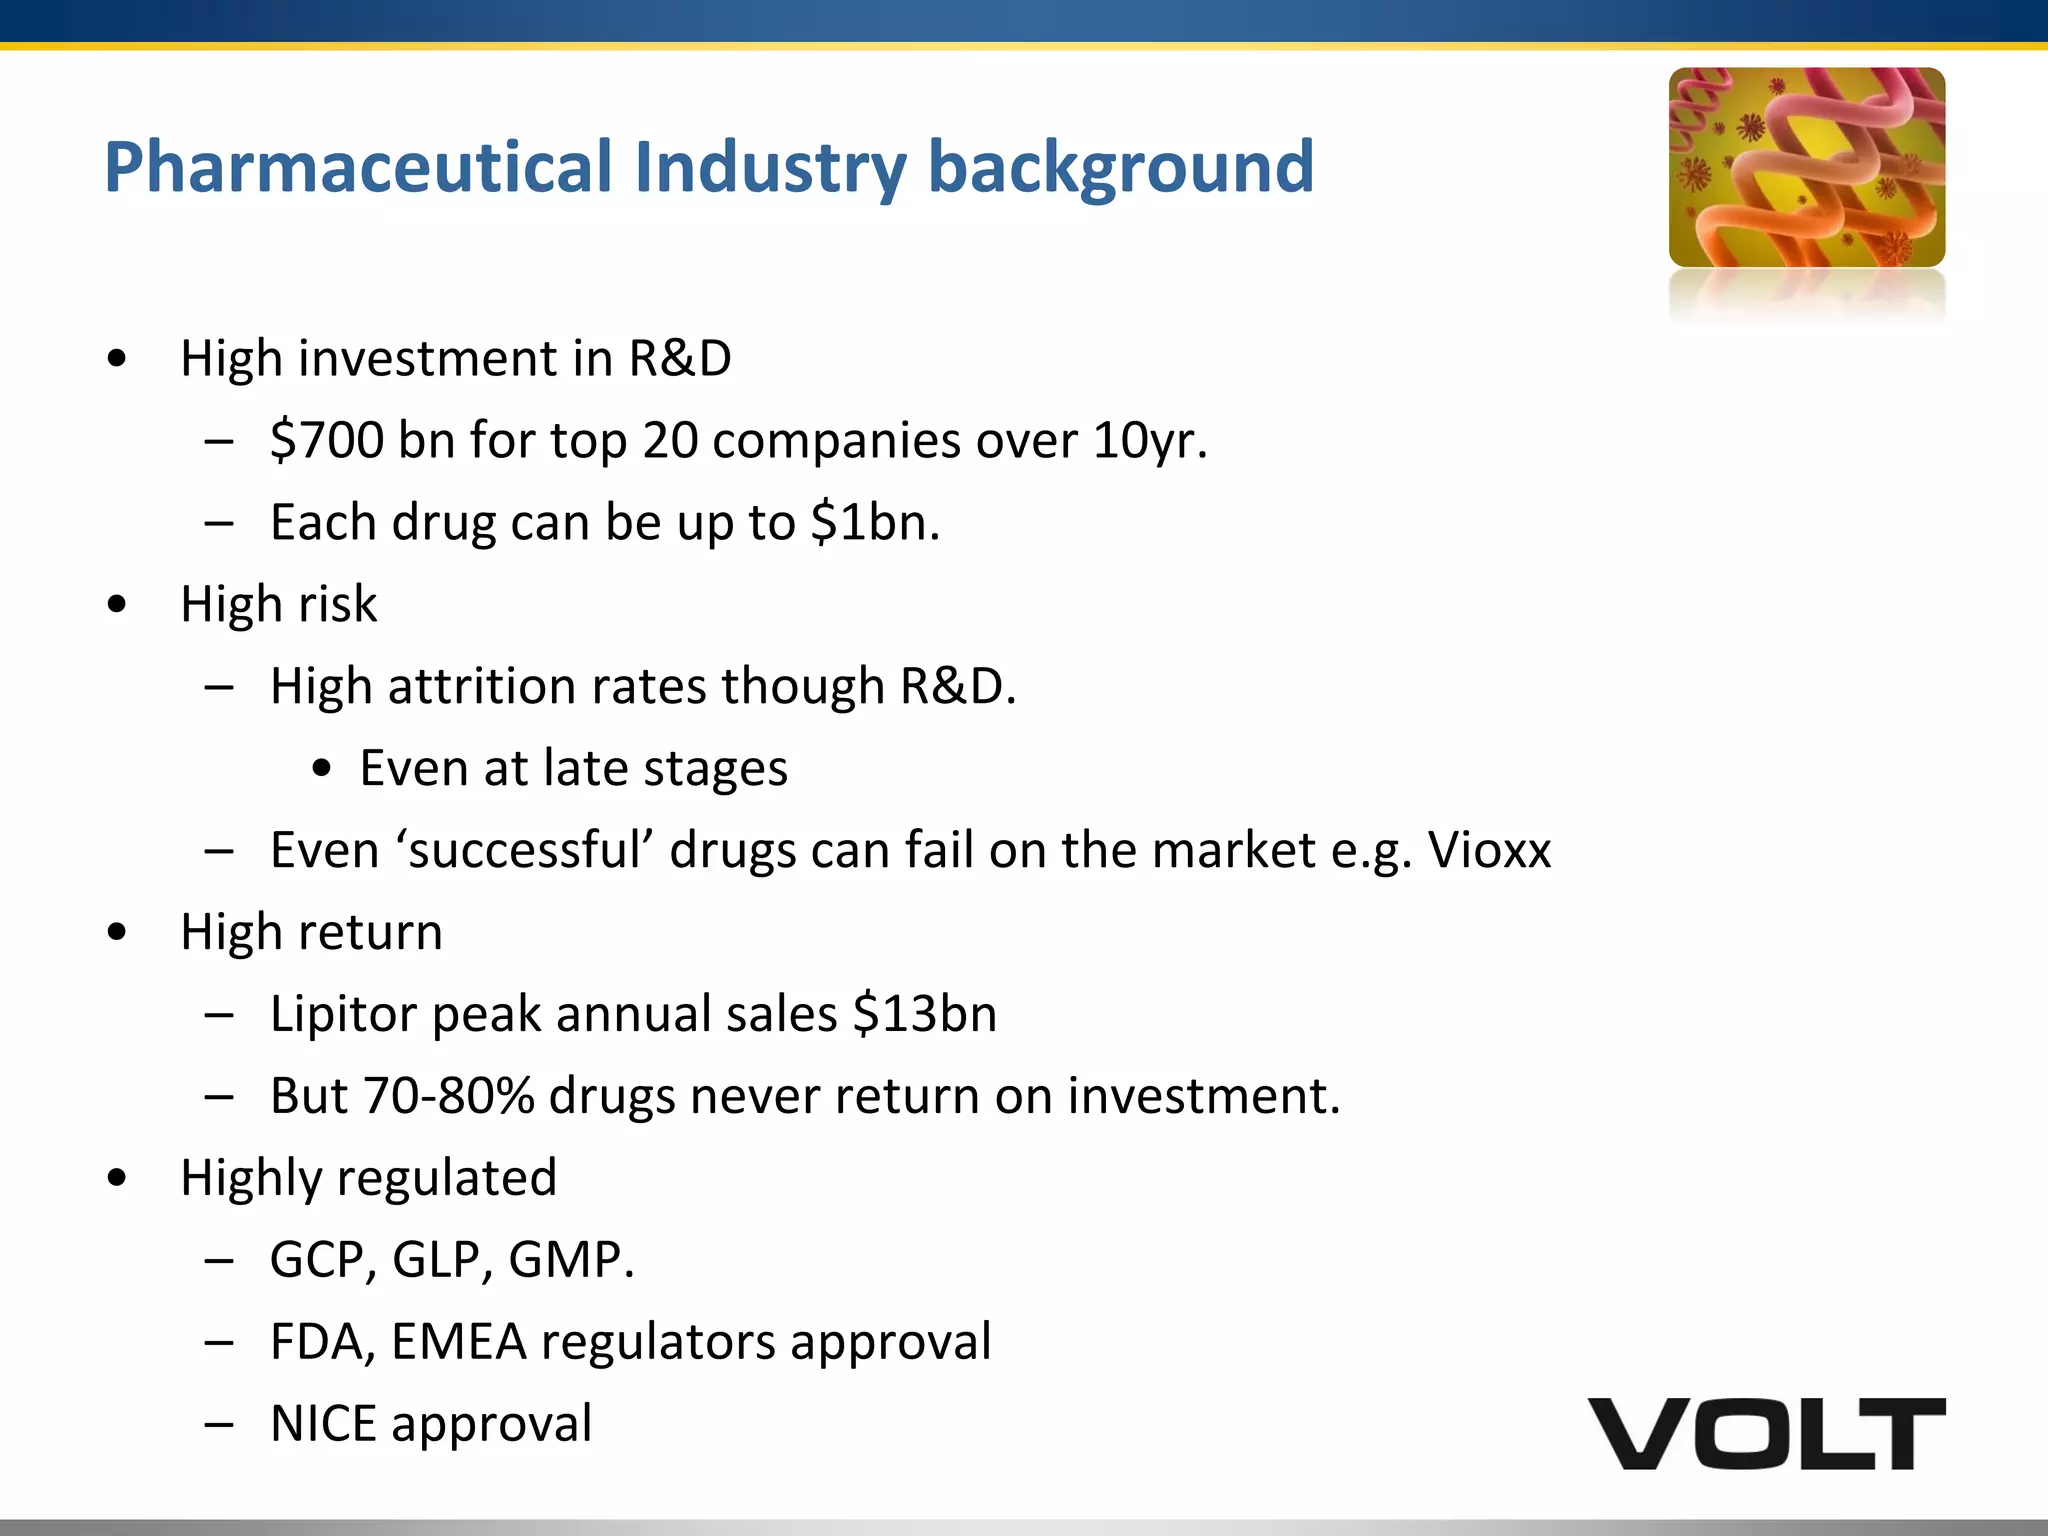
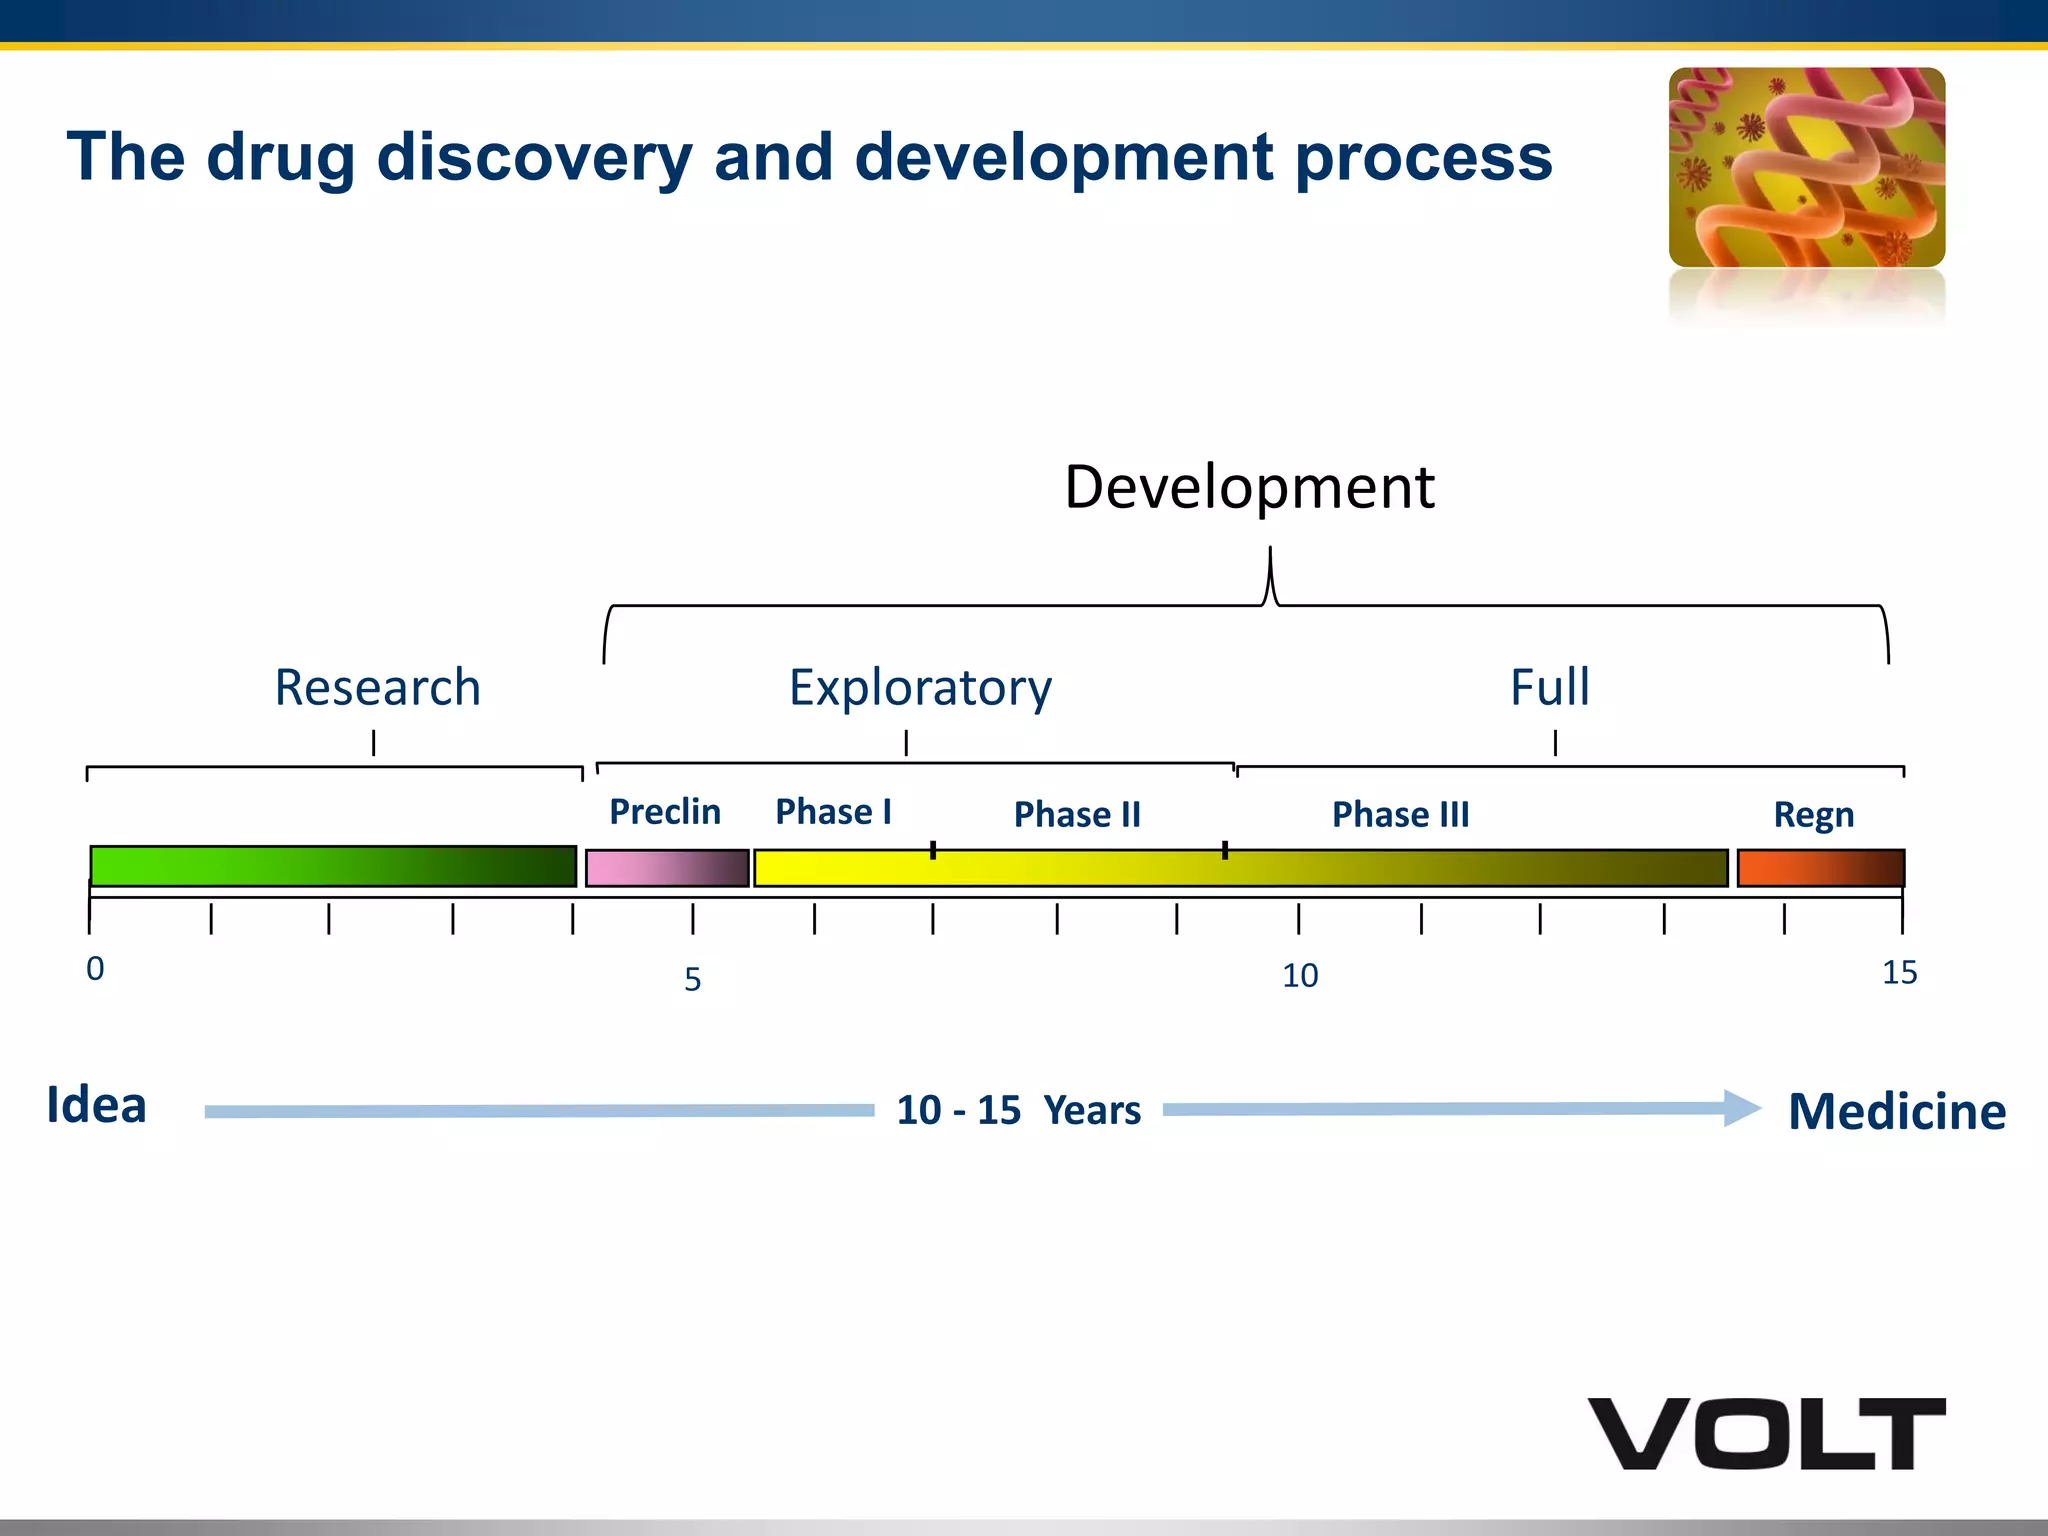
©2012 Volt. All rights reserved. Proprietary & Confidential.
Portfolio Management in the
Pharmaceutical Industry.
Dr John Bennett
APM Presentation
!0th June 2014
Overview
• Brief overview of the Pharmaceutical Portfolio environment.
– What is the R&D process?
– What are the industry challenges?
• Pharmaceutical Portfolio Management
– Is it unique?
Pharmaceutical Industry background
• High investment in R&D
– $700 bn for top 20 companies over 10yr.
– Each drug can be up to $1bn.
• High risk
– High attrition rates though R&D.
• Even at late stages
– Even ‘successful’ drugs can fail on the market e.g. Vioxx
• High return
– Lipitor peak annual sales $13bn
– But 70-80% drugs never return on investment.
• Highly regulated
– GCP, GLP, GMP.
– FDA, EMEA regulators approval
– NICE approval
The drug discovery and development process
Medicine
0
Idea 10 - 15 Years
Research Exploratory Full
Phase I Phase II Phase III
155 10
Development
RegnPreclin
Clinical Development Phase Characteristics
Healthy
volunteers
Patients
Safety Efficacy, Safety,
Dose & Regimen
Efficacy, Safety,
Comparative performance,
Health Economics
Phase I Phase IIIPhase II
10s 100s 1000s (up to 25k)
Patients
Local National / Regional Global
< $1m $1.0 - $10m $10 – $500m
Drug Development is Risky
Candidate Attrition
0
4
12
25
No.candidates
0 1 2 3 4 5 6 7 8 9 Years
Preclin. Phase I Phase II Phase III Registration
animal toxicity,
chemical stability,
efficacy/safety,
differentiation,
human PK,
toleration,
formulation
long-term safety non-approval
On average, it takes 25 drug
candidates to yield one
marketed product
Pre-clin Phase I Phase II Phase III Approval / Launch
Survival of candidates and cost of development
Cost at launch approx. 50% of total spend.
Evolving needs for Industry
• Well known industry wide challenges
– Productivity
– Escalating costs
– Pressure on R&D budgets
– Risk
• Evolving market conditions
– Continued price pressures
– Technology assessment groups
– Competition
– No longer sufficient to get market approval
Evolving needs for Industry
• More opportunities than resources.
– Reductions in R&D budgets.
– Focus on areas of high promise.
• More important than ever to ‘do the right projects’
– ‘Optimised’ portfolio content.
View of Portfolio Management
Doing the right
projects
Doing the projects
right
The right people
doing the right things
at the right time
Portfolio
Management
Program & Project
Management
Work
Management
Developing the framework: example model
Each project is
scored against each
attribute
Weights are
applied to each
attribute
Each project has an
overall score
(weighted sum of
attributes)
Graphics show
up strengths
and weaknesses
of each project
Can explore how project ranking changes with different scores
and weights on attributes. This will highlight those projects that
always remain attractive under different scenarios, and it will also
flag areas of weakness to address in individual projects
This understanding supports project funding decisions
Efficient Frontier as a portfolio tool
Investment Efficiency Chart
Project 1
Project 2
Project 3
Project 4
Project 5
Project 6
Project 8
Project 7-
Project 9
Project 10
Project 11
Project 12
0
500
1000
1500
2000
2500
3000
0 100 200 300 400 500
Cumulative eCosts, $m
CumulativeeNPV,$m
Portfolio Value assessment
Baseline - August 200x Target Forecast - August 200y
Program Name Phase PTRS eNPV ePI Phase PTRS eNPV ePI
1 P I 5% 204.6$ 14.8 P IIa 7% 289.2$ 19.5
2 P IIa 29% 15.5$ 0.9 P III 29% 19.3$ 1.2
3 P IIa 33% 154.2$ 6.4 P IIa 33% 179.3$ 10.7
4 P IIa 19% 835.0$ 20.1 P IIb 54% 2,733.6$ 26.6
5 P IIb 8% (1.2)$ (0.0) P IIb 8% 4.8$ 0.2
6 P IIb 58% 505.0$ 9.5 P IIb 58% 575.1$ 14.9
7 Ph III 85% 122.1$ 30.4 Reg 85% 138.3$ 327.8
8 Ph III 42% 724.8$ 33.7 Reg 60% 1,167.3$ 212.6
9 Reg 85% 76.1$ 19.1 Launch 100% 103.6$ N/A
10 Reg 90% 351.2$ 285.1 Reg 90% 387.2$ 996.2
Total Baseline: 2,987.2$ 14.2
Key:
= Projected Phase changes from Aug to Aug
What is Portfolio Management?
Quality
Tools
Governance
Process
Objectives
Data
Stakeholders
Constraints Priorities
Politics
Risk
Investment
Value
Strategy
Goals
Decision Making
Resources
Metrics
Deliver the
highest value
Its more than the maths
Finance
Portfolio Info
Prioritization
Project
Information
FTEs
Portfolio Management
•Strategy Alignment
•Delivery Against goals
•Resource Management
•Governance
•Project & Protocol Prioritization
Organizational
Performance
•Performance Metrics
•Performance Targets
•Performance Gaps
Candidate Team
Project
Management
•Project details
•Schedules
•Issues
•Risks
•Resource Demand
Portfolio Management, Project Management, Governance
& Performance Management Are Integrated
Portfolio R&D Productivity
Pharmaceutical Portfolio characteristics
• High degree of uncertainty.
– Project level
• Science / experiment driven – many projects fail.
• Changes of direction not infrequent (e.g. Viagra)
– Activity level
• E.g clinical trials
• Dynamic
– Projects entering and leaving continuously
• Multi-year projects – annual budgets.
– Balancing across the portfolio.
• Mix of early and late development entities.
– Very different characteristics.
• Inevitable ‘gaps’ in pipeline delivery
We’ve ‘chosen’ the portfolio – now what?
Managing a dynamic drug portfolio.
• Clear and agreed priorities.
• Attrition based budget.
• Agile decision making.
Clear and agreed priorities
• Process and tools to define the ‘Priority List’
– Critical but not sufficient.
• Ability to translate priorities into consistent action
– Business rules for projects
• ‘High’ = continuously seeking buy up opportunities to reduce risk
and or time and quality. Plan for success.
• ‘Low’ = deliver to agreed plan, seek opportunities to reduce time if
no additional resource required. Plan to nearest risk inflection point
only.
– Dialogue with service providers
• Internal – sequencing of activities
• Priority v urgency of activity.
‘Attrition’ based budgeting
• Many companies underspend annual budget.
• Failure to take loss of projects and inevitable delays into account
– If 10 early projects start the year – 5 will die by year end……
• Start the year with demand higher than budget.
– Manage the difference through the year.
– What buy up and buy down options are available?
– What would the impact be on goals, etc?
– What is the ‘best by’ date for options?
• Use priorities to guide early in year investments
Agile decision making
• Portfolio management is an ongoing, day to day, active process.
– It cannot be done as an annual review.
– Impossible to allocate resource to projects on an annual basis.
– Its never perfect.
• Clear decision authority
– Governance – project team – functional line.
– Respect for decision rules
• With emerging data, confidence and priorities can change dramatically.
– What mechanisms are in place to check on allocation against priority
and urgency?
• Mechanisms to understand impact of decisions and options.
– Opportunity to in-licence new drug candidate – but if we allocate
resources to it – what happens to the current portfolio?
This presentation was delivered
at an APM event
To find out more about
upcoming events please visit our
website www.apm.org.uk/events

Portfolio Management in the pharmaceutical industry by Dr John Bennett, 10th June 2014

  • 1.
    ©2012 Volt. Allrights reserved. Proprietary & Confidential. Portfolio Management in the Pharmaceutical Industry. Dr John Bennett APM Presentation !0th June 2014
  • 2.
    Overview • Brief overviewof the Pharmaceutical Portfolio environment. – What is the R&D process? – What are the industry challenges? • Pharmaceutical Portfolio Management – Is it unique?
  • 3.
    Pharmaceutical Industry background •High investment in R&D – $700 bn for top 20 companies over 10yr. – Each drug can be up to $1bn. • High risk – High attrition rates though R&D. • Even at late stages – Even ‘successful’ drugs can fail on the market e.g. Vioxx • High return – Lipitor peak annual sales $13bn – But 70-80% drugs never return on investment. • Highly regulated – GCP, GLP, GMP. – FDA, EMEA regulators approval – NICE approval
  • 4.
    The drug discoveryand development process Medicine 0 Idea 10 - 15 Years Research Exploratory Full Phase I Phase II Phase III 155 10 Development RegnPreclin
  • 5.
    Clinical Development PhaseCharacteristics Healthy volunteers Patients Safety Efficacy, Safety, Dose & Regimen Efficacy, Safety, Comparative performance, Health Economics Phase I Phase IIIPhase II 10s 100s 1000s (up to 25k) Patients Local National / Regional Global < $1m $1.0 - $10m $10 – $500m
  • 6.
    Drug Development isRisky Candidate Attrition 0 4 12 25 No.candidates 0 1 2 3 4 5 6 7 8 9 Years Preclin. Phase I Phase II Phase III Registration animal toxicity, chemical stability, efficacy/safety, differentiation, human PK, toleration, formulation long-term safety non-approval On average, it takes 25 drug candidates to yield one marketed product
  • 7.
    Pre-clin Phase IPhase II Phase III Approval / Launch Survival of candidates and cost of development Cost at launch approx. 50% of total spend.
  • 8.
    Evolving needs forIndustry • Well known industry wide challenges – Productivity – Escalating costs – Pressure on R&D budgets – Risk • Evolving market conditions – Continued price pressures – Technology assessment groups – Competition – No longer sufficient to get market approval
  • 9.
    Evolving needs forIndustry • More opportunities than resources. – Reductions in R&D budgets. – Focus on areas of high promise. • More important than ever to ‘do the right projects’ – ‘Optimised’ portfolio content.
  • 10.
    View of PortfolioManagement Doing the right projects Doing the projects right The right people doing the right things at the right time Portfolio Management Program & Project Management Work Management
  • 11.
    Developing the framework:example model Each project is scored against each attribute Weights are applied to each attribute Each project has an overall score (weighted sum of attributes) Graphics show up strengths and weaknesses of each project Can explore how project ranking changes with different scores and weights on attributes. This will highlight those projects that always remain attractive under different scenarios, and it will also flag areas of weakness to address in individual projects This understanding supports project funding decisions
  • 12.
    Efficient Frontier asa portfolio tool Investment Efficiency Chart Project 1 Project 2 Project 3 Project 4 Project 5 Project 6 Project 8 Project 7- Project 9 Project 10 Project 11 Project 12 0 500 1000 1500 2000 2500 3000 0 100 200 300 400 500 Cumulative eCosts, $m CumulativeeNPV,$m
  • 13.
    Portfolio Value assessment Baseline- August 200x Target Forecast - August 200y Program Name Phase PTRS eNPV ePI Phase PTRS eNPV ePI 1 P I 5% 204.6$ 14.8 P IIa 7% 289.2$ 19.5 2 P IIa 29% 15.5$ 0.9 P III 29% 19.3$ 1.2 3 P IIa 33% 154.2$ 6.4 P IIa 33% 179.3$ 10.7 4 P IIa 19% 835.0$ 20.1 P IIb 54% 2,733.6$ 26.6 5 P IIb 8% (1.2)$ (0.0) P IIb 8% 4.8$ 0.2 6 P IIb 58% 505.0$ 9.5 P IIb 58% 575.1$ 14.9 7 Ph III 85% 122.1$ 30.4 Reg 85% 138.3$ 327.8 8 Ph III 42% 724.8$ 33.7 Reg 60% 1,167.3$ 212.6 9 Reg 85% 76.1$ 19.1 Launch 100% 103.6$ N/A 10 Reg 90% 351.2$ 285.1 Reg 90% 387.2$ 996.2 Total Baseline: 2,987.2$ 14.2 Key: = Projected Phase changes from Aug to Aug
  • 14.
    What is PortfolioManagement? Quality Tools Governance Process Objectives Data Stakeholders Constraints Priorities Politics Risk Investment Value Strategy Goals Decision Making Resources Metrics Deliver the highest value Its more than the maths
  • 15.
    Finance Portfolio Info Prioritization Project Information FTEs Portfolio Management •StrategyAlignment •Delivery Against goals •Resource Management •Governance •Project & Protocol Prioritization Organizational Performance •Performance Metrics •Performance Targets •Performance Gaps Candidate Team Project Management •Project details •Schedules •Issues •Risks •Resource Demand Portfolio Management, Project Management, Governance & Performance Management Are Integrated Portfolio R&D Productivity
  • 16.
    Pharmaceutical Portfolio characteristics •High degree of uncertainty. – Project level • Science / experiment driven – many projects fail. • Changes of direction not infrequent (e.g. Viagra) – Activity level • E.g clinical trials • Dynamic – Projects entering and leaving continuously • Multi-year projects – annual budgets. – Balancing across the portfolio. • Mix of early and late development entities. – Very different characteristics. • Inevitable ‘gaps’ in pipeline delivery
  • 17.
    We’ve ‘chosen’ theportfolio – now what? Managing a dynamic drug portfolio. • Clear and agreed priorities. • Attrition based budget. • Agile decision making.
  • 18.
    Clear and agreedpriorities • Process and tools to define the ‘Priority List’ – Critical but not sufficient. • Ability to translate priorities into consistent action – Business rules for projects • ‘High’ = continuously seeking buy up opportunities to reduce risk and or time and quality. Plan for success. • ‘Low’ = deliver to agreed plan, seek opportunities to reduce time if no additional resource required. Plan to nearest risk inflection point only. – Dialogue with service providers • Internal – sequencing of activities • Priority v urgency of activity.
  • 19.
    ‘Attrition’ based budgeting •Many companies underspend annual budget. • Failure to take loss of projects and inevitable delays into account – If 10 early projects start the year – 5 will die by year end…… • Start the year with demand higher than budget. – Manage the difference through the year. – What buy up and buy down options are available? – What would the impact be on goals, etc? – What is the ‘best by’ date for options? • Use priorities to guide early in year investments
  • 20.
    Agile decision making •Portfolio management is an ongoing, day to day, active process. – It cannot be done as an annual review. – Impossible to allocate resource to projects on an annual basis. – Its never perfect. • Clear decision authority – Governance – project team – functional line. – Respect for decision rules • With emerging data, confidence and priorities can change dramatically. – What mechanisms are in place to check on allocation against priority and urgency? • Mechanisms to understand impact of decisions and options. – Opportunity to in-licence new drug candidate – but if we allocate resources to it – what happens to the current portfolio?
  • 21.
    This presentation wasdelivered at an APM event To find out more about upcoming events please visit our website www.apm.org.uk/events