SlideShare a Scribd company logo
1 of 20
Download to read offline
CORROSION–Vol. 56, No. 2 199
CRITICAL REVIEW OF CORROSION SCIENCE AND ENGINEERING
0010-9312/00/000039/$5.00+$0.50/0
© 2000, NACE International
Submitted for publication February 1998. Presented as paper no.
304 at CORROSION/98, March 1998, San Diego, CA.
* Center for Electrochemical Sciences and Engineering, Department
of Materials Science and Engineering, Thornton Hall, University of
Virginia, Charlottesville, VA 22903-2442.
Polarization Resistance Method
for Determination of Instantaneous Corrosion Rates
J.R. Scully*
ABSTRACT
The polarization resistance method for the determination of
instantaneous corrosion rates of metals were reviewed. The
assumptions in electrode kinetics that govern the connection
between the slope of steady-state applied electrochemical
potential-applied current density (Eapp-iapp) measurements
(i.e., the polarization resistance) and the corrosion rate were
restated. Electrochemical impedance, as well as statistical
and spectral electrochemical noise methods for obtaining
polarization resistance, also were discussed. Traditional
sources of error such as high excitation voltage amplitudes,
insufficiently slow voltage ramp rates, high alternating cur-
rent (AC) frequencies, inadequate polarization hold periods,
high solution resistance, presence of parallel reduction-
oxidation reactions, and nonuniform current and potential
distributions were examined with the goal of defining some
of the conditions and circumstances where these complicat-
ing factors are important. Other complicating factors such as
diffusion-controlled reactions, potential-dependent film cover-
ages, and adsorption pseudo-capacitance that affect
electrochemical reaction rates were discussed. Their influ-
ence on measured interfacial resistance values and
subsequent determination of corrosion rates was discussed.
KEY WORDS: current-step method, impedance method,
instantaneous corrosion rate, linear polarization resistance,
noise resistance, polarization resistance, potential-step
method, potentiodynamic method, power spectral density,
solution resistance, spectral noise resistance
INTRODUCTION
A variety of methods such as electrical resistance,
gravimetric-based mass loss, quartz crystal microbal-
ance-based mass loss, electrochemical, and solution
analysis methods enable the determination of corro-
sion rates of metals. The polarization resistance
method, based on electrochemical concepts, enables
determination of instantaneous interfacial reaction
rates such as corrosion rates and exchange current
densities from a single experiment. There are a vari-
ety of methods capable of experimentally determining
instantaneous polarization resistances such as
potential step or sweep, current step or sweep,
impedance spectroscopy, as well as statistical and
spectral noise methods. All of these methods utilize
either two-, three-, or four-electrode electrochemical
cells. Instantaneous corrosion rate information can
be obtained from such relatively rapid electrochemi-
cal measurements in short time periods. Other
methods such as the electrical resistance change of
the solid electronic conducting phase, gravimetric
and quartz crystal microbalance measurements of
mass loss, and solution analysis to detect metallic
cations released into the ionic conducting phase all
provide historical or integrated information on the in-
stantaneous corrosion rates that have occurred over
some period of time. Therefore, the derivative of mul-
tiple measurements over exposure time must be used
to obtain rate information. Therefore, instantaneous
rates can not be determined by a single measure-
ment of these types and electrochemical methods, for
instantaneous rate determination remain extremely
200 CORROSION–FEBRUARY 2000
CRITICAL REVIEW OF CORROSION SCIENCE AND ENGINEERING
(1)
This review focuses on corroding systems. However, the concept
of polarization resistance applies equally well to reduction-
oxidation systems. Here, the exchange current density (io) may be
calculated from the Rp, as defined below, where R is the ideal gas
constant, T is the temperature, and ␣a and ␣c are the anodic and
cathodic multi-step electron transfer coefficients, respectively, for
the reduction-oxidation process.
Rp Ω–cm2
=
∆E
∆i
E – Erev →0
=
RT
io αa + αc
attractive. However, numerous issues can make the
task of extracting a polarization resistance value
(that is inversely proportional to the instantaneous
corrosion rate) from electrochemical data a complex
one whether the experiment is conducted in the fre-
quency or time domains. The goal of the present
study was to review some of these issues.
Governing Electrode Kinetics
in Corrosion Processes
The following relationship is observed experi-
mentally between applied electrochemical current
density and potential for a corroding electrode in the
absence of parallel reduction-oxidation reactions.1-2
The applicability of this simple relationship relies on
the presence of a single charge-transfer-controlled
cathodic reaction and a single charge-transfer-
controlled anodic reaction:
iapp = icorr exp
2.3 E – Ecorr
βa
– exp
2.3 E – Ecorr
βc
(1)
where ␤a and ␤c are the anodic and cathodic Tafel
parameters given by the slopes of the polarization
curves (∂E/∂logiapp) in the anodic and cathodic Tafel
regimes, respectively. E-log(iapp) data that is governed
by such kinetics are shown in Figure 1. Ecorr is the
corrosion potential. E is an applied potential such
that E-Ecorr is ∆E, and icorr is the corrosion current
density. This relationship provides the basis for the
electrochemical polarization technique as applied to
a corroding electrode at its corrosion potential.
Derivation of the Polarization Resistance
Many investigators have experimentally observed
that iapp is approximately linearly related to applied
potential within a few millivolts of polarization from
Ecorr.3
Stern and Geary simplified the kinetic expres-
sion to provide an approximation to the charge-
transfer-controlled reaction kinetics given by
Equation (1) for the case of small overpotentials with
respect to Ecorr.4-6
Equation (1) can be linearized
mathematically by taking its series expansion (e.g.,
ex
= 1 + x + x2
/2! + x3
/3! + x4
/4!..) and by neglecting
higher terms when ∆E/b < 0.1. This simplified rela-
tionship has the following form:
Rp Ω–cm2
=
∆E
∆iapp
E – Ecorr →0
=
βaβc
2.3icorr βa + βc
(2)
rearranging:
icorr =
1
2.3Rp
βaβc
βa + βc
=
B
Rp
(3)
where Rp is the polarization resistance given by
(∂E/∂iapp)at t=∞, ∆E=0 (Ω-cm2
), and B is a proportionality
constant. Since charge transfer is assumed in
Equation (3), Rp is equal to a charge-transfer resis-
tance (Rct). The units for Rp are ohms as obtained
from E-Iapp data (where Iapp is the applied current)
when the applied current is not normalized by elec-
trode area. Such data must be multiplied by
electrode area to yield Rp (Ω-cm2
). If electrode area is
doubled, then the measured Rp value in ohms is
halved, but the intrinsic polarization resistance value
Rp (Ω-cm2
) would be the same since the electrode
area is doubled. This gives the result that corrosion
rate per unit area is independent of electrode area.
However, the working electrode area must be known
to calculate corrosion rate.
The B factor is dominated by the smaller of the
two anodic and cathodic Tafel slopes (ba, bc), if un-
equal. Therefore, cathodic mass transport control,
such that bcÆ∞, results in B = ba/2.3. Similarly,
anodic mass transport control results in B = bc/2.3.7
FIGURE 1. E-log (iapp) data for hypothetical corroding interfaces with
RP = 100 Ω-cm2
and 10,000 Ω-cm2
(assumed 1-cm2
A) and ␤a = ␤c =
60 mV/decade. The two cases produced corrosion current densities,
icorr, of 130.4 µA/cm2
and 1.3 µA/cm2
, respectively. The Tafel slopes
were obtained from ∂E/∂log (iapp) data at high overpotential where
E-log (iapp) is linear. The OCP was arbitrarily selected to be 0 mV.
CORROSION–Vol. 56, No. 2 201
CRITICAL REVIEW OF CORROSION SCIENCE AND ENGINEERING
Knowledge of Rp, ba, and bc enables direct determina-
tion of the corrosion rate at any instant in time using
Equation (3).4-9
iapp often is approximately linear with
potential within ± 5 mV to 10 mV of Ecorr (Figure 2).
The slope of this plot is ∆E/∆iapp. When determined
from a tangent to the E-iapp curve at Ecorr, as shown in
Figures 2(a) and (b), it defines the polarization resis-
tance. Consequently, this method often is called the
linear polarization method (LPR). The slope at Ecorr is
independent of the degree of linearity,3
although the
extent of the approximately linear E-iapp region can
vary considerably among corroding systems.
The fact that the corrosion rate is inversely pro-
portional to the Rp is seen clearly in Equation (3).
Taking the logarithm of this equation, it is seen that
log icorr vs log Rp is linear with a slope of –1 and has
the intercept log B:3
log Rp = log B – log icorr (4)
Stern and Wiesert confirmed such a relationship over
a nearly 6 orders-of-magnitude change in corrosion
current density for many corroding systems and
for exchange current density for many reduction-
oxidation systems.8,(1)
Time Domain Methods
for Determining Polarization Resistance
ASTM standards D-27769
and G-5910
describe
standard procedures for conducting polarization re-
sistance measurements. Potentiodynamic,11
potential
step, and current-step methods12-13
all have been
described to determine the linear E-iapp behavior
of an electrode near Ecorr. Regardless of the method
utilized, independent determination of ␤a and ␤c still
is required.
Alternative techniques exploit nonlinearity at
larger overpotentials. Nonlinearity invalidates
Equation (3). However, the nonlinearity, if treated
properly, can enable determination of ␤a and ␤c with-
out excessive polarization. The Oldham-Mansfeld
method calculates icorr from nonlinear E vs iapp data
obtained within ± 30 mV of Ecorr, without the need for
high overpotential determination of ␤a and ␤c.14
Com-
puterized curve fitting can exploit nonlinearity to
calculate ␤a and ␤c from low-overpotential data,
avoiding the destructive nature of large overpoten-
tials.15
The Mansfeld technique substitutes Equation
(3) into Equation (1) eliminating icorr.15
␤a and ␤c are
determined from the best fit of the resulting expres-
sion containing ␤a and ␤c as unknowns to a nonlinear
plot of ⌬E vs 2.3iappRp. Rp is determined in the usual
way from the slope of a linear tangent to the E vs iapp
data at Ecorr. icorr is determined subsequently from
Equation (3) for known values of Rp, ␤a, and ␤c. In
this technique, elimination of icorr enables determina-
tion of only two unknowns by fitting. Advancements
in computerization enable a direct fit of E-iapp data to
Equation (1), but this requires simultaneous determi-
nation of three unknowns. Consequently, extremely
high-quality E-log(iapp) data that is corrected for
ohmic voltage error and does not contain other
sources of overpotential (i.e., mass transport
overpotentials) are required.
Electrochemical Impedance Methods
for Determination of Polarization Resistance
Some of the complications and sources of error
associated with the polarization resistance method,
such as a high solution resistance and fast scan rate,
are explained more readily after introducing electrical
equivalent circuit parameters to represent and simu-
late the corroding electrochemical interface.1,16-20
The
impedance method is a straightforward approach for
(a)
(b)
FIGURE 2. E-iapp data according to Equation (1) for hypothetical
corrodinginterfaceswithRP =100,1,000,and10,000Ω-cm2
(assumed
1-cm2
A) and ␤a = ␤c = 60 mV/decade. The three cases produced
corrosion current densities of 130.4, 13.0, and 1.3 µA/cm2
,
respectively. Plots a and b of the same data provide different current
scales to indicate the extent of nonlinearity in each case.
202 CORROSION–FEBRUARY 2000
CRITICAL REVIEW OF CORROSION SCIENCE AND ENGINEERING
analyzing such electrical circuits and extracting the
values of the circuit parameters. The simplest form of
such a model pertinent to a corroding interface is
shown in Figure 3(a). The three circuit parameters
(Rp, solution resistance [Rs], and double-layer
capacitance [Cdl]) that approximate a corroding
electrochemical interface are shown. Cdl arises when-
ever an electrochemical interface exists between
electronic and ionic phases. The circuit models de-
scribed in Figures 3(b) and (c) describe cases where
diffusional impedances and adsorption pseudo-
capacitances occur, respectively.
ASTM standard G 106 provides a standard prac-
tice for verification of algorithm and equipment for
electrochemical impedance measurements.20
The
standard also contains an appendix reviewing the
technique. The electrochemical impedance method is
conducted over a range of alternating current (AC)
frequencies. Typically, a small-amplitude sinusoidal
potential perturbation is applied to the working elec-
trode at a number of discrete frequencies (␻). At each
one of these frequencies, the resulting current wave-
form will exhibit a sinusoidal response that is out of
phase with the applied potential signal by an amount
depending upon the circuit parameters of the corrod-
ing interface and will have a current amplitude that
is inversely proportional to the impedance of inter-
face. This electrochemical impedance (Z[␻]) is the
frequency-dependent proportionality factor that acts
as a transfer function by establishing a relationship
between the excitation voltage signal and the current
response of the electrochemical system:
Z ω =
E ω
i ω
(5)
where E is the time varying voltage across the circuit,
E = Eo sin(␻t); i is the time varying current density
through the circuit, i = io sin (␻t+␾); Z(␻) is the
impedance (Ω-cm2
); and t is time (s). Z(␻) is a com-
plex-valued vector quantity with real and imaginary
components whose values are frequency dependent:
Z ω = Z′ ω + jZ′′ ω (6)
where Z´(␻) is the real component of impedance,
where Z´(␻) = |Z(␻)|cos(␾); Z´´(␻) is the imaginary
component of impedance, where Z´´(␻) = |Z(␻)|sin(␾);
j2
is the square of the imaginary number, or –1;
|Z(␻)| is the impedance magnitude or modulus,
where |Z(␻)| = (Z´(␻)2
+ Z´´(␻)2
)1/2
; and the phase angle
(␾) = tan–1
Z´´(␻)/Z´(␻). An example of an impedance
Z(␻) vector with real and imaginary (capacitive) com-
ponents is shown elsewhere.20
Z(v) is a fundamental characteristic of the elec-
(a)
(b)
(c)
FIGURE 3. Electrical equivalent circuit models commonly used to
represent an electrochemical interface undergoing corrosion. RP, Cdl,
C ␾, Rct, and RF are all potential dependent. (a) Randles-type circuit
where RP = Rct when there are no mass transport limitations;
electrochemical reactions involve no absorbed intermediates and
instantaneous charge-transfer control prevails. (b) Electrical
equivalent circuit for a corroding metal containing a diffusional
impedance parameter representing presence of a finite diffusional
impedance. RP = RD + Rct at the DC limit in the case of a finite mass
transport limitation to the reaction rate. (c) Electrical equivalent
circuit for a corroding metal containing an adsorption C␾ associated
with an adsorbed intermediate. In the example, the charge-transfer
reaction rate is inversely proportional to Rct for a transient period until
the adsorbed intermediate coverage was formed. This situation is
described by a resistor in series with a capacitor. Once the coverage
is formed creating an interphase that slows the reaction, the overall
reaction rate is given by Rp = Rct + RF at the DC limit.
CORROSION–Vol. 56, No. 2 203
CRITICAL REVIEW OF CORROSION SCIENCE AND ENGINEERING
trochemical system it describes. A knowledge of the
frequency dependence of impedance for a corroding
system enables a determination of an appropriate
equivalent electrical circuit describing that system.
Such a circuit typically is constructed from resistors
and capacitors. Table 1 shows the transfer functions
for resistors, capacitors, and inductors. The capaci-
tor can be a Cdl or a Cdl and a pseudo-capacitance (Cf)
associated with an adsorbed intermediate.
Figure 3(a) illustrates a simple equivalent electrical
circuit model commonly used to represent an actively
corroding metal in an aqueous solution under
charge-transfer control. The following expression
describes the impedance for the simple circuit
described in Figure 3(a):
Z ω = Rs +
Rp
1 + ω2
Rp
2
Cdl
2
_
jωCRp
2
1 + ω2
Rp
2
Cdl
2
(7)
where ␻ = 2πf is the frequency of the applied signal
(rad/s), f is the frequency of the applied signal (Hz),
and Cdl is the interfacial capacitance (F/cm2
). The
complex plane, Bode magnitude, and phase plots
resulting from a circuit such as shown in Figure 3(a)
and described by Equation 7 are shown for three
different values of Rp in Figure 4. At very low
frequencies:
Zω→0 ω = Rs + Rp (8)
This is because the impedance associated with a ca-
pacitor approaches infinity as frequency approaches
zero, and parallel electrical circuit elements are
dominated by the element with the smallest imped-
ance. Therefore, the sum of Rs and Rp is measured at
zero frequency; while at very high frequencies:
Zω→∞ ω = Rs (9)
Since the algebraic sum of Rs and Rp is measured
when a direct current (DC) measurement is per-
formed (e.g., zero AC frequency, long hold time
during potential or current step, or slow scan rate
approaching zero), the true corrosion rate will be
underestimated by |Z(␻)| at the zero frequency limit
when Rs is appreciable (Figure 5). However, Rp can be
determined in media of high resistivity when Rp is
separated mathematically from Rs by taking the dif-
ference between Z(␻) obtained at low and high ␻
(Rp = |Z(␻→0) | – |Z(␻→∞)|). In other words, deter-
mination of Rp can be achieved by subtracting the
results of Equation (9) from the results of Equation
(8). This is a particularly useful approach if Rs is
nearly the same value as Rp (Figure 5 for Rs = 100 Ω).
The need for this subtraction may result from either
low conductivity environments or placement of the
reference electrode far away from the working
electrode; in either case, Rs may become large. Con-
versely, any experiment conducted at too fast a
voltage scan rate (short time or too high of an AC fre-
quency) causes the algebraic sum of the ohmic
resistance and the resultant frequency dependent
parallel impedance of the parallel resistive-capacitive
network to be measured. This value will be lower
than the sum of Rp and Rs determined at an infinitely
slow scan rate or frequency because current leaks
through the parallel capacitive element at a higher
scan rate because of its low impedance at high fre-
quency. This usually will result in an overestimation
of the true corrosion rate. These complications in
scan rate or current-step hold time can be overcome,
or at least detected more easily, by using the electro-
chemical impedance method.1,16,20
Corrosion rate
determination in Equation (3) still requires knowl-
edge of ␤a and ␤c.
TABLE 1
Linear Circuit Elements
Commonly Used in Electrochemical Impedance
Circuit Component Impedance
Resistor (R) Z(␻) = R
Capacitor (C) Z(␻) = –1/j␻C
Inductor (L) Z(␻) = j␻L
(a)
(b)
FIGURE 4. (a) Bode magnitude and (b) Bode phase angle plots for
a hypothetical corroding interface using the electrical equivalent
circuit model given by Figure 3(a) with RP = 10, 100, or 1,000 Ω, Cdl
= 1,000 µF, and RS = 10 Ω.
204 CORROSION–FEBRUARY 2000
CRITICAL REVIEW OF CORROSION SCIENCE AND ENGINEERING
Either the anodic or cathodic half-cell reaction
can become mass-transport limited and restrict the
rate of corrosion at Ecorr. The presence of diffusion-
controlled corrosion processes does not invalid the
electrochemical impedance spectroscopy (EIS)
method but does require extra precaution and a
modification to the circuit model of Figure 3(a). In
this case, the finite diffusional impedance is added in
series with the usual charge-transfer parallel resis-
tance shown in Figure 3(b). The transfer function for
the frequency dependent finite diffusional impedance
(ZD) has been described by:21
ZD ω = RD
tanh jωs
jωs
(10)
Here, s = leff
2
/D, where leff is the actual finite diffusion
length and D is the diffusion coefficient of the diffus-
ing species that limits the interfacial reaction. The
value of ZD(␻) approaches the real component of the
diffusional impedance, RD, as ␻→0. The maximum
frequency required to obtain RD depends upon the
value of s. The larger the value of s, such as when
Ieff is large or D is small, the lower the frequency
required as illustrated in Figure 6. Rp, defined as
[∆E/∆iapp] as ␻→0, is the sum of Rct and RD contribu-
tions to the polarization resistance, assuming that
RD + Rct >> Rs:
Rp = Rct + RD (11)
A very low frequency or scan rate may be required
to obtain Rp defined by Equation (11) under certain
circumstances (Figure 6). Here, a Ieff of 0.1 cm and
D = 10–5
cm2
/s requires that a frequency < 0.1 mHz
be implemented to obtain Rp from |Z(␻)| at the zero
frequency limit. Hence, a common experimental
problem for diffusion-controlled electrochemical reac-
tions is that extremely low frequency (or scan rates)
are required to complete the measurement of Rp.
When Rp is defined by Equation (11), the Stern
approximation of Equations (2) and (3) must be
modified to account for the Tafel slope for the anodic
or cathodic reactions under diffusion-controlled con-
ditions (i.e., ␤→∞). In fact, Equation (1) becomes
invalid. Moreover, it has been argued that the use of
Rp in the Stern equation breaks down in the case of
mixed or partial diffusion control.
Another relevant situation to corrosion rate de-
termination occurs when an adsorbed intermediate
participates in the overall reaction process (Figure
3[c]).22
Here, Rct is a faradaic resistance proportional
to a charge-transfer process that occurs instanta-
neously given a certain adsorbed intermediate
coverage. Rs and Cdl have their usual meanings. Cf
is a new capacitance term that depends upon the
change in the charge stored in the adsorbed interme-
diate film resulting from a gradual change in the film
coverage with potential.2
The adsorbed film has a
charge associated with it in this case because it is
formed by a charge-transfer process. Recall that the
source of any fixed capacitance is a charge that is
proportional to potential. Hence, the rate of change of
surface charge is proportional to the rate of change
in interfacial potential. The capacitance (C) is the
proportionality factor that is independent of the rate
of change in charge or potential assuming a fixed
capacitance:2
C =
dq
dE
=
dt
dE
dqT
dt
(12)
(a)
(b)
FIGURE 5. (a) Bode magnitude and (b) Bode phase angle plots for
hypothetical corroding interfaces with RP = 100 Ω, C dl = 100 µF, and
RS = 1, 10, or 100 Ω using the electrical equivalent circuit model of
Figure 3(a).
CORROSION–Vol. 56, No. 2 205
CRITICAL REVIEW OF CORROSION SCIENCE AND ENGINEERING
In the case of a double-layer capacitance, Cdl = dqdl/
dE. For C␾ = dqF/dE. Here, qF is the charge to form
the surface film of an adsorbed intermediate, for ex-
ample. qF = qM␪, where ␪ describes the fractional
surface coverage by the film (assumed to be one
monolayer thick), and qM describes the charge
required to form one monolayer:
Cφ =
dqF
dE
= qM
dθ
dE
= qM
dt
dE
dθ
dt
(13)
Hence, C␾ differs from Cdl since the former involves
charge transfer to create the change in surface
charge. The latter involves a charge balance across
an electrochemical interface brought about by rear-
rangement of ions in solution in response to a
change in excess charge in the metal.2
Therefore, Cdl
requires no charge transfer. The adsorption C␾ ap-
pears in the circuit model as a physically justified
capacitance that behaves just like a capacitor
should; it allows passage of an AC signal but pro-
vides an infinite resistance to a DC signal. The
physical significance of this, when placed in series
with a resistor, is that it allows a transient current
flow when the potential is shifted until the coverage
reaches the equilibrium value defined by the new
potential. If the reaction still proceeds at a new
steady-state rate after the coverage has formed, this
can be described by placing a second resistor in par-
allel with C␾. In this example, the charge-transfer
reaction rate and coverage are assumed to increase
with potential, with increasing coverage acting
against the overall reaction rate. In this case, the in-
terphase acts as an added resistor such that |Z(␻)|
at the zero frequency limit is equal to Rs + RF + Rct.
Therefore, RF and Rct are both potential dependent,
and RF + Rct yields Rp if Rs is minimal. As the fre-
quency of an AC signal increases, the coverage can
no longer change with potential, and C␾ approaches
zero. Since the coverage is frozen, d␪/dE approaches
zero and the interface can be represented by a sim-
plified Randles’ circuit where Cdl is parallel to Rct. Rct
is therefore a charge-transfer resistance inversely
proportional to the charge-transfer reaction rate at
zero or frozen coverage.
Electrochemical Noise Resistance
Electrochemical noise analysis can provide a pa-
rameter called the electrochemical noise resistance
(Rn).23-29
It is desirable to utilize this parameter in an
analogous fashion as the polarization resistance. One
electrode configuration that enables such a measure-
ment involves connecting a zero resistance ammeter
between two nominally identical corroding electrodes
immersed in the same solution. A third, nominally
identical electrode can be immersed in solution and
connected to the first two using a high impedance
voltmeter. This electrode serves as a “noisy” psuedo-
reference electrode. This approach is attractive in
field applications because of the more rugged nature
of the metallic electrode compared to laboratory ref-
erence electrodes but complicates the analysis
because two uncorrelated potential sources (i.e., from
the couple and the psuedo-reference) are measured
in the collection of potential noise (Vn). Since Vn(meas) =
(Vn(couple) + Vn(psuedo-ref))1/2
, Vn(meas) must be divided by √230
to yield Vn(couple). Another alternative is a four-elec-
trode arrangement where the first pair is coupled
through a zero resistance ammeter to monitor cur-
rent and the second pair is connected with a
high-impedance voltmeter to sample an uncorrelated
Vn(couple). Alternatively, a less noisy, conventional refer-
ence electrode may be utilized in the three-electrode
arrangement. In this case, Vn(meas) and In(meas) are corre-
lated, where In is the electrochemical current noise.
(a)
(b)
FIGURE 6. (a) Bode magnitude and (b) Bode phase angle plots for
hypothetical corroding interfaces with Rct = 100 Ω, RD = 1,000 Ω,
Cdl = 100 µF, RS = 10 Ω, leff = 0.1 cm, and D = 10–5
, 10–6
, and
10–7
cm2
/s using the electrical equivalent circuit model of Figure 3(b).
206 CORROSION–FEBRUARY 2000
CRITICAL REVIEW OF CORROSION SCIENCE AND ENGINEERING
The reference electrode noise can be defined sepa-
rately as the electrochemical voltage noise between
two nominally identical reference electrodes.31
If the
reference electrode noise is low, then the √2 correc-
tion factor is not needed. In either case, the third
electrode (reference electrode) is connected to the
first two via a high-impedance voltmeter. These ar-
rangements enable simultaneous recording of the
galvanic current with time and the galvanic couple
potential versus time. The standard deviation of the
voltage noise divided by the standard deviation of the
current noise has been proposed to yield a statistical
parameter called the noise resistance (Rn).23-30,32
Fur-
ther analysis of simulated noise data has led to the
conclusion that the ratio of the standard deviations
of the current and voltage noises measured between
two identical electrodes can be normalized by surface
area by multiplying by √AvAi:29
Rn =
σV(meas)
σI(meas)
AνAI (14)
where ␴V(meas) is the standard deviation of the voltage
noise, ␴I(meas) is the standard deviation of the current
noise, and Av and AI are the surface areas of the elec-
trodes used for voltage and current measurement,
respectively. Correlations between this parameter
and conventionally determined Rp and mass-
loss-based corrosion rates have been obtained.24,30
Unfortunately, experimental confirmation of the area
normalization factor has not been performed exten-
sively. Recall that in the case of a Rp determined from
E-iapp data or EIS data at the zero frequency limit,
measured resistance can be multiplied by electrode
area and will yield the same area normalized Rp over
a broad range of electrode areas.
Moreover, the correlation has lacked a rigorous
fundamental foundation for correlating Rn with corro-
sion rate, despite the intuitive connection between
sV and sI given by the proportionality factor Rn. It is
clear that the surface of one freely corroding elec-
trode could be divided into areas that experience
fluctuations in interfacial resistance that produce
changes in anodic and cathodic half-cell reaction
rates in any one patch. The electrode potential must
change then in each patch to drive the half-cell reac-
tions such that the sum of all the anodic half-cell
currents from all patches equals the sum of all
cathodic half-cell currents, regardless of whether the
source of cathodic half-cell current is from capacitive
discharge or electrochemical reaction.28
Some global
change in potential also occurs on the electrode. If
the first electrode is now connected to a second elec-
trode whose interfacial properties and global
electrode potential do not change on their own at the
same instant in time and by the same degree as on
the first electrode, then a galvanic cell is created
momentarily, which induces a further difference in
anodic and cathodic half-cell currents on the first
electrode. Current now flows between the first and
second electrodes such that the sum of anodic and
cathodic half-cell currents over all patches on both
electrodes is equal. When the interfacial resistances
return to normal values over all patches, the
potential difference between the two electrodes is
eliminated and so is the measurable current between
the two electrodes. Bertocci argued that the external
current fluctuation measured between two identical
electrodes is identical to the fluctuation in one elec-
trode.28-29
Others have argued using concepts of
mixed potential theory that, at worst, the current
sampled is only one half of the total for equal-sized
electrodes.
Theoretical relationships establishing the con-
nection between Rn and Rp have been sought by
several researchers,29,33-36
but their validity has been
questioned. A great concern has been that the largest
current peaks would occur during the most rapid
voltage fluctuations since the electrode interface con-
tains a capacitance through which current can be
shorted.28-29
Thus, when voltage fluctuations are
rapid, the measured noise current will be shorted
through the interfacial capacitance assuming a
simple electrical equivalent circuit model consisting
of a two-parallel resistor-capacitor network describ-
ing the interface for each electrode connected in
series through Rs. This situation would lead to the
lowest impedance between the two electrodes during
the most rapid voltage fluctuations that, in turn,
produce the greatest current fluctuations. The
theoretical maximum measured current would be
given by the voltage fluctuation divided by Rs. The
outcome would be a statistical Rn parameter that is
proportional to, or heavily influenced by higher fre-
quency data. Indeed, Rn is found to equal an absolute
impedance at some frequency that depends on the
frequency of the voltage fluctuations and the resis-
tive-capacitive (RC) time constant of the electrode
interface in one study of simulated noise.28
Unfortu-
nately, a Rn value obtained at high frequency would
be smaller in magnitude than the Rp obtained at the
zero frequency limit. Hence, it would not represent
the desired zero frequency limit interfacial resistance,
Rp. Indeed, such underestimations in the true value
of Rp have been observed experimentally.30,32
Recently, a more rigorous theoretical and experi-
mental analysis has been made comparing the
spectral noise resistance (Rsn[v]) obtained at each fre-
quency with the Rp obtained from the zero frequency
limit of impedance data |Z(v = 0)|, as well as the
frequency dependent impedance of two electrodes.37-41
The spectral noise resistance (Rsn[v]) is determined by
taking the square root of power spectral density of
the voltage noise, VPSD, (V2
/Hz)1/2
and dividing it by
the square root of power spectral density of the cur-
CORROSION–Vol. 56, No. 2 207
CRITICAL REVIEW OF CORROSION SCIENCE AND ENGINEERING
rent noise, IPSD, (A2
/Hz)1/2
at each frequency using the
same two electrode arrangement as discussed
above:40-41
Rsn ω =
VPSD
IPSD
(15)
Rsn(␻) is proportional to the magnitude of the cell
impedance, |Z(␻)|, in the two-electrode arrange-
ment.40-41
The proportionality factor is unity in the
case of identically sized electrodes in a two-electrode
cell with identical impedances and a noiseless refer-
ence electrode.40-41
Therefore, the Rsn(␻) at the zero
frequency limit could equal the interfacial impedance
at the zero frequency limit |Z(␻ = 0)| in the theoreti-
cal case of identical electrode impedances with
negligible Rs. Figure 7 illustrates data for identical
iron electrodes in 1 M sodium sulfate (Na2SO4) with
an iron reference electrode. Here, Rsn(␻) = √3 |Z(␻)|
resulting from the noisy reference electrode (RE).
Thus, 2 |Z(␻)| and Rsn(␻) appear to be similar. It is
well known that in many instances |Z(␻ = 0)| equals
Rp. Even Rn may equal Rsn(␻ = 0) = |Z(␻ = 0)| = Rp if
|Z(␻)| equals Rp in the frequency regime dominating
the Rn value. The frequency range dominating the Rn
value is determined by several factors, but this state-
ment is more likely to be true if |Z(␻)| and Rsn(␻)
exhibit long low-frequency plateaus over a broad
frequency range that encompasses the fmin and fs
utilized in the Rn measurement. Here, fmin is given by
the total sampling time (T), where fmin = 1/T and fs
equals the data sampling rate. Rn typically varies
with fs and underestimates |Z(␻ = 0)|. Unfortunately,
Rsn(␻→0) does not equal Rp in the zero frequency limit
under many other conditions, such as when log
(Rs/Rp ) > 0 or in the case of very noisy reference elec-
trodes.40-41
Moreover, Rsn(␻) can be dominated by the
properties of the high-impedance electrode in the
case of dissimilar electrode impedances that are
equally noisy, but this is not always the case. For
instance, the low-impedance electrode in a two-
electrode cell with a third reference electrode can be
sensed by Rsn(␻) if the higher impedance electrode is
much noisier than the low-impedance electrode.40-41
Recent attempts have been made to address circum-
stances where Rsn(␻) lies between |Z(␻)|1 and |Z(␻)|2
representing the impedance values of the high- and
low-impedance electrodes. Methods have been
suggested for sensing the current fluctuations on
both electrodes.42
Complications With Polarization
Resistance Measurements
Error-producing complications related to the po-
larization resistance method and possible remedies
are reported in the literature.14-15,43-48
The most com-
mon errors involve invalidation of the results through
oxidation of some other electroactive species besides
the corroding metal in question; a change in the
open-circuit or corrosion potential during the time
taken to perform the measurement; use of ∆E that is
too large, invalidating the assumption of a linear re-
lationship between iapp and E required by Equation
(2) (i.e., ∆E/␤ < 1); too fast of a voltage scan rate or
insufficient potential hold time; ohmic solution resis-
tance; and current and potential distributions.
Oxidation or Reduction
of Some Other Electroactive Species
If the Ecorr of the corroding system is close the re-
versible electrode potential of the anodic or cathodic
reactions or near the reversible electrode potential of
any other redox process, then the corrosion rate
likely will be overestimated because electrochemical
reactions occur in parallel to metal dissolution. This
situation can be ascertained experimentally with the
use of any noncorroding, readily polarizable electrode
such as platinum, gold, or high-density graphite.
These materials have a low corrosion rate in most
aqueous solutions and will assume a redox potential
that is governed by the dominant parallel reduction-
oxidation processes occurring in the system. If the
corrosion potential of the corroding metal is very
close to the redox potential of such an electrode, then
Ecorr may be close to a reversible electrode potential.
The error in estimation of the corrosion rate depends
FIGURE 7. Rsn(␻)vsfrequencycomparedtotwotimestheimpedance
|Z(␻)| vs frequency for two iron electrodes in 1 M Na2SO4 at pH 4 with
a “noisy” iron reference electrode. Impedance measurements
performed in a two-electrode cell yielded 2|Z(␻)|. Rsn(␻)= √3|Z(␻)| for
the case of three “noisy” electrodes.41
(Reproduced by permission of
The Electrochemical Society, Inc.)
208 CORROSION–FEBRUARY 2000
CRITICAL REVIEW OF CORROSION SCIENCE AND ENGINEERING
upon the exchange current density for the redox pro-
cess, icorr, ␤a, ␤c, and the difference in potentials
between Ecorr and the reversible electrode potential in
question.48
A cyclic voltammogram on the platinum
electrode may reveal the approximate reaction rate of
any parallel redox process over the potential range of
interest.
Deviations from Linearity
Near the Open-Circuit Potential
Deviations from linearity have been discussed in
the literature.48-50
At issue is the question of when the
range of ∆E is small enough such that the higher
terms in the series expansion of Equation (1) reason-
ably can be neglected. This requires that ∆E/b << 1.
Clearly, the extent of the E-i region where Equation
(2) is a good approximation of Equation (1) depends
on the values of ba and bc. An approximately linear
region can be restricted to ± 2 mV for low values of ba
and bc and can be > 60 mV for high values. This cur-
vature has been described mathematically as:48
∂2
iapp
∂2
E
= icorr
1
βa/2.3
2
+
1
βc/2.3
2
(16)
Therefore, the extent of the curvature will depend
upon icorr, which itself depends on B/Rp and is in-
versely proportional to the squares of ␤a and ␤c.
Hence, the curvature will be greater for smaller Rp
(Figures 2 and 8), and smaller values of ␤a and ␤c.
Obviously, the linear regions will differ for anodic
versus cathodic polarization if differing values of
␤a and ␤c exist. Of course, the Rp always is obtained
properly from the tangent of the E-iapp data in the
vicinity of Ecorr. Stated another way, there always will
be finite curvature associated with the true governing
electrode kinetic expression given by Equation (1)
when plotted as E vs iapp (Figure 2). Since the E-iapp
behavior of the corroding electrode will have a finite,
albeit small curvature, the presence of persistent lin-
earity over a significant potential range may be a clue
that ohmic voltage-controlled E-i behavior exists. 48
A second related issue is the asymmetry in the
E-i response near Ecorr for different values of ba and
bc. Corrosion involves a cathodic electron transfer
reaction that is different from the metal oxidation
reaction. Therefore, there is no fundamental reason
why ba and bc should be equal and they should be
expected to differ. The extent of their difference de-
fines the degree of asymmetry. Asymmetry matters
because the extent of the region where Equation (2)
is a good approximation of Equation (1) then differs
for anodic compared to cathodic polarization.50
The
errors in assuming ±10 mV linearity using the tan-
gent to the E-iapp data at Ecorr and for 10 mV or –10
mV potentiostatic polarizations has been defined for
different Tafel slopes.51
Voltage Scan Rate, AC Frequency, or Hold Time
During Potential or Current Step
Capacitive current can result in hysteresis in
small amplitude cyclic voltammogram E-iapp plots.16,51-
55
Hysteresis in the current density-applied potential
plot is brought about by combinations of high-voltage
scan rate, large interfacial capacitances, and large
polarization resistances. High capacitance, multiplied
by a rapid voltage scan rate, causes a high capacitive
current that results in hysteresis in cyclic E-iapp data.
Attempting to determine Rp at too fast of a scan rate
can underestimate the true value inversely propor-
tional to corrosion rate as shown by Macdonald,52
leading to an overestimation of corrosion rate. This
error can be minimized by determining the polariza-
tion resistance at a slow scan rate or extrapolating
the results at several different slow scan rates to zero
scan rate.52
Alternatively, one may take two or more
current density measurements from potentiostatic
data after long time periods near Ecorr to minimize
scan rate effects. However, since cyclic voltammo-
grams, potential steps, and current steps all
represent the Fourier synthesis of sine waves, they
all equally require adequate hold time, a low enough
scan rate, or a low fmax to perform each measurement.
This required time period depends on the RpCdl time
constant of the electrochemical interface (Figure 3[a])
for an electrode that does not involve mass-trans-
port-controlled reactions or Cf associated with
adsorbed intermediates.
The maximum scan rate allowed to obtain accu-
rate measurements of the Rp has been addressed in
the literature.56
The governing principles are best
understood through the concepts of impedance and
the Bode magnitude plot for the simplified Randles’
circuit (Figures 4[a] and [b]). Here, the maximum
applied frequency allowed to obtain Rs + Rp from the
FIGURE 8. Second derivative of E-iapp data (d2
iapp/d2
E) vs the sum
(␤a + ␤c) for icorr = 1.305, 13.05, and 130.5 µA/cm2
, indicating that
curvature of E-iapp data is a function of corrosion rate and Tafel
parameters.
CORROSION–Vol. 56, No. 2 209
CRITICAL REVIEW OF CORROSION SCIENCE AND ENGINEERING
low-frequency plateau can be approximated by:
fmax < fbp ≅
1
2πC Rs + Rp
(17)
where fbp is an approximation of the lower breakpoint
frequency (Hz) and fmax is the maximum test fre-
quency (Hz). Thus, it can be seen from Equation (17)
that increasing values of C, Rs, or Rp dictate that a
lower fmax is required to accurately obtain Rp + Rs on
the low-frequency plateau as Z␻→0 (Figure 4). Capaci-
tances may become larger than that expected for the
Cdl when adsorption C␾ are present. Such a C␾ may
be caused by an adsorbed intermediate with some
fractional monolayer coverage. Corrosion of steel in
concrete can complicate LPR measurements owing to
very large apparent capacitances that actually may
represent the finite diffusional impedance associated
with mass transport control of the oxygen reduction
reaction.57
One way that Rp may be increased is by
passivity. Another is by diffusion-controlled corrosion
such that Rp = Rct + RD. A 1-mHz frequency typically is
chosen as a reasonable initial choice of fmax, but it is
obvious from Equation (17) that either lower or
higher frequencies may be required depending upon
the exact values of Rs, Rp, and C. Since the magni-
tudes of C, Rs, and Rp are not known explicitly, a
priori prudence dictates that fmax be selected as one
tenth of the estimated fbp. Mansfeld and Kendig pro-
posed that fmax determined from the impedance
method defines the maximum voltage scan rate (vmax)
for the potentiodynamic method.43
This derivation is
based on the assumption that the vmax should not
exceed the maximum rate of change of voltage with
time during the sinusoidal voltage excitation at fmax.
vmax =
π∆Eppfmax
10
(18)
Here, ∆Epp is the peak-to-peak voltage excitation.
Therefore, vmax is 0.16 mV/s assuming a 10-mV
peak-to-peak amplitude for the equivalent circuit
shown in Figure 3 with Rp = 1,000 Ω, Rs = 10 Ω, and
C = 1,000 µF. If ∆E is ±5 mV, then the time required
for one complete cyclic voltammogram at such a
potential sweep rate is 125 s. However, for a slowly
corroding electrode with the Rs + Rp = 10,010 Ω, vmax
becomes 0.0157 mV/s and the time required is
1,250 s. Similarly, a frequency above the high-
frequency breakpoint (fhf) must be applied to obtain
Rs. Typically, fapp must be in the KHz range to deter-
mine accurately Rs:
fhf ≥
1
2πCRs
(19)
In separate but parallel efforts, Gabrielli,53
Macdonald,52
and Townley54
each discussed the
appropriate choice of voltage scan rates for accurate
Rp determination from small amplitude cyclic
voltammograms. Each investigator considered a
simple equivalent circuit (Figure 3[a]). Macdonald
and Townley derived the current response of the
standard three-element electrical equivalent circuit
to describe an electrochemical interface (Figure 3[a])
to a small amplitude triangular voltage excitation
(e.g., a potential sweep at fixed scan rate with a
reverse sweep at some peak potential). The E-iapp
response of this circuit to the triangular voltage exci-
tation was shown to be a complex function of circuit
elements, ∆Epp, and the voltage sweep rate. The rela-
tionships between the various ∆E/∆iapp slopes (R) and
scan rate were determined. Macdonald characterized
the E-iapp response by the diagonal resistance associ-
ated with iapp at the peak potentials, Rd. The apparent
resistance (Rapp) determined from the tangent to the
E-iapp curve at the end of the upward sweep before
the downward sweep (and vice versa), Rapp, and the
hysteresis current. Townley obtained Rmeas, which is
similar to the tangent resistance, Rapp:
1
Rd
=
1
Rs + Rp
+
2Rp
2
C
∆E Rs + Rp
ea∆Epp/vb
– 1
ea∆Epp/vb
+ 1
(20)
1
Rapp
=
1
Rs + Rp
+
2Rp
Rs Rs + Rp
1
1 + ea∆Epp/vb
(21)
1
Rmeas
=
1
Rs + Rp
+
Rp
Rs Rs + Rp
e–t/τ
(22)
In these equations, a = Rs + Rp, b = RsRpC, t is time,
v is sweep rate, and τ = 1/RsC + 1/RpC. Time (t) in
Equation (22) can be equated to the sweep rate since
t = ∆Epp/v. Therefore, all three equations include a
term that is independent of the voltage scan rate and
a second transient term that depends on voltage scan
rate or time relative to the RC time constant of the
equivalent circuit representing the electrochemical
interface. The scan rate dependent term becomes
negligible at low scan rates. These analyses predict
an increase in current hysteresis and deviation of Rd
and Rmeas from Rp + Rs at high scan rates, as shown in
the theoretical cyclic E-iapp data of Figure 9(a). Figure
9(b) shows actual experimental results from a Cu-Ni
alloy in flowing seawater. A plot of experimental 1/Rd
and 1/Rapp data vs scan rate is shown in Figure 9(c)
for the Cu-Ni system. Macdonald and Townley de-
duced (Equations [21] and [22]) that it is theoretically
210 CORROSION–FEBRUARY 2000
CRITICAL REVIEW OF CORROSION SCIENCE AND ENGINEERING
possible in the ideal case to determine Rp + Rs from
the tangent to the E-iapp curve at the end of the for-
ward and reverse sweeps at much higher scan rates
than predicted by Equations (17) and (18). The ideal
scan rate maxima can be seen in Figures 10(a) and
(b) for the same circuit parameters as examined
above (i.e., Rs = 10 Ω, Rp = 1,000 Ω, and C = 10–3
F).
Specifically, it is shown that 1/Rmeas and 1/Rapp ap-
proach the values 1/(Rs + Rp) at scan rates as high as
100 mV/s when the slope of the E-iapp plot is care-
fully taken at the very end of the forward or reverse
voltage scan just before reversal. However, accurate
determination of 1/(Rs + Rp) from experimental 1/Rd
values still requires a scan rate < 1 mV/s, which is in
agreement with the predictions from Equations (17)
and (18).
The equivalence of Rapp to (Rs + Rp) at fast scan
rate must be treated with precaution in real corrod-
ing systems. Such an equivalence is only true for
ideal, fast charge-transfer-controlled corrosion pro-
cesses and ideal finite Cdl (e.g., when Rp = Rct). The
presence of mass transport control or an adsorption
C␾ caused by formation of an adsorbed intermediate
that participates in the corrosion process may com-
plicate the results and the ability to use faster scan
rates. Roles of adsorbed intermediates and mass
transport in corrosion may not be accounted for
properly at very fast scan rates because the surface
coverage and diffusional boundary layer does not
have time to react fully and adjust to a very fast
change in voltage. Rct may be determined instead of
Rp at the DC limit if the scan rate is so fast so as to
freeze in the coverage (Figure 3[c]). Unfortunately, a
sufficiently fast scan rate that “freezes-in” an inter-
mediate coverage also may result in large capacitive
currents that could result in Rd values far below Rp.
Moreover, as the scan rate or frequency is lowered,
the effects of an adsorbed intermediate that gives rise
to an adsorption C␾ and dependency of Rp on the
sum of Rct and the parallel impedance of C␾||RF be-
come factors in the resistance measured (Figure 3[c]).
Indeed, Macdonald observed that an accurate value
of Rs + Rp was, in fact, not obtained from Rapp or Rd
determined at fast scan rates for a corroding Cu-Ni
alloy in flowing seawater (Figures 9[b] and [c]).52
The
experimental case of Cu-Ni in seawater shows that a
much lower scan rate is required despite the more
optimistic predictions of Equations (20) through (22)
(Figures 10[a] and [b]). In contrast, a model like that
of Figure 3(a) for an ideal RpC interface, where Rp =
Rct, suggests that 4 mV/s to 20 mV/s scan rates
would be more than slow enough to obtain an Rapp
(a) (b) (c)
FIGURE 9. (a) Small amplitude cyclic voltammograms depicting the theoretical E-iapp response for the electrical equivalent
circuit of Figure 3(a) with RP = 1,000 Ω, Cdl = 1,000 µF, and RS = 10 Ω when triangle voltage excitation waveform is applied
to a corroding interface at the various scan rates indicated. All results are for the circuit parameters listed above. (b)
Experimental small amplitude cyclic voltammograms for 90:10 Cu-Ni in flowing seawater showing effect of voltage scan rate.
(c) Reciprocal values of Rd and Rapp vs scan rate obtained from experimental E-iapp data for 90:10 Cu-Ni in seawater. (D.D.
Macdonald, J. Electrochem. Soc. 125 (1978): p. 1,443. Reproduced by permission of The Electrochemical Society, Inc.)
CORROSION–Vol. 56, No. 2 211
CRITICAL REVIEW OF CORROSION SCIENCE AND ENGINEERING
value that approaches Rp. Experimentally, this is not
the case in the Cu-Ni system since corrosion rate
would be overestimated from such an assumption. In
this system, the O2 reduction reaction is likely at
least partially mass-transport controlled at the Ecorr
of the Cu-Ni alloy and adsorbed oxidized Cu interme-
diate species also control the overall dissolution
process.
Regarding measurement speed, Jones and
Greene proposed that a current step method was
attractive because of measurement speed and ability
to contend with Ecorr drift during the time taken to
conduct the measurement.58
For negligible Rs, it has
been shown the potential transient during a current
step is given by:
Eapp = Ecorr + iappRp 1 – exp–t/RpC
(23)
When t ≥ 4 RpC, Eapp reaches 98% of the value
achieved at infinite time. Therefore, the polarization
resistance condition is reached when t ≥ 4 RpC, and
Equation (23) reduces to ∆E/iapp = Rp. The time re-
quired to reach this condition is ~ 4 s for Rp = 1,000 Ω,
Rs = 10 Ω, and C = 1,000 µF. However, the time
required for a slowly corroding electrode with Rp =
10,000 Ω is ~ 40 s. Thus, in comparison to polariza-
tion scans using the voltage scan rates predicted
from Equation (18), the time required for a single
current step to approach steady state is much less
than the time required to complete a low-amplitude
cyclic voltammogram given exactly the same electri-
cal equivalent circuit parameters. It also has been
argued that the measurement of overvoltages at
selected times after a series of small current steps
produces ∆E vs iapp plots that develop linear slopes
approximating the steady-state conditions after in-
complete, short periods of decay.58
Finally, short time, fast scan rate, or high fmax
concerns equally plague time as well as frequency
domain methods for obtaining Rp, since in the time
domain measurement, the triangle waveform is sim-
ply the Fourier synthesis of a series of sinusoidal
signal functions. However, voltage sweep, potential
step, and impedance methods should all yield the
same value of Rp when all the scan rate and AC fre-
quency precautions discussed above are taken into
consideration such that the low-frequency plateau
in |Z(␻)| data is obtained and this data represents
Rp + Rs. This has been demonstrated by Syrett in a
study that produced Rp values that were independent
of voltage excitation waveform.59
Use of Rct vs Rp When the Adsorbed
Intermediate Surface Coverages Affect
Anodic and/or Cathodic Reaction Rates
Some complexities remain concerning whether to
use Rct at intermediate frequencies instead of Rp at
the DC limit when attempting to conduct corrosion
rate determinations in the presence of adsorbed in-
termediate surface coverages that affect anodic and/
or cathodic reaction rates. To address this issue, it is
necessary to clarify the difference between Rct and Rp.
Recall the definition of Rp given by (∂E/∂iapp)at t=∞, ∆E=0.
To define Rct, consider a derivation of the slope of the
E-i app data from a cyclic voltammogram conducted
near Ecorr following the derivation of Epelboin.60-61
Iapp
is the difference between the anodic and cathodic
half-cell currents:
Iapp = Ia – Ic (24)
where the subscripts a and c represent the anodic
and cathodic half-cell reaction rates. Rp (Ω) is given
in terms of Ia and Ic as:
(a)
(b)
FIGURE 10. Relationship between measured Rapp, Rd, and Rmeas and
scan rate using Equations (20) through (22) for the circuit model of
Figure 3(a) with RP = 1,000 Ω, C dl = 1,000 µF, and RS = 10 Ω. The
impedance of the system at the limit of zero scan rate is RS + RP. The
impedance of the system at infinite scan rate is RS. Measured Rapp,
Rd, and Rmeas values lie in between these limits depending on scan
rate: (a) linear scale and (b) semilogarithmic scale. The predicted vmax
from Equations (17) and (18) is indicated.
212 CORROSION–FEBRUARY 2000
CRITICAL REVIEW OF CORROSION SCIENCE AND ENGINEERING
1
Rp
=
∂Iapp
∂E
t=∞,∆E=0
=
∂Ia
∂E
_
∂Ic
∂E
(25)
When the low-overpotential linear approximation is
valid at small values of ∆E, ∂Ia/∂E, and ∂Ic/∂E =
2.3I(a)corr/␤a and –2.3I(c)corr/␤c, respectively. Here, I(a)corr
and I(c)corr describe the anodic and cathodic currents
at the corrosion potential. At Ecorr, these equal Icorr,
and ␤a and ␤c are Tafel slopes for the anodic and ca-
thodic reactions.
1
Rp
=
1
Rct
=
∂Iapp
∂E
= 2.3Icorr
1
βa
+
1
βa
(26)
A complexity arises in taking the derivatives ∂Ia/∂E
and ∂Ic/∂E if a corrosion reaction is considered that
depends upon the surface coverage (␪) of an interme-
diate that participates in the anodic dissolution or
cathodic reduction reactions. Here, either the overall
anodic or cathodic reaction or both occur on only a
fraction ␪ of the total electrode surface area (A). An
oxidized intermediate is typical of corrosion
processes that involve multiple oxidation or electro-
chemical reaction steps that must be completed
sequentially to describe the overall reaction rate. The
reaction only can proceed on the fraction of surface
area containing the required intermediate. Example
of intermediates during active metallic dissolution
include Fe/Fe(OH)/Fe(OH)+
/Fe+2
and Ti(OH–
)/Ti(OH)/
Ti(OH)+
/Ti(OH)2+
/Ti(OH)3+
/Ti3+
,62-63
although no Tafel
E-log(ia) region is observed in the case of the latter. In
these cases, the overall corrosion rate may depend
upon the coverage of the anodic intermediate ␪a,
depending upon the exact rate-determining step.
Similarly, a cathodic reaction such hydrogen evolu-
tion (HER) may depend upon the coverage of bare
sites, special sites, or for the electrochemical desorp-
tion HER mechanism by sites already covered with
adsorbed hydrogen (␪c). Depending on the HER
mechanism, the rate may increase or decrease with
coverage. Often, these coverages are potential depen-
dent. The reaction rate per fractional area is then
ia = Ia/␪a and ic = Ic/␪a assuming unity electrode area
(A). Rp will depend on two terms that yield the overall
slope ∂Iapp/∂E at fixed coverage and two terms that
are dependent on the variation in the coverages with
potential:
1
Rp
=
∂Iapp
∂E
= θa
∂ia
∂E
– θc
∂ic
∂E
+ ia
∂θa
∂E
– ic
∂θc
∂E
(27)
The first two right-hand terms equal Rct in this
simple analysis where charge transfer describes
simple interface charge-transfer control occurring
quickly (subject to charging of the Cdl) at fixed cover-
ages ␪a and ␪c. The dependency of Rp on reaction
intermediate coverage occurs when the third and
fourth terms apply. The third and fourth terms can
be ignored under two conditions. In either case, Rp
then equals Rct given by the first two terms. The first
condition is the simple ideal case where the cover-
ages are fixed at a value equal to the coverage
present at Ecorr or there is no coverage involved and
reactions proceed over the total bare area of the elec-
trode. The second case is at some high voltage scan
rate or AC frequency, where the applied potential (E)
changes too quickly to allow the coverage to be modi-
fied during the potential sweep or sinusoidal voltage
excitation (the potential sweep must not be so fast so
as to produce appreciable Cdl currents). At fast scan
rate, the coverages present at Ecorr are effectively
“frozen in” and the third and fourth terms equal zero.
The current shorts through the C␾ created by such a
coverage (Figure 3[c]).22
If ideal charge-transfer con-
trol is assumed at fixed coverages, ia and ic respond
almost instantaneously to an applied potential
through the following relationships:
ia = i(a)corr exp
2.3 E – Ecorr
βaθ(a)corr
(28)
ic = i(c)corr exp
–2.3 E – Ecorr
βcθ(c)corr
(29)
where ␤a␪(a)corr and ␤c␪(c)corr give the Tafel slopes at a
fixed coverage equal to the coverages present at Ecorr.
Taking the derivatives ∂ia/∂E and ∂ic/∂E using the
small overpotential approximation yields ia =
2.3i(a)corr/␤a␪(a)corr and ic = –2.3i(c)corr/␤c␪(c)corr. Making
these substitutions, recognizing that icorr = ia(corr) =
ic(corr), and rearranging yields the Stern-Geary equa-
tion in a slightly different form:
1
Rp
=
∂Iapp
∂E
= θ(a)corr
2.3i(a)corr
βa
+ θ(c)corr
2.3i(c)corr
βc
(30)
Recognizing that i(a)corr = Ia(corr)/␪a(corr) , i(c)corr = Ic(corr)/
␪a(corr), Icorr = Ia(corr) = Ic(corr), and by making these substi-
tutions, a familiar linear relation is obtained with the
simple distinction that ␤a␪(a)corr and ␤c␪(c)corr define the
Tafel slopes for the coverages present at the Ecorr:
∂Iapp
∂E
=
1
Rp
= 2.3Icorr
1
βaθ(a)corr
+
1
βcθ(c)corr
(31)
CORROSION–Vol. 56, No. 2 213
CRITICAL REVIEW OF CORROSION SCIENCE AND ENGINEERING
Thus, Rct = Rp in the simple cases where ideally fast
charge transfer occurs and the coverage is fixed or
when there is no coverage dependency.
A more complicated result is obtained at slow
scan rate or low AC frequency when the coverage can
change with potential. Again, the linear approxima-
tion is enabled as ∆E becomes small:
∂Iapp
∂E
=
1
Rp
= 2.3Icorr
1
βaθ(a)corr
+
1
βcθ(c)corr
+
Icorr
1
θa
∂θa
∂E
–
1
θc
∂θc
∂E
(32)
The first right-hand term is 1/Rct (e.g., the instanta-
neous portion related to the faradaic current) and
the whole right-hand expression gives 1/Rp.60-61
The
1/␪(∂␪/dE) terms are typical nonzero contributions at
Ecorr when there are potential dependent coverages
that are nonzero near Ecorr. There is absolutely no
reason that the coverages should be zero at Ecorr
since the corrosion potential is an “open-circuit” po-
tential established at a specific potential somewhere
between the respective reversible electrode potentials
of the cathodic and anodic half-cell reactions. Spe-
cifically, Ecorr is established at the potential where ia␪a
A = ic␪c A. Therefore, it is clear that Rp may be > or
< Rct, depending whether the partial derivatives
∂␪a/∂E and ∂␪c/∂E are positive or negative quantities
as the applied potential is swept in forward and re-
verse directions. This can account for the common
observation that Rp > Rct in the case of so-called
pseudo-capacitive behavior,22
as shown in the circuit
model of Figure 3(c) containing an adsorption
pseudo-capacitance. Moreover, it is possible that
Rp < Rct,64
as in the case of so-called pseudo-inductive
behavior where an inductance is observed at low fre-
quency (Figure 6[b]63
). The condition, Rp > Rct, has
been seen by subtracting the Cdl from the faraday im-
pedance data.65
Thus, Equation (32) supports the
view that Rp at the zero frequency limit can be < or
> Rct, depending on how the coverages that factor
into the anodic and cathodic reaction rates change
with potential. The differences between Rp and Rct are
observed sometime to decrease when the magnitude
of the voltage perturbation is reduced such that the
coverage is negligibly altered.64
An alternative view of
the effect of voltage perturbation in the case of in-
hibitors is that the inhibitor is desorbed irreversibly
by potential scanning above Ecorr such that the corro-
sion rate is increased.64
However, such phenomena
also might be understood using Equation (32) since
Rp would be expected to be similar to Rct when the
voltage perturbation is smaller. Also, physically unre-
alistic parameters such as the electrical inductor do
not have to be invoked. It is tempting to eliminate the
right-hand second term by conducting experiments
at fast scan rate to freeze-in or fix the coverages.66
However, the lower impedance of the Cdl and
adsorption C␾ at high frequency may complicate
measurements by switching capacitive currents into
the iapp measurement. Furthermore, it also must be
recognized that the Tafel slopes presented in the first
right-hand term of Equation (32) still would need to
be the “iso-coverage” Tafel slopes, ideally obtained by
experiments where the coverages were fixed at their
values present at Ecorr. Unfortunately, ␤a and ␤c rarely
are obtained under iso-coverage conditions in practi-
cal corrosion situations.67-71
Iso-coverage Tafel
parameters have been produced by correction of HER
reaction rate data by exploiting hydrogen absorption
and permeation through iron foils to control cover-
age.67
Here, foil thickness decreased as current
density is increased to change permeation flux such
that surface coverage is held constant over a range of
reaction rates. Consequently, determination of corro-
sion rates in the presence of adsorbed intermediates
is not a simple matter of obtaining Rct at high fre-
quency or scan rate, where ∂␪a/∂E equals zero
because ␪ might be frozen during such rapid poten-
tial changes. As shown here, another source of errors
is the values of ␤a and ␤c obtained in slow scans at
high overpotential because this mixes ∆E-iapp data
where the coverage is frozen-in (e.g., Rct) with E-
log(iapp) Tafel data (e.g., ␤a and ␤c) where potential
dependent coverages may differ from those at Ecorr.
An additional problem is that there is now another
reason why ∂i/∂E should not be linear even as ∆E
approaches zero if the coverage changes significantly
with potential over the same potential range. More-
over, there is no reason why E-log (iapp) data obtained
over a large potential range should be linear on a
semi-log plot when the coverage changes with poten-
tial. Nonstraight Tafel data often are observed.68,71
Theoretical E-log iapp data with changing intermediate
coverage are shown in Figure 11. The data is pre-
sented for charge-transfer-controlled oxidation
kinetics over a fraction of the surface area given by
coverage ␪a. The E-log(iapp) curve was created under
the following conditions. Anodic coverage (␪a) is com-
monly an exponential function of potential as
governed by the following expression assuming a
Langmuir isotherm. This expression yields a nonzero
coverage at E = Ecorr:
θa
1 + θa
= kexp
F E – Erev
RT
(33)
As an example, a hypothetical E-iapp relationship is
considered for corrosion involving an overall oxida-
tion half-cell reaction (M + OH–
→ MOH+
+ 2e–
) that
depends on the coverage ␪a as described in Equation
214 CORROSION–FEBRUARY 2000
CRITICAL REVIEW OF CORROSION SCIENCE AND ENGINEERING
(33) for the adsorbed intermediate MOH that partici-
pates in a series of single electron transfer reactions.
The cathodic reaction in this example is assumed to
be the fast-discharge slow electrochemical desorption
hydrogen evolution reaction. This HER reaction rate
depends on the coverage of adsorbed hydrogen. This
situation is similar to the corrosion mechanism of
iron in acid where either the catalyzed mechanism of
Huesler72-73
or the intermediate mechanism of
Bockris62
involves an anodic half-cell reaction whose
rate depends on the coverage of the adsorbed com-
plex FeOHads. In the present example, the coverage of
the hypothetical activated complex MOHads is a factor
determining the overall anodic half-cell reaction rate.
Consider the case where the coverage changes form
near zero to near one in the vicinity of Ecorr, such that
the assumption of a fixed Tafel slope is unrealistic,
even though it often is assumed to be constant in the
literature. In conventional textbook examples, the
coverage is assumed to either remain near zero or
near unity and a fixed Tafel slope can be developed
and used as a reaction diagnostic. For instance, the
Tafel slope often is taken to be constant at ␤a =
2.3RT/[(1 + 2␣a)F], assuming a low coverage (␪a) at all
potentials when the FeOHads coverage is an exponen-
tial function of potential. In this case, the Tafel slope
approaches 0.029 V when the symmetry factor (␣a) is
0.5 in agreement with experimental data. However,
the assumption has been made that ␪a remains low
over the entire potential range of the experiment.
This is not the case in the hypothetical example
used here. If coverages change considerably in the
potential range studied, the more general expression
should be used where ␪a is determined from Equation
(33):
Iapp = icorrA θaexp
αaF E – Ecorr
RT
– θcexp
–αcF E – Ecorr
RT
(34)
Here, the anodic and cathodic reactions increase
with the coverages of adsorbed MOH and H species,
the coverages change from near zero to near unity
over the potential range near Ecorr, and the Langmuir
isotherm is assumed. In this case, the condition of
equality at Ecorr is that ia(corr) A ␪a(corr) = ic(corr) A ␪c(corr),
where A is the total electrode area. Under these
simple assumptions, the resulting E-log(iapp) data ex-
hibits a continuously varying slope ∂E/∂log (iapp) that
does not yield a single value for ␤a until ␪a reaches
one (Figure 11). Therefore, to determine the corrosion
rate in a rigorously correct manner in the case of
adsorbed intermediate coverages that change near
Ecorr, Rct obtained from suitably fast scans only can
be used only if ␤a and ␤c values also are representa-
tive of the iso-coverage conditions existing at Ecorr. In
other words, Tafel slopes need to be determined at a
relevant frozen-in or fixed coverage. This could be
achieved by obtaining ␤a and ␤c from fitting E-iapp
data near Ecorr under the premise that coverage
changes only slightly at low ∆E; producing iso-cover-
age Tafel data from E-log(iapp) data fixed at the
coverage present at Ecorr; or determining Tafel slopes
from E-log(iapp) data at fast scan rate to freeze-in ␪a
and ␪, assuming negligible capacitive current. Unfor-
tunately, the merits of these various methods toward
producing accurate results compared to one another
remain relatively untested. Obviously, numerous
(a)
(b)
FIGURE 11. (a) Theoretical E-log(Iapp) plot and (b) corresponding
E-Iapp plot for reactions rates that depend upon film coverage based
on Equation (34). The anodic coverage is an exponential function of
potential according to Equation (33) with k = 0.01 in the case of the
dotted curve. The dashed curve is constructed at fixed coverages
(␪a [E = Ecorr] = 0.068, ␪HER [E = Ecorr] = 0.06) equal to the coverages
present at OCP (0 V). The solid curve assumes no role of coverage
such that the reaction proceeds over the entire electrode area of
1 cm2
. The open-circuit potential was selected arbitrarily to be 0 mV,
and the corrosion rate is 1.3 µA/cm2
per unit area covered with the
intermediate film MOH. ␤a = ␤c = 120 mV in all calculations.
CORROSION–Vol. 56, No. 2 215
CRITICAL REVIEW OF CORROSION SCIENCE AND ENGINEERING
other situations can be envisioned that have not
been covered here, such as inhibiting species desorb-
ing as a function of potential, coverage governed by
Frumkin or Temkin isotherms, reaction mechanisms
that change near Ecorr, or multiple-step, single-
electron-transfer reactions that have other coverage
dependencies, etc. The purpose of the present ex-
ample was only to illustrate the role of changing
coverage in creating a difference between Rct and Rp
and in adding complexities to the determination of
Tafel slopes.
Rp still is often estimated from slow scans ap-
proaching the DC limit by taking a tangent to the
nonlinear E-iapp data near Ecorr. The Stern-Geary
approximation still is utilized to estimate icorr using
an apparent B factor involving apparent Tafel slopes
that are imprecise. Such data still often agrees with
gravimetric mass loss and solution analysis data.
Two reasons emerge. Although the terms 1/␪(∂␪/dE)
in Equation (32) are often nonzero at Ecorr, they often
are small. Moreover, the weak dependence of
corrosion rate on the parameter B in the Stern
approximation permits imprecise estimates of Tafel
slope to be tolerated in many cases. Of course, Rp
values obtained at extremely low-frequency or scan
rates should be used in the modified Stern equation
in the case of total mass transport control of either
the anodic or cathodic reaction (with an infinite Tafel
slope for the mass-transport-controlled reaction) as
well as in the case of passive dissolution. Use of the
Rct obtained at higher frequency or scan rate yields
the value of corrosion rate that would be pertinent if
both anodic and cathodic reactions were under in-
stantaneous charge-transfer control. Rct should be
used in the Stern approximation if Tafel slopes under
charge-transfer-controlled conditions are utilized.66
In some cases, effects of inhibitor concentration on
iron corrosion rate were best assessed using Rct as
opposed to Rp.66
Effect of Solution Resistance
Another frequently encountered complication is
the need to correct polarization data for errors that
arise from the contribution of Rs. Rs contributes to a
voltage error as well as a scan rate error.2
Since the
applied potential is increased by an ohmic voltage
component, an apparent value of Rp is obtained,
which overestimates Rp by an amount equal to Rs.
Consequently, the corrosion rate is underestimated.
Nonuniform Current and Potential Distributions
to Polarization Resistance Probes
A dimensionless parameter known as the
Wagner number is useful for qualitatively predicting
whether a current distribution will be uniform or
nonuniform.2,74-75
This parameter helps to answer the
question of which current distribution applies to the
electrochemical cell: primary, secondary, or tertiary?
The Wagner parameter (W) is the ratio of the
kinetic resistance to the ohmic resistance. The W is
the ratio of the true polarization slope given by the
partial derivative, ∂Etrue/∂iapp, (evaluated at the
overpotential of interest at constant pressure, tem-
perature, and concentration) divided by the
characteristic length and the Rs.2,74
W =
κ
L
∂E
∂i
(35)
where ␬ (or 1/␳) is the specific solution conductivity
(Ω-cm)–1
and L is a characteristic length (cm), or the
dimension of “irregularity.” Its value marks the tran-
sition from the primary to the secondary current
distribution. When the Wagner number is much less
than 1, the ohmic component dominates and current
and potential distributions are governed primarily by
cell geometry. When it is much larger than 1, the
kinetic component dominates and the resistance of
the interface primarily governs the current flow from
counter electrode to working electrode. In practice,
the primary current distribution is said to exist when
W < 0.1, and the secondary current distribution ex-
ists if W > 102
. The partial derivative, ∂E/∂i, can be
taken from any expression describing the interfacial
potential (Etrue) as a function of iapp or obtained as a
Rp from experimental E vs iapp data. The partial de-
rivative, ∂E/∂i, has the units of Ω-cm2
. The Rs
expressed in the same units is given by (␬/L). The
resulting Wagner number in the low-overpotential
region where the linear E-i approximation can be
applied is:
W =
Rp
Rs
(36)
Thus, the experimenter interested in estimating the
current distribution “regime” pertinent to their polar-
ization cell can estimate whether the primary or
secondary current distribution applies from knowl-
edge of Rp and Rs. The corrosion engineer can use
this information in the following way. If the primary
current distribution applies (W < 0.1), then current
distributions are likely to be very nonuniform unless
an ideal cell geometry leading to a uniform primary
current distribution is used. Otherwise, errors in
polarization resistance and other kinetic parameters
are then likely because the electrode area actually
undergoing polarization differs from the total area.
Low scan rate data at the zero frequency limit may
yield the same apparent value of Rp + Rs, but the area
required to compute a true Rp value is uncertain.
Errors in Rp from nonuniform primary or second-
ary current distributions have been documented.76
Data presented in the literature (Figure 12) show
216 CORROSION–FEBRUARY 2000
CRITICAL REVIEW OF CORROSION SCIENCE AND ENGINEERING
examples of the extent of such errors.77
Positioning
of the reference electrode at the center, edge, and at
infinity with respect to the disk-shaped working elec-
trode altered the apparent polarization resistance
value (Reff) by some amount relative to the true value
given by Rp. Placement at the edge is typical of flush-
mounted probes. The source of difference between
Rp and Reff with position lies in the fact that no single
Rs value applies for all electrode positions. In other
words, there is a nonuniform ohmic potential drop
over the disk. There can be large errors depending on
reference electrode position (center, infinity, edge),
solution conductivity geometry, and Rp.73
When solu-
tion conductivity (␬) and Reff are increased, the
Wagner number becomes larger, indicating a more
uniform current distribution and minimization of this
source of error. Similarly, counter and reference elec-
trode placement in low conductivity environments
can alter Rs values and apparent Reff values.78
SUMMARY
The polarization resistance method, when per-
formed properly, enables reliable determinations of
instantaneous corrosion rates. Modern methods for
obtaining Rp data such as the electrochemical imped-
ance as well as statistical and spectral noise methods
are now available. The Rsn(␻) has been shown in the
literature to be equivalent to the electrochemical im-
pedance over the same frequency range for identical
electrodes in a two-electrode cell. The Rsn(␻) near the
zero frequency limit is proportional to Rp if the im-
pedance yields Rp over the same range of frequency.
The statistical noise resistance taken from E-t and
iapp-t data is typically equivalent to the cell impedance
at some frequency above zero. Traditional sources
of error such as high excitation voltage amplitude,
insufficiently slow scan rate, high AC frequency,
inadequate polarization hold period, high solution
resistance, presence of parallel reduction-oxidation
reactions, and nonuniform current and potential dis-
tributions can confound accurate determination of
corrosion rate. Lastly, the affects of potential-depen-
dent adsorbed intermediate films that regulate the
overall reaction rate and adsorption C␾ on electro-
chemical reaction rates are discussed with emphasis
on how they influence the measured interfacial resis-
tance. The Rct can be obtained if the coverage is
unchanged by excitation voltage but it may be larger
or smaller than Rp.
ACKNOWLEDGMENTS
Financial support from the Air Force Office of
Scientific Research (Major H.D. Long) and The Office
of Naval Research (A.J. Sedriks) is acknowledged.
Electrochemical Instrumentation and Software in the
Center for Electrochemical Science and Engineering
are supported by EG&G Instruments and Scribner
Associates, Inc. C. Quarmby and R. Leggat assisted
in manuscript preparation.
REFERENCES
1. J.O’M. Bockris, A.K.N. Reddy, Modern Electrochemistry 2 (New
York, NY: Plenum Press, 1970).
2. E. Gileadi, Electrode Kinetics for Chemists, Chemical Engi-
neers, and Materials Scientists (New York, NY: VCH Publishers,
1993).
3. D.A. Jones, Principles and Prevention of Corrosion (New York,
NY: Macmillan Publishing, 1992).
4. M. Stern, R.M. Roth, J. Electrochem. Soc. l04 (1957): p. 390.
5. M. Stern, A.L. Geary, J. Electrochem. Soc. 105 (1958): p. 638.
6. M. Stern, A.L. Geary, J. Electrochem. Soc. 104 (1957): p. 56.
7. I. Epelboin, C. Gabrielli, M. Keddam, H. Takenouti, Electro-
chemical Corrosion Testing, STP 727, eds. F. Mansfeld, U.
Bertocci (West Conshohocken, PA: ASTM, 1981), p. 150.
8. M. Stern, E.D. Weisert, “Experimental Observations on the
Relation Between Polarization Resistance and Corrosion Rate,”
in ASTM Proceedings, vol. 59 (West Conshohocken, PA: ASTM,
1959), p. 1,280.
9. D 2776-79, 03.02, “Test Methods for Corrosivity of Water in the
Absence of Heat Transfer (Electrical Methods),” Annual Book of
ASTM Standards (West Conshohocken, PA: ASTM).
10. ASTM Standard G-59, “Standard Practice for Conducting Poten-
tiodynamic Polarization Resistance Measurements,” Annual
Book of Standards (West Conshohocken, PA: ASTM).
11. F. Mansfeld, Electrochemical Techniques for Corrosion, ed. R.
Baboian (Houston, TX: NACE, 1977), p. 18.
12. D.A. Jones, N.D. Greene, Corrosion 22 (1966): p. 198.
13. D.A. Jones, Corrosion 39 (1983): p. 444.
14. K.B. Oldham, F. Mansfeld, Corros. Sci. 13 (1973): p. 813.
15. F. Mansfeld, J. Electrochem. Soc. 120 (1973): p. 515.
16. D.D. MacDonald, M.C.H. McKubre, Electrochemical Corrosion
Testing, STP 727, eds. F. Mansfeld, U. Bertocci (West
Conshohocken, PA: ASTM, 1981), p. 110.
FIGURE 12. Relationship between the measured Reff value and true
Rp value at ␻ = 0 for nonuniform current distributions to a flush-
mounted electrode. The error decreases with increasing Wagner
number, which is equivalent to a decreasing error as Reff and solution
conductivity increase.77
CORROSION–Vol. 56, No. 2 217
CRITICAL REVIEW OF CORROSION SCIENCE AND ENGINEERING
17. A.J. Bard, L.R. Faulkner, Electrochemical Methods: Fundamen-
tals and Applications (New York, NY: John Wiley and Sons, 1980).
18. F. Mansfeld, Corrosion 36, 5 (1981): p. 301.
19. F. Mansfeld, M.W. Kendig, S. Tsai, Corrosion 38 (1982): p. 570.
20. ASTM G 106, vol. 03.02, “Practice for Verification of Algorithm
and Equipment for Electrochemical Impedance Measurements,”
Annual Book of ASTM Standards (West Conshohocken, PA:
ASTM).
21. D.R. Franceschetti, J.R. Macdonald, Electroanal. Chem. 101
(1979): p. 307.
22. S.R. Taylor, E. Gileadi, Corrosion 51 (1995): p. 664.
23. D.A. Eden, A.N. Rothwell, J.L. Dawson, “Electrochemical
Noise for Detection of Susceptibility to Stress Corrosion Crack-
ing,” CORROSION/91, paper no. 444 (Houston, TX: NACE,
1991).
24. J.L. Dawson, ASTM STP 1277, “Electrochemical Noise Measure-
ment for Corrosion Applications,” eds. J. Kearns, J.R. Scully,
P.R. Roberge, D.L. Reichert, J.L. Dawson (West Conshohocken,
PA: ASTM, 1996), p. 3-35.
25. D.A. Eden, K. Hladky, D.G. John, J.L. Dawson, “Electrochemi-
cal Noise — Simultaneous Monitoring of Potential and Current
Noise Signals from Corroding Electrodes,” CORROSION/86,
paper no. 274 (Houston, TX: NACE, 1986).
26. D.A. Eden, A.N. Rothwell, “Electrochemical Noise Data: Analy-
sis Interpretation Presentation,” CORROSION/92, paper no.
292 (Houston, TX: NACE, 1992).
27. A.N. Rothwell, D.A. Eden, “Electrochemical Noise Techniques
for Determining Corrosion Rates and Mechanisms,” CORRO-
SION/92, paper no. 223 (Houston, TX: NACE, 1992).
28. U. Bertocci, ASTM STP 1277, “Electrochemical Noise Measure-
ment for Corrosion Applications,” eds. J. Kearns, J.R. Scully,
P.R. Roberge, D.L. Reichert, J.L. Dawson (West Conshohocken,
PA: ASTM, 1996), p. 39-58.
29. U. Bertocci, F. Huet, Corrosion 51 (1995): p. 131.
30. D.L. Reichert, ASTM STP 1277, “Electrochemical Noise Mea-
surement for Corrosion Applications,” eds. J. Kearns, J.R.
Scully, P.R. Roberge, D.L. Reichert, J.L. Dawson (West
Conshohocken, PA: ASTM, 1996), p. 79-89.
31. P.C. Searson, J.L. Dawson, J. Electrochem. Soc. 135, 8 (1988):
p. 1,908.
32. F. Mansfeld, H. Xiao, ASTM STP 1277, “Electrochemical Noise
Measurement for Corrosion Applications,” eds. J. Kearns, J.R.
Scully, P.R. Roberge, D.L. Reichert, J.L. Dawson (West
Conshohocken, PA: ASTM, 1996), p. 59-78.
33. G.P. Bierwagen, J. Electrochem. Soc. 141 (1994): p. L155.
34. F. Mansfeld, H. Xiao, J. Electrochem. Soc. 141 (1994): p. 1,402.
35. F. Huet, J. Electrochem. Soc. 142 (1995): p. 2,861.
36. J.F. Chen, W.F. Bogaerts, Corros. Sci. 37 (1995): p. 1,839.
37. H. Xiao, F. Mansfeld, J. Electrochem. Soc. 141 (1994): p. 2,332
38. F. Mansfeld, H. Xiao, J. Electrochem. Soc. 140 (1993): p. 2,205
39. F. Mansfeld, L.T. Han, C.C. Lee, J. Electrochem. Soc. 143
(1996): p. L286.
40. U. Bertocci, C. Gabrielli, F. Huet, M. Keddam, J. Electrochem.
Soc. 144 (1997): p. 31.
41. U. Bertocci, C. Gabrielli, F. Huet, M. Keddam, J. Electrochem.
Soc. 144 (1997): p. 37.
42. A. Bautista, F. Huet, J. Electrochem. Soc. 146 (1999): p. 1,730-
1,736.
43. F. Mansfeld, M. Kendig, Corrosion 37, 9 (1981): p. 556.
44. R. Bandy, D.A. Jones, Corrosion 32 (1976): p. 126.
45. M.J. Danielson, Corrosion 36, 4 (1980): p. 174.
46. J.C. Reeve, G. Bech-Nielsen, Corros. Sci. 13 (1973): p. 351.
47. L.M. Callow, J.A. Richardson, J.L. Dawson, Brit. Corros. J. 11
(1976): p. 132.
48. F. Mansfeld, K.B. Oldham, Corros. Sci. 27 (1971): p. 434.
49. S. Barnartt, Corros. Sci. 9 (1969): p. 148.
50. R.L. Leroy, Corrosion 29 (1973): p. 272.
51. F. Mansfeld, Corrosion 29 (1973): p. 397.
52. D.D. MacDonald, J. Electrochem. Soc. 125 (1978): p. 1,443.
53. C. Gabrielli, M. Keddam, H. Takenouti, V. Kirk, F. Bourelier,
Electrochem. Acta 24 (1979): p. 61.
54. D.W. Townley, Corrosion 47 (1991): p. 737.
55. D.D. Macdonald, J. Electrochem. Soc. 125 (1979): p. 1,977.
56. F. Mansfeld, M. Kendig, Corrosion 37 (1981): p. 545.
57. K. Videm, R. Myrdal, Corrosion 53 (1997): p. 734.
58. D.A. Jones, N.D. Greene, Corrosion 22 (1966): p. 198.
59. B. Syrett, D.D. MacDonald, Corrosion 35 (1979): p. 505.
60. I. Epelboin, M. Keddam, J. Electrochem. Soc. 117 (1970): p.
1,052-1,056.
61. I. Epelboin, M. Keddam, H. Takenouti, J. Appl. Electrochem. 2
(1972): p. 71-79.
62. J.O’M. Bockris, D. Drazic, A.R. Despic, Electrochim. Acta 4
(1961): p. 315.
63. E.J. Kelly, J. Electrochem. Soc. 126, 12 (1979): p. 2,064-2,075.
64. W.J. Lorenz, F. Mansfeld, Corros. Sci. 21, 9 (1981): p. 647-672.
65. H. Schweikert, W.J. Lorenz, H. Friedburg, J. Electrochem. Soc.
127 (1980): p. 1,693.
66. I. Epelboin, C. Gabrielli, M. Keddam, H. Takenouto, ASTM STP
727, “Electrochemical Corrosion Testing,” eds. F. Mansfeld, U.
Bertocci, (West Conshohocken, PA: ASTM, 1981), p. 150-166.
67. R.N. Iyer, H.W. Pickering, J. Electrochem. Soc. 137, 11 (1990):
p. 3,512-3,514.
68. C. Cato, H.J. Grabke, B. Egert, G. Panzer, Corros. Sci. 24
(1984): p. 591.
69. E.G. Dafft, K. Bohnenkamp, H.J. Engell, Corros. Sci. 19 (1979):
p. 591.
70. R.N. Iyer, I. Takekeuchi, M. Zamanzadeh, H.W. Pickering, Cor-
rosion 46 (1990): p. 460.
71. R.S. Lillard, J.R. Scully, Corrosion 52 (1996): p. 125.
72. K.E. Heusler, Habilitation Thesis, Univ. Of Stuttgart, 1966.
73. K.F. Bonhoeffer, K.E. Heusler, Z. Phys., Chem., N.F., 8 (1956):
p. 390.
74. J. Newman, Electrochemical Systems (Englewood Cliffs, NJ:
Prentice Hall, Inc., 1973).
75. C. Wagner, J. Electrochem. Soc. 101 (1959): p. 225.
76. W.C. Ehrhardt, ASTM STP 1056, “The Measurement and Cor-
rection of Electrolyte Resistance in Electrochemical Cells,” eds.
Scribner, Taylor (West Conshohocken, PA: ASTM, 1990), p. 5-
26.
77. K. Nisancioglu, Corrosion 43 (1987): p. 258.
78. M.A. Pech-Canul, A.A. Sagues, P. Castro, Corrosion 54, 8
(1998): p. 663.
LIST OF SYMBOLS
A = electrode area (cm2
)
B = proportionality constant used in Stern-
Geary Equation
C = capacitance (farad-cm–2
)
Cdl = double layer capacitance (farad-cm–2
)
C␾ = adsorption pseudo-capacitance (farad-cm–2
)
E = electrochemical potential (volts)
Ecorr = corrosion potential (volts)
Erev = reversible electrode potential (volts)
F = Faraday’s constant (96,485 coul/equivalent)
f = frequency (s–1
)
fmax = maximum frequency (s–1
)
iapp = applied current density (amp-cm–2
)
icorr = corrosion current density (amp-cm–2
)
Ia = anodic half-cell current (amp)
Ic = cathodic half-cell current (amp)
IPSD = power spectral density of current noise
(amp2
-Hz–1
)
j = √-1
k = pre-exponential term defining Langmuir
coverage
q = charge (farads)
qF = charge in adsorbed film (farads)
qM = charge associated with one monolayer of
film (farads)
R = ideal gas constant (8.31441 J-mol–1
-K–1
)
Rs = solution resistance (Ω-cm2
)
Rct = charge-transfer reaction resistance (Ω-cm2
)
Reff = measured resistance at DC limit in case of
nonuniform current distribution (Ω-cm2
)
RF = additional reaction resistance in the pres-
218 CORROSION–FEBRUARY 2000
CRITICAL REVIEW OF CORROSION SCIENCE AND ENGINEERING
ence of an adsorbed intermediate that cre-
ates additional resistance to charge
transfer at the interphase (Ω-cm2
)
Rp = polarization resistance (Ω-cm2
)
RD = reaction resistance under mass transport
control (Ω-cm2
)
Rd = diagonal resistance from E-iapp plot (Ω-cm2
)
Rapp = tangent resistance from E-iapp plot (Ω-cm2
)
Rn = noise resistance (Ω-cm2
)
Rsn(␻) = spectral noise resistance (Ω)
s = diffusional impedance time factor, leff
2
/D (s)
t = time (s)
T = total time of measurement (s)
T = temperature (K)
Vn = potential noise
VPDS = power spectral density of voltage noise
(V2
-Hz–1
)
W = Wagner number (–)
Z´(␻) = real component of impedance (Ω-cm2
)
Z´´(␻) = imaginary component of impedance (Ω-cm2
)
Z(␻) = complex impedance (Ω-cm2
)
|Z(␻)| = impedance modulus (Ω-cm2
)
␣a = symmetry factor for anodic reaction (–)
␣c = symmetry factor for anodic reaction (–)
␤a = anodic Tafel slope (V/decade)
␤c = cathodic Tafel slope (V/decade)
␪ = surface coverage of adsorbed intermediate
(–)
␾ = impedance phase angle (degrees)
␩ = overpotential (volts)
␴v = standard deviation of Vn – time record
␴I = standard deviation of current – time
record
␻ = frequency (rad-s-1
)
218 CORROSION–FEBRUARY 2000
CRITICAL REVIEW OF CORROSION SCIENCE AND ENGINEERING

More Related Content

What's hot

Electrochemical workstation.pptx
Electrochemical workstation.pptxElectrochemical workstation.pptx
Electrochemical workstation.pptxsapna kinattinkara
 
Electrochemical impedance spectroscopy
Electrochemical impedance spectroscopyElectrochemical impedance spectroscopy
Electrochemical impedance spectroscopyHalavath Ramesh
 
electrolyte for next generation batteries
electrolyte for next generation batterieselectrolyte for next generation batteries
electrolyte for next generation batteriesnikita garg
 
Basics of Electrochemical Impedance Spectroscopy
Basics of Electrochemical Impedance SpectroscopyBasics of Electrochemical Impedance Spectroscopy
Basics of Electrochemical Impedance SpectroscopyGamryInstruments
 
weldability study of nickel super alloys
weldability study of nickel super alloysweldability study of nickel super alloys
weldability study of nickel super alloysArchunan Ponnukhan
 
Anodic protection for corrosion prevention
Anodic protection for corrosion preventionAnodic protection for corrosion prevention
Anodic protection for corrosion preventionBapi Mondal
 
CVD AND PVD THIN FILM TECHNIQUES
CVD AND PVD THIN FILM TECHNIQUESCVD AND PVD THIN FILM TECHNIQUES
CVD AND PVD THIN FILM TECHNIQUESHHV SOLAR Pvt Ltd
 
Surface defects in crystals
Surface defects in crystalsSurface defects in crystals
Surface defects in crystalsARUN K S
 
Dispersion strengthening
Dispersion strengtheningDispersion strengthening
Dispersion strengtheningsanjeeviitbhu
 
Welding of copper alloys
Welding of copper alloysWelding of copper alloys
Welding of copper alloysJMB
 
Wis5 weldability n.ppt 1 11
Wis5 weldability n.ppt 1 11Wis5 weldability n.ppt 1 11
Wis5 weldability n.ppt 1 11Thang Do Minh
 

What's hot (20)

Electrochemical workstation.pptx
Electrochemical workstation.pptxElectrochemical workstation.pptx
Electrochemical workstation.pptx
 
Electrochemical impedance spectroscopy
Electrochemical impedance spectroscopyElectrochemical impedance spectroscopy
Electrochemical impedance spectroscopy
 
Corrosion
CorrosionCorrosion
Corrosion
 
electrolyte for next generation batteries
electrolyte for next generation batterieselectrolyte for next generation batteries
electrolyte for next generation batteries
 
Principles of corrosion
Principles of corrosionPrinciples of corrosion
Principles of corrosion
 
Basics of Electrochemical Impedance Spectroscopy
Basics of Electrochemical Impedance SpectroscopyBasics of Electrochemical Impedance Spectroscopy
Basics of Electrochemical Impedance Spectroscopy
 
weldability study of nickel super alloys
weldability study of nickel super alloysweldability study of nickel super alloys
weldability study of nickel super alloys
 
Anodic protection for corrosion prevention
Anodic protection for corrosion preventionAnodic protection for corrosion prevention
Anodic protection for corrosion prevention
 
CVD AND PVD THIN FILM TECHNIQUES
CVD AND PVD THIN FILM TECHNIQUESCVD AND PVD THIN FILM TECHNIQUES
CVD AND PVD THIN FILM TECHNIQUES
 
High Entropy alloys
High Entropy alloysHigh Entropy alloys
High Entropy alloys
 
Surface defects in crystals
Surface defects in crystalsSurface defects in crystals
Surface defects in crystals
 
Dispersion strengthening
Dispersion strengtheningDispersion strengthening
Dispersion strengthening
 
Welding of copper alloys
Welding of copper alloysWelding of copper alloys
Welding of copper alloys
 
Cathodic and anodic protection
Cathodic and anodic protectionCathodic and anodic protection
Cathodic and anodic protection
 
Cathodic protection
Cathodic protectionCathodic protection
Cathodic protection
 
High Entropy Alloys
High Entropy AlloysHigh Entropy Alloys
High Entropy Alloys
 
Fracture Mechanics & Failure Analysis Lecture Brittle Fracture
Fracture Mechanics & Failure Analysis Lecture Brittle Fracture  Fracture Mechanics & Failure Analysis Lecture Brittle Fracture
Fracture Mechanics & Failure Analysis Lecture Brittle Fracture
 
cooling curve
cooling curvecooling curve
cooling curve
 
Physical Vapour Deposition
Physical Vapour DepositionPhysical Vapour Deposition
Physical Vapour Deposition
 
Wis5 weldability n.ppt 1 11
Wis5 weldability n.ppt 1 11Wis5 weldability n.ppt 1 11
Wis5 weldability n.ppt 1 11
 

Viewers also liked

An open source intelligent auto wakeup solar energy harvesting system for sup...
An open source intelligent auto wakeup solar energy harvesting system for sup...An open source intelligent auto wakeup solar energy harvesting system for sup...
An open source intelligent auto wakeup solar energy harvesting system for sup...LeMeniz Infotech
 
Dissertation Report submission copy for CD
Dissertation Report submission copy for CDDissertation Report submission copy for CD
Dissertation Report submission copy for CDLakshmeesha Kodla
 
Literature review of recent best practices of downhole corrosion system , mod...
Literature review of recent best practices of downhole corrosion system , mod...Literature review of recent best practices of downhole corrosion system , mod...
Literature review of recent best practices of downhole corrosion system , mod...Muzammal Arif
 
Corrosion engineering
Corrosion engineeringCorrosion engineering
Corrosion engineeringArif Raihan
 
Rock and roll history upload for facebook
Rock and roll history upload for facebookRock and roll history upload for facebook
Rock and roll history upload for facebookLaura Thompson
 
Socioeconomic Correlations to Maternal Stress Research (Complete)
Socioeconomic Correlations to Maternal Stress Research (Complete)Socioeconomic Correlations to Maternal Stress Research (Complete)
Socioeconomic Correlations to Maternal Stress Research (Complete)Brianna G. Scott
 
Wearable [REDACTED]
Wearable [REDACTED]Wearable [REDACTED]
Wearable [REDACTED]Dean Johnson
 
Enfermedades neurodegenerativas. neuroalianza.
Enfermedades neurodegenerativas. neuroalianza.Enfermedades neurodegenerativas. neuroalianza.
Enfermedades neurodegenerativas. neuroalianza.José María
 
戴紅玫瑰的醜女人
戴紅玫瑰的醜女人戴紅玫瑰的醜女人
戴紅玫瑰的醜女人He Yan
 
Rock and roll history upload for facebook
Rock and roll history upload for facebookRock and roll history upload for facebook
Rock and roll history upload for facebookLaura Thompson
 

Viewers also liked (19)

corrosion presentation
corrosion presentationcorrosion presentation
corrosion presentation
 
Prevention of corrosion
Prevention of corrosionPrevention of corrosion
Prevention of corrosion
 
An open source intelligent auto wakeup solar energy harvesting system for sup...
An open source intelligent auto wakeup solar energy harvesting system for sup...An open source intelligent auto wakeup solar energy harvesting system for sup...
An open source intelligent auto wakeup solar energy harvesting system for sup...
 
Dissertation Report submission copy for CD
Dissertation Report submission copy for CDDissertation Report submission copy for CD
Dissertation Report submission copy for CD
 
Literature review of recent best practices of downhole corrosion system , mod...
Literature review of recent best practices of downhole corrosion system , mod...Literature review of recent best practices of downhole corrosion system , mod...
Literature review of recent best practices of downhole corrosion system , mod...
 
Galvanic corrosion
Galvanic corrosionGalvanic corrosion
Galvanic corrosion
 
Materials & corrosion
Materials & corrosion Materials & corrosion
Materials & corrosion
 
Corrosion engineering
Corrosion engineeringCorrosion engineering
Corrosion engineering
 
Tc108 botter pieter bos
Tc108 botter pieter bosTc108 botter pieter bos
Tc108 botter pieter bos
 
Rock and roll history upload for facebook
Rock and roll history upload for facebookRock and roll history upload for facebook
Rock and roll history upload for facebook
 
Nanomaterials
NanomaterialsNanomaterials
Nanomaterials
 
Rock and roll history
Rock and roll historyRock and roll history
Rock and roll history
 
Socioeconomic Correlations to Maternal Stress Research (Complete)
Socioeconomic Correlations to Maternal Stress Research (Complete)Socioeconomic Correlations to Maternal Stress Research (Complete)
Socioeconomic Correlations to Maternal Stress Research (Complete)
 
Wearable [REDACTED]
Wearable [REDACTED]Wearable [REDACTED]
Wearable [REDACTED]
 
Enfermedades neurodegenerativas. neuroalianza.
Enfermedades neurodegenerativas. neuroalianza.Enfermedades neurodegenerativas. neuroalianza.
Enfermedades neurodegenerativas. neuroalianza.
 
戴紅玫瑰的醜女人
戴紅玫瑰的醜女人戴紅玫瑰的醜女人
戴紅玫瑰的醜女人
 
Rock and roll history upload for facebook
Rock and roll history upload for facebookRock and roll history upload for facebook
Rock and roll history upload for facebook
 
Start reddit
Start redditStart reddit
Start reddit
 
Electrochemical polarization
Electrochemical polarizationElectrochemical polarization
Electrochemical polarization
 

Similar to Polarization resistance method

Cyclic Voltammetry: Principle, Instrumentation & Applications
Cyclic Voltammetry: Principle, Instrumentation & ApplicationsCyclic Voltammetry: Principle, Instrumentation & Applications
Cyclic Voltammetry: Principle, Instrumentation & ApplicationsAnu Radha
 
electrochemical studies on lead acid batteries
electrochemical studies on lead acid batterieselectrochemical studies on lead acid batteries
electrochemical studies on lead acid batteriesnhumaira374
 
Interaction of the secondary arc
Interaction of the secondary arcInteraction of the secondary arc
Interaction of the secondary arcUNAC
 
Exploration Geophysics III semester.pdf
Exploration Geophysics III semester.pdfExploration Geophysics III semester.pdf
Exploration Geophysics III semester.pdfSHAHEENAKBAR3
 
Experimental Study of an Atmospheric Pressure Dielectric Barrier Discharge an...
Experimental Study of an Atmospheric Pressure Dielectric Barrier Discharge an...Experimental Study of an Atmospheric Pressure Dielectric Barrier Discharge an...
Experimental Study of an Atmospheric Pressure Dielectric Barrier Discharge an...IJERA Editor
 
10.1016-j.mssp.2014.10.034-Graphene nanosheets as electrode materials for sup...
10.1016-j.mssp.2014.10.034-Graphene nanosheets as electrode materials for sup...10.1016-j.mssp.2014.10.034-Graphene nanosheets as electrode materials for sup...
10.1016-j.mssp.2014.10.034-Graphene nanosheets as electrode materials for sup...Mahdi Robat Sarpoushi
 
Cyclic voltammetry
Cyclic voltammetryCyclic voltammetry
Cyclic voltammetryAfrin Nirfa
 
BoltzTrap webinar116_David_J_Singh.pdf
BoltzTrap webinar116_David_J_Singh.pdfBoltzTrap webinar116_David_J_Singh.pdf
BoltzTrap webinar116_David_J_Singh.pdfDrSanjaySingh13
 

Similar to Polarization resistance method (20)

Cyclic Voltammetry: Principle, Instrumentation & Applications
Cyclic Voltammetry: Principle, Instrumentation & ApplicationsCyclic Voltammetry: Principle, Instrumentation & Applications
Cyclic Voltammetry: Principle, Instrumentation & Applications
 
nl503747h
nl503747hnl503747h
nl503747h
 
electrochemical studies on lead acid batteries
electrochemical studies on lead acid batterieselectrochemical studies on lead acid batteries
electrochemical studies on lead acid batteries
 
Interaction of the secondary arc
Interaction of the secondary arcInteraction of the secondary arc
Interaction of the secondary arc
 
Exploration Geophysics III semester.pdf
Exploration Geophysics III semester.pdfExploration Geophysics III semester.pdf
Exploration Geophysics III semester.pdf
 
Electrical method
Electrical methodElectrical method
Electrical method
 
Ik3314371440
Ik3314371440Ik3314371440
Ik3314371440
 
2 cp y ca
2   cp y ca2   cp y ca
2 cp y ca
 
Experimental Study of an Atmospheric Pressure Dielectric Barrier Discharge an...
Experimental Study of an Atmospheric Pressure Dielectric Barrier Discharge an...Experimental Study of an Atmospheric Pressure Dielectric Barrier Discharge an...
Experimental Study of an Atmospheric Pressure Dielectric Barrier Discharge an...
 
Experimental Study of an Atmospheric Pressure Dielectric Barrier Discharge an...
Experimental Study of an Atmospheric Pressure Dielectric Barrier Discharge an...Experimental Study of an Atmospheric Pressure Dielectric Barrier Discharge an...
Experimental Study of an Atmospheric Pressure Dielectric Barrier Discharge an...
 
Im3314481452
Im3314481452Im3314481452
Im3314481452
 
10.1016-j.mssp.2014.10.034-Graphene nanosheets as electrode materials for sup...
10.1016-j.mssp.2014.10.034-Graphene nanosheets as electrode materials for sup...10.1016-j.mssp.2014.10.034-Graphene nanosheets as electrode materials for sup...
10.1016-j.mssp.2014.10.034-Graphene nanosheets as electrode materials for sup...
 
Ferro2016
Ferro2016Ferro2016
Ferro2016
 
Cyclic voltammetry
Cyclic voltammetryCyclic voltammetry
Cyclic voltammetry
 
Supporting electrolyte
Supporting electrolyteSupporting electrolyte
Supporting electrolyte
 
BoltzTrap webinar116_David_J_Singh.pdf
BoltzTrap webinar116_David_J_Singh.pdfBoltzTrap webinar116_David_J_Singh.pdf
BoltzTrap webinar116_David_J_Singh.pdf
 
W4409126130
W4409126130W4409126130
W4409126130
 
Corrosion Report
Corrosion ReportCorrosion Report
Corrosion Report
 
1-s2.0-S1369800114002303-main
1-s2.0-S1369800114002303-main1-s2.0-S1369800114002303-main
1-s2.0-S1369800114002303-main
 
Eg35750753
Eg35750753Eg35750753
Eg35750753
 

Recently uploaded

G9 Science Q4- Week 1-2 Projectile Motion.ppt
G9 Science Q4- Week 1-2 Projectile Motion.pptG9 Science Q4- Week 1-2 Projectile Motion.ppt
G9 Science Q4- Week 1-2 Projectile Motion.pptMAESTRELLAMesa2
 
Animal Communication- Auditory and Visual.pptx
Animal Communication- Auditory and Visual.pptxAnimal Communication- Auditory and Visual.pptx
Animal Communication- Auditory and Visual.pptxUmerFayaz5
 
Discovery of an Accretion Streamer and a Slow Wide-angle Outflow around FUOri...
Discovery of an Accretion Streamer and a Slow Wide-angle Outflow around FUOri...Discovery of an Accretion Streamer and a Slow Wide-angle Outflow around FUOri...
Discovery of an Accretion Streamer and a Slow Wide-angle Outflow around FUOri...Sérgio Sacani
 
Natural Polymer Based Nanomaterials
Natural Polymer Based NanomaterialsNatural Polymer Based Nanomaterials
Natural Polymer Based NanomaterialsAArockiyaNisha
 
GFP in rDNA Technology (Biotechnology).pptx
GFP in rDNA Technology (Biotechnology).pptxGFP in rDNA Technology (Biotechnology).pptx
GFP in rDNA Technology (Biotechnology).pptxAleenaTreesaSaji
 
A relative description on Sonoporation.pdf
A relative description on Sonoporation.pdfA relative description on Sonoporation.pdf
A relative description on Sonoporation.pdfnehabiju2046
 
Labelling Requirements and Label Claims for Dietary Supplements and Recommend...
Labelling Requirements and Label Claims for Dietary Supplements and Recommend...Labelling Requirements and Label Claims for Dietary Supplements and Recommend...
Labelling Requirements and Label Claims for Dietary Supplements and Recommend...Lokesh Kothari
 
VIRUSES structure and classification ppt by Dr.Prince C P
VIRUSES structure and classification ppt by Dr.Prince C PVIRUSES structure and classification ppt by Dr.Prince C P
VIRUSES structure and classification ppt by Dr.Prince C PPRINCE C P
 
Scheme-of-Work-Science-Stage-4 cambridge science.docx
Scheme-of-Work-Science-Stage-4 cambridge science.docxScheme-of-Work-Science-Stage-4 cambridge science.docx
Scheme-of-Work-Science-Stage-4 cambridge science.docxyaramohamed343013
 
Disentangling the origin of chemical differences using GHOST
Disentangling the origin of chemical differences using GHOSTDisentangling the origin of chemical differences using GHOST
Disentangling the origin of chemical differences using GHOSTSérgio Sacani
 
Bentham & Hooker's Classification. along with the merits and demerits of the ...
Bentham & Hooker's Classification. along with the merits and demerits of the ...Bentham & Hooker's Classification. along with the merits and demerits of the ...
Bentham & Hooker's Classification. along with the merits and demerits of the ...Nistarini College, Purulia (W.B) India
 
Call Us ≽ 9953322196 ≼ Call Girls In Mukherjee Nagar(Delhi) |
Call Us ≽ 9953322196 ≼ Call Girls In Mukherjee Nagar(Delhi) |Call Us ≽ 9953322196 ≼ Call Girls In Mukherjee Nagar(Delhi) |
Call Us ≽ 9953322196 ≼ Call Girls In Mukherjee Nagar(Delhi) |aasikanpl
 
STERILITY TESTING OF PHARMACEUTICALS ppt by DR.C.P.PRINCE
STERILITY TESTING OF PHARMACEUTICALS ppt by DR.C.P.PRINCESTERILITY TESTING OF PHARMACEUTICALS ppt by DR.C.P.PRINCE
STERILITY TESTING OF PHARMACEUTICALS ppt by DR.C.P.PRINCEPRINCE C P
 
NAVSEA PEO USC - Unmanned & Small Combatants 26Oct23.pdf
NAVSEA PEO USC - Unmanned & Small Combatants 26Oct23.pdfNAVSEA PEO USC - Unmanned & Small Combatants 26Oct23.pdf
NAVSEA PEO USC - Unmanned & Small Combatants 26Oct23.pdfWadeK3
 
Hubble Asteroid Hunter III. Physical properties of newly found asteroids
Hubble Asteroid Hunter III. Physical properties of newly found asteroidsHubble Asteroid Hunter III. Physical properties of newly found asteroids
Hubble Asteroid Hunter III. Physical properties of newly found asteroidsSérgio Sacani
 
Luciferase in rDNA technology (biotechnology).pptx
Luciferase in rDNA technology (biotechnology).pptxLuciferase in rDNA technology (biotechnology).pptx
Luciferase in rDNA technology (biotechnology).pptxAleenaTreesaSaji
 
Biopesticide (2).pptx .This slides helps to know the different types of biop...
Biopesticide (2).pptx  .This slides helps to know the different types of biop...Biopesticide (2).pptx  .This slides helps to know the different types of biop...
Biopesticide (2).pptx .This slides helps to know the different types of biop...RohitNehra6
 
SOLUBLE PATTERN RECOGNITION RECEPTORS.pptx
SOLUBLE PATTERN RECOGNITION RECEPTORS.pptxSOLUBLE PATTERN RECOGNITION RECEPTORS.pptx
SOLUBLE PATTERN RECOGNITION RECEPTORS.pptxkessiyaTpeter
 
Work, Energy and Power for class 10 ICSE Physics
Work, Energy and Power for class 10 ICSE PhysicsWork, Energy and Power for class 10 ICSE Physics
Work, Energy and Power for class 10 ICSE Physicsvishikhakeshava1
 

Recently uploaded (20)

G9 Science Q4- Week 1-2 Projectile Motion.ppt
G9 Science Q4- Week 1-2 Projectile Motion.pptG9 Science Q4- Week 1-2 Projectile Motion.ppt
G9 Science Q4- Week 1-2 Projectile Motion.ppt
 
Animal Communication- Auditory and Visual.pptx
Animal Communication- Auditory and Visual.pptxAnimal Communication- Auditory and Visual.pptx
Animal Communication- Auditory and Visual.pptx
 
Discovery of an Accretion Streamer and a Slow Wide-angle Outflow around FUOri...
Discovery of an Accretion Streamer and a Slow Wide-angle Outflow around FUOri...Discovery of an Accretion Streamer and a Slow Wide-angle Outflow around FUOri...
Discovery of an Accretion Streamer and a Slow Wide-angle Outflow around FUOri...
 
Natural Polymer Based Nanomaterials
Natural Polymer Based NanomaterialsNatural Polymer Based Nanomaterials
Natural Polymer Based Nanomaterials
 
GFP in rDNA Technology (Biotechnology).pptx
GFP in rDNA Technology (Biotechnology).pptxGFP in rDNA Technology (Biotechnology).pptx
GFP in rDNA Technology (Biotechnology).pptx
 
A relative description on Sonoporation.pdf
A relative description on Sonoporation.pdfA relative description on Sonoporation.pdf
A relative description on Sonoporation.pdf
 
Labelling Requirements and Label Claims for Dietary Supplements and Recommend...
Labelling Requirements and Label Claims for Dietary Supplements and Recommend...Labelling Requirements and Label Claims for Dietary Supplements and Recommend...
Labelling Requirements and Label Claims for Dietary Supplements and Recommend...
 
9953056974 Young Call Girls In Mahavir enclave Indian Quality Escort service
9953056974 Young Call Girls In Mahavir enclave Indian Quality Escort service9953056974 Young Call Girls In Mahavir enclave Indian Quality Escort service
9953056974 Young Call Girls In Mahavir enclave Indian Quality Escort service
 
VIRUSES structure and classification ppt by Dr.Prince C P
VIRUSES structure and classification ppt by Dr.Prince C PVIRUSES structure and classification ppt by Dr.Prince C P
VIRUSES structure and classification ppt by Dr.Prince C P
 
Scheme-of-Work-Science-Stage-4 cambridge science.docx
Scheme-of-Work-Science-Stage-4 cambridge science.docxScheme-of-Work-Science-Stage-4 cambridge science.docx
Scheme-of-Work-Science-Stage-4 cambridge science.docx
 
Disentangling the origin of chemical differences using GHOST
Disentangling the origin of chemical differences using GHOSTDisentangling the origin of chemical differences using GHOST
Disentangling the origin of chemical differences using GHOST
 
Bentham & Hooker's Classification. along with the merits and demerits of the ...
Bentham & Hooker's Classification. along with the merits and demerits of the ...Bentham & Hooker's Classification. along with the merits and demerits of the ...
Bentham & Hooker's Classification. along with the merits and demerits of the ...
 
Call Us ≽ 9953322196 ≼ Call Girls In Mukherjee Nagar(Delhi) |
Call Us ≽ 9953322196 ≼ Call Girls In Mukherjee Nagar(Delhi) |Call Us ≽ 9953322196 ≼ Call Girls In Mukherjee Nagar(Delhi) |
Call Us ≽ 9953322196 ≼ Call Girls In Mukherjee Nagar(Delhi) |
 
STERILITY TESTING OF PHARMACEUTICALS ppt by DR.C.P.PRINCE
STERILITY TESTING OF PHARMACEUTICALS ppt by DR.C.P.PRINCESTERILITY TESTING OF PHARMACEUTICALS ppt by DR.C.P.PRINCE
STERILITY TESTING OF PHARMACEUTICALS ppt by DR.C.P.PRINCE
 
NAVSEA PEO USC - Unmanned & Small Combatants 26Oct23.pdf
NAVSEA PEO USC - Unmanned & Small Combatants 26Oct23.pdfNAVSEA PEO USC - Unmanned & Small Combatants 26Oct23.pdf
NAVSEA PEO USC - Unmanned & Small Combatants 26Oct23.pdf
 
Hubble Asteroid Hunter III. Physical properties of newly found asteroids
Hubble Asteroid Hunter III. Physical properties of newly found asteroidsHubble Asteroid Hunter III. Physical properties of newly found asteroids
Hubble Asteroid Hunter III. Physical properties of newly found asteroids
 
Luciferase in rDNA technology (biotechnology).pptx
Luciferase in rDNA technology (biotechnology).pptxLuciferase in rDNA technology (biotechnology).pptx
Luciferase in rDNA technology (biotechnology).pptx
 
Biopesticide (2).pptx .This slides helps to know the different types of biop...
Biopesticide (2).pptx  .This slides helps to know the different types of biop...Biopesticide (2).pptx  .This slides helps to know the different types of biop...
Biopesticide (2).pptx .This slides helps to know the different types of biop...
 
SOLUBLE PATTERN RECOGNITION RECEPTORS.pptx
SOLUBLE PATTERN RECOGNITION RECEPTORS.pptxSOLUBLE PATTERN RECOGNITION RECEPTORS.pptx
SOLUBLE PATTERN RECOGNITION RECEPTORS.pptx
 
Work, Energy and Power for class 10 ICSE Physics
Work, Energy and Power for class 10 ICSE PhysicsWork, Energy and Power for class 10 ICSE Physics
Work, Energy and Power for class 10 ICSE Physics
 

Polarization resistance method

  • 1. CORROSION–Vol. 56, No. 2 199 CRITICAL REVIEW OF CORROSION SCIENCE AND ENGINEERING 0010-9312/00/000039/$5.00+$0.50/0 © 2000, NACE International Submitted for publication February 1998. Presented as paper no. 304 at CORROSION/98, March 1998, San Diego, CA. * Center for Electrochemical Sciences and Engineering, Department of Materials Science and Engineering, Thornton Hall, University of Virginia, Charlottesville, VA 22903-2442. Polarization Resistance Method for Determination of Instantaneous Corrosion Rates J.R. Scully* ABSTRACT The polarization resistance method for the determination of instantaneous corrosion rates of metals were reviewed. The assumptions in electrode kinetics that govern the connection between the slope of steady-state applied electrochemical potential-applied current density (Eapp-iapp) measurements (i.e., the polarization resistance) and the corrosion rate were restated. Electrochemical impedance, as well as statistical and spectral electrochemical noise methods for obtaining polarization resistance, also were discussed. Traditional sources of error such as high excitation voltage amplitudes, insufficiently slow voltage ramp rates, high alternating cur- rent (AC) frequencies, inadequate polarization hold periods, high solution resistance, presence of parallel reduction- oxidation reactions, and nonuniform current and potential distributions were examined with the goal of defining some of the conditions and circumstances where these complicat- ing factors are important. Other complicating factors such as diffusion-controlled reactions, potential-dependent film cover- ages, and adsorption pseudo-capacitance that affect electrochemical reaction rates were discussed. Their influ- ence on measured interfacial resistance values and subsequent determination of corrosion rates was discussed. KEY WORDS: current-step method, impedance method, instantaneous corrosion rate, linear polarization resistance, noise resistance, polarization resistance, potential-step method, potentiodynamic method, power spectral density, solution resistance, spectral noise resistance INTRODUCTION A variety of methods such as electrical resistance, gravimetric-based mass loss, quartz crystal microbal- ance-based mass loss, electrochemical, and solution analysis methods enable the determination of corro- sion rates of metals. The polarization resistance method, based on electrochemical concepts, enables determination of instantaneous interfacial reaction rates such as corrosion rates and exchange current densities from a single experiment. There are a vari- ety of methods capable of experimentally determining instantaneous polarization resistances such as potential step or sweep, current step or sweep, impedance spectroscopy, as well as statistical and spectral noise methods. All of these methods utilize either two-, three-, or four-electrode electrochemical cells. Instantaneous corrosion rate information can be obtained from such relatively rapid electrochemi- cal measurements in short time periods. Other methods such as the electrical resistance change of the solid electronic conducting phase, gravimetric and quartz crystal microbalance measurements of mass loss, and solution analysis to detect metallic cations released into the ionic conducting phase all provide historical or integrated information on the in- stantaneous corrosion rates that have occurred over some period of time. Therefore, the derivative of mul- tiple measurements over exposure time must be used to obtain rate information. Therefore, instantaneous rates can not be determined by a single measure- ment of these types and electrochemical methods, for instantaneous rate determination remain extremely
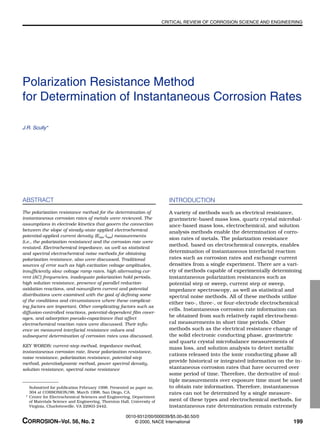
  • 2. 200 CORROSION–FEBRUARY 2000 CRITICAL REVIEW OF CORROSION SCIENCE AND ENGINEERING (1) This review focuses on corroding systems. However, the concept of polarization resistance applies equally well to reduction- oxidation systems. Here, the exchange current density (io) may be calculated from the Rp, as defined below, where R is the ideal gas constant, T is the temperature, and ␣a and ␣c are the anodic and cathodic multi-step electron transfer coefficients, respectively, for the reduction-oxidation process. Rp Ω–cm2 = ∆E ∆i E – Erev →0 = RT io αa + αc attractive. However, numerous issues can make the task of extracting a polarization resistance value (that is inversely proportional to the instantaneous corrosion rate) from electrochemical data a complex one whether the experiment is conducted in the fre- quency or time domains. The goal of the present study was to review some of these issues. Governing Electrode Kinetics in Corrosion Processes The following relationship is observed experi- mentally between applied electrochemical current density and potential for a corroding electrode in the absence of parallel reduction-oxidation reactions.1-2 The applicability of this simple relationship relies on the presence of a single charge-transfer-controlled cathodic reaction and a single charge-transfer- controlled anodic reaction: iapp = icorr exp 2.3 E – Ecorr βa – exp 2.3 E – Ecorr βc (1) where ␤a and ␤c are the anodic and cathodic Tafel parameters given by the slopes of the polarization curves (∂E/∂logiapp) in the anodic and cathodic Tafel regimes, respectively. E-log(iapp) data that is governed by such kinetics are shown in Figure 1. Ecorr is the corrosion potential. E is an applied potential such that E-Ecorr is ∆E, and icorr is the corrosion current density. This relationship provides the basis for the electrochemical polarization technique as applied to a corroding electrode at its corrosion potential. Derivation of the Polarization Resistance Many investigators have experimentally observed that iapp is approximately linearly related to applied potential within a few millivolts of polarization from Ecorr.3 Stern and Geary simplified the kinetic expres- sion to provide an approximation to the charge- transfer-controlled reaction kinetics given by Equation (1) for the case of small overpotentials with respect to Ecorr.4-6 Equation (1) can be linearized mathematically by taking its series expansion (e.g., ex = 1 + x + x2 /2! + x3 /3! + x4 /4!..) and by neglecting higher terms when ∆E/b < 0.1. This simplified rela- tionship has the following form: Rp Ω–cm2 = ∆E ∆iapp E – Ecorr →0 = βaβc 2.3icorr βa + βc (2) rearranging: icorr = 1 2.3Rp βaβc βa + βc = B Rp (3) where Rp is the polarization resistance given by (∂E/∂iapp)at t=∞, ∆E=0 (Ω-cm2 ), and B is a proportionality constant. Since charge transfer is assumed in Equation (3), Rp is equal to a charge-transfer resis- tance (Rct). The units for Rp are ohms as obtained from E-Iapp data (where Iapp is the applied current) when the applied current is not normalized by elec- trode area. Such data must be multiplied by electrode area to yield Rp (Ω-cm2 ). If electrode area is doubled, then the measured Rp value in ohms is halved, but the intrinsic polarization resistance value Rp (Ω-cm2 ) would be the same since the electrode area is doubled. This gives the result that corrosion rate per unit area is independent of electrode area. However, the working electrode area must be known to calculate corrosion rate. The B factor is dominated by the smaller of the two anodic and cathodic Tafel slopes (ba, bc), if un- equal. Therefore, cathodic mass transport control, such that bcÆ∞, results in B = ba/2.3. Similarly, anodic mass transport control results in B = bc/2.3.7 FIGURE 1. E-log (iapp) data for hypothetical corroding interfaces with RP = 100 Ω-cm2 and 10,000 Ω-cm2 (assumed 1-cm2 A) and ␤a = ␤c = 60 mV/decade. The two cases produced corrosion current densities, icorr, of 130.4 µA/cm2 and 1.3 µA/cm2 , respectively. The Tafel slopes were obtained from ∂E/∂log (iapp) data at high overpotential where E-log (iapp) is linear. The OCP was arbitrarily selected to be 0 mV.
  • 3. CORROSION–Vol. 56, No. 2 201 CRITICAL REVIEW OF CORROSION SCIENCE AND ENGINEERING Knowledge of Rp, ba, and bc enables direct determina- tion of the corrosion rate at any instant in time using Equation (3).4-9 iapp often is approximately linear with potential within ± 5 mV to 10 mV of Ecorr (Figure 2). The slope of this plot is ∆E/∆iapp. When determined from a tangent to the E-iapp curve at Ecorr, as shown in Figures 2(a) and (b), it defines the polarization resis- tance. Consequently, this method often is called the linear polarization method (LPR). The slope at Ecorr is independent of the degree of linearity,3 although the extent of the approximately linear E-iapp region can vary considerably among corroding systems. The fact that the corrosion rate is inversely pro- portional to the Rp is seen clearly in Equation (3). Taking the logarithm of this equation, it is seen that log icorr vs log Rp is linear with a slope of –1 and has the intercept log B:3 log Rp = log B – log icorr (4) Stern and Wiesert confirmed such a relationship over a nearly 6 orders-of-magnitude change in corrosion current density for many corroding systems and for exchange current density for many reduction- oxidation systems.8,(1) Time Domain Methods for Determining Polarization Resistance ASTM standards D-27769 and G-5910 describe standard procedures for conducting polarization re- sistance measurements. Potentiodynamic,11 potential step, and current-step methods12-13 all have been described to determine the linear E-iapp behavior of an electrode near Ecorr. Regardless of the method utilized, independent determination of ␤a and ␤c still is required. Alternative techniques exploit nonlinearity at larger overpotentials. Nonlinearity invalidates Equation (3). However, the nonlinearity, if treated properly, can enable determination of ␤a and ␤c with- out excessive polarization. The Oldham-Mansfeld method calculates icorr from nonlinear E vs iapp data obtained within ± 30 mV of Ecorr, without the need for high overpotential determination of ␤a and ␤c.14 Com- puterized curve fitting can exploit nonlinearity to calculate ␤a and ␤c from low-overpotential data, avoiding the destructive nature of large overpoten- tials.15 The Mansfeld technique substitutes Equation (3) into Equation (1) eliminating icorr.15 ␤a and ␤c are determined from the best fit of the resulting expres- sion containing ␤a and ␤c as unknowns to a nonlinear plot of ⌬E vs 2.3iappRp. Rp is determined in the usual way from the slope of a linear tangent to the E vs iapp data at Ecorr. icorr is determined subsequently from Equation (3) for known values of Rp, ␤a, and ␤c. In this technique, elimination of icorr enables determina- tion of only two unknowns by fitting. Advancements in computerization enable a direct fit of E-iapp data to Equation (1), but this requires simultaneous determi- nation of three unknowns. Consequently, extremely high-quality E-log(iapp) data that is corrected for ohmic voltage error and does not contain other sources of overpotential (i.e., mass transport overpotentials) are required. Electrochemical Impedance Methods for Determination of Polarization Resistance Some of the complications and sources of error associated with the polarization resistance method, such as a high solution resistance and fast scan rate, are explained more readily after introducing electrical equivalent circuit parameters to represent and simu- late the corroding electrochemical interface.1,16-20 The impedance method is a straightforward approach for (a) (b) FIGURE 2. E-iapp data according to Equation (1) for hypothetical corrodinginterfaceswithRP =100,1,000,and10,000Ω-cm2 (assumed 1-cm2 A) and ␤a = ␤c = 60 mV/decade. The three cases produced corrosion current densities of 130.4, 13.0, and 1.3 µA/cm2 , respectively. Plots a and b of the same data provide different current scales to indicate the extent of nonlinearity in each case.
  • 4. 202 CORROSION–FEBRUARY 2000 CRITICAL REVIEW OF CORROSION SCIENCE AND ENGINEERING analyzing such electrical circuits and extracting the values of the circuit parameters. The simplest form of such a model pertinent to a corroding interface is shown in Figure 3(a). The three circuit parameters (Rp, solution resistance [Rs], and double-layer capacitance [Cdl]) that approximate a corroding electrochemical interface are shown. Cdl arises when- ever an electrochemical interface exists between electronic and ionic phases. The circuit models de- scribed in Figures 3(b) and (c) describe cases where diffusional impedances and adsorption pseudo- capacitances occur, respectively. ASTM standard G 106 provides a standard prac- tice for verification of algorithm and equipment for electrochemical impedance measurements.20 The standard also contains an appendix reviewing the technique. The electrochemical impedance method is conducted over a range of alternating current (AC) frequencies. Typically, a small-amplitude sinusoidal potential perturbation is applied to the working elec- trode at a number of discrete frequencies (␻). At each one of these frequencies, the resulting current wave- form will exhibit a sinusoidal response that is out of phase with the applied potential signal by an amount depending upon the circuit parameters of the corrod- ing interface and will have a current amplitude that is inversely proportional to the impedance of inter- face. This electrochemical impedance (Z[␻]) is the frequency-dependent proportionality factor that acts as a transfer function by establishing a relationship between the excitation voltage signal and the current response of the electrochemical system: Z ω = E ω i ω (5) where E is the time varying voltage across the circuit, E = Eo sin(␻t); i is the time varying current density through the circuit, i = io sin (␻t+␾); Z(␻) is the impedance (Ω-cm2 ); and t is time (s). Z(␻) is a com- plex-valued vector quantity with real and imaginary components whose values are frequency dependent: Z ω = Z′ ω + jZ′′ ω (6) where Z´(␻) is the real component of impedance, where Z´(␻) = |Z(␻)|cos(␾); Z´´(␻) is the imaginary component of impedance, where Z´´(␻) = |Z(␻)|sin(␾); j2 is the square of the imaginary number, or –1; |Z(␻)| is the impedance magnitude or modulus, where |Z(␻)| = (Z´(␻)2 + Z´´(␻)2 )1/2 ; and the phase angle (␾) = tan–1 Z´´(␻)/Z´(␻). An example of an impedance Z(␻) vector with real and imaginary (capacitive) com- ponents is shown elsewhere.20 Z(v) is a fundamental characteristic of the elec- (a) (b) (c) FIGURE 3. Electrical equivalent circuit models commonly used to represent an electrochemical interface undergoing corrosion. RP, Cdl, C ␾, Rct, and RF are all potential dependent. (a) Randles-type circuit where RP = Rct when there are no mass transport limitations; electrochemical reactions involve no absorbed intermediates and instantaneous charge-transfer control prevails. (b) Electrical equivalent circuit for a corroding metal containing a diffusional impedance parameter representing presence of a finite diffusional impedance. RP = RD + Rct at the DC limit in the case of a finite mass transport limitation to the reaction rate. (c) Electrical equivalent circuit for a corroding metal containing an adsorption C␾ associated with an adsorbed intermediate. In the example, the charge-transfer reaction rate is inversely proportional to Rct for a transient period until the adsorbed intermediate coverage was formed. This situation is described by a resistor in series with a capacitor. Once the coverage is formed creating an interphase that slows the reaction, the overall reaction rate is given by Rp = Rct + RF at the DC limit.
  • 5. CORROSION–Vol. 56, No. 2 203 CRITICAL REVIEW OF CORROSION SCIENCE AND ENGINEERING trochemical system it describes. A knowledge of the frequency dependence of impedance for a corroding system enables a determination of an appropriate equivalent electrical circuit describing that system. Such a circuit typically is constructed from resistors and capacitors. Table 1 shows the transfer functions for resistors, capacitors, and inductors. The capaci- tor can be a Cdl or a Cdl and a pseudo-capacitance (Cf) associated with an adsorbed intermediate. Figure 3(a) illustrates a simple equivalent electrical circuit model commonly used to represent an actively corroding metal in an aqueous solution under charge-transfer control. The following expression describes the impedance for the simple circuit described in Figure 3(a): Z ω = Rs + Rp 1 + ω2 Rp 2 Cdl 2 _ jωCRp 2 1 + ω2 Rp 2 Cdl 2 (7) where ␻ = 2πf is the frequency of the applied signal (rad/s), f is the frequency of the applied signal (Hz), and Cdl is the interfacial capacitance (F/cm2 ). The complex plane, Bode magnitude, and phase plots resulting from a circuit such as shown in Figure 3(a) and described by Equation 7 are shown for three different values of Rp in Figure 4. At very low frequencies: Zω→0 ω = Rs + Rp (8) This is because the impedance associated with a ca- pacitor approaches infinity as frequency approaches zero, and parallel electrical circuit elements are dominated by the element with the smallest imped- ance. Therefore, the sum of Rs and Rp is measured at zero frequency; while at very high frequencies: Zω→∞ ω = Rs (9) Since the algebraic sum of Rs and Rp is measured when a direct current (DC) measurement is per- formed (e.g., zero AC frequency, long hold time during potential or current step, or slow scan rate approaching zero), the true corrosion rate will be underestimated by |Z(␻)| at the zero frequency limit when Rs is appreciable (Figure 5). However, Rp can be determined in media of high resistivity when Rp is separated mathematically from Rs by taking the dif- ference between Z(␻) obtained at low and high ␻ (Rp = |Z(␻→0) | – |Z(␻→∞)|). In other words, deter- mination of Rp can be achieved by subtracting the results of Equation (9) from the results of Equation (8). This is a particularly useful approach if Rs is nearly the same value as Rp (Figure 5 for Rs = 100 Ω). The need for this subtraction may result from either low conductivity environments or placement of the reference electrode far away from the working electrode; in either case, Rs may become large. Con- versely, any experiment conducted at too fast a voltage scan rate (short time or too high of an AC fre- quency) causes the algebraic sum of the ohmic resistance and the resultant frequency dependent parallel impedance of the parallel resistive-capacitive network to be measured. This value will be lower than the sum of Rp and Rs determined at an infinitely slow scan rate or frequency because current leaks through the parallel capacitive element at a higher scan rate because of its low impedance at high fre- quency. This usually will result in an overestimation of the true corrosion rate. These complications in scan rate or current-step hold time can be overcome, or at least detected more easily, by using the electro- chemical impedance method.1,16,20 Corrosion rate determination in Equation (3) still requires knowl- edge of ␤a and ␤c. TABLE 1 Linear Circuit Elements Commonly Used in Electrochemical Impedance Circuit Component Impedance Resistor (R) Z(␻) = R Capacitor (C) Z(␻) = –1/j␻C Inductor (L) Z(␻) = j␻L (a) (b) FIGURE 4. (a) Bode magnitude and (b) Bode phase angle plots for a hypothetical corroding interface using the electrical equivalent circuit model given by Figure 3(a) with RP = 10, 100, or 1,000 Ω, Cdl = 1,000 µF, and RS = 10 Ω.
  • 6. 204 CORROSION–FEBRUARY 2000 CRITICAL REVIEW OF CORROSION SCIENCE AND ENGINEERING Either the anodic or cathodic half-cell reaction can become mass-transport limited and restrict the rate of corrosion at Ecorr. The presence of diffusion- controlled corrosion processes does not invalid the electrochemical impedance spectroscopy (EIS) method but does require extra precaution and a modification to the circuit model of Figure 3(a). In this case, the finite diffusional impedance is added in series with the usual charge-transfer parallel resis- tance shown in Figure 3(b). The transfer function for the frequency dependent finite diffusional impedance (ZD) has been described by:21 ZD ω = RD tanh jωs jωs (10) Here, s = leff 2 /D, where leff is the actual finite diffusion length and D is the diffusion coefficient of the diffus- ing species that limits the interfacial reaction. The value of ZD(␻) approaches the real component of the diffusional impedance, RD, as ␻→0. The maximum frequency required to obtain RD depends upon the value of s. The larger the value of s, such as when Ieff is large or D is small, the lower the frequency required as illustrated in Figure 6. Rp, defined as [∆E/∆iapp] as ␻→0, is the sum of Rct and RD contribu- tions to the polarization resistance, assuming that RD + Rct >> Rs: Rp = Rct + RD (11) A very low frequency or scan rate may be required to obtain Rp defined by Equation (11) under certain circumstances (Figure 6). Here, a Ieff of 0.1 cm and D = 10–5 cm2 /s requires that a frequency < 0.1 mHz be implemented to obtain Rp from |Z(␻)| at the zero frequency limit. Hence, a common experimental problem for diffusion-controlled electrochemical reac- tions is that extremely low frequency (or scan rates) are required to complete the measurement of Rp. When Rp is defined by Equation (11), the Stern approximation of Equations (2) and (3) must be modified to account for the Tafel slope for the anodic or cathodic reactions under diffusion-controlled con- ditions (i.e., ␤→∞). In fact, Equation (1) becomes invalid. Moreover, it has been argued that the use of Rp in the Stern equation breaks down in the case of mixed or partial diffusion control. Another relevant situation to corrosion rate de- termination occurs when an adsorbed intermediate participates in the overall reaction process (Figure 3[c]).22 Here, Rct is a faradaic resistance proportional to a charge-transfer process that occurs instanta- neously given a certain adsorbed intermediate coverage. Rs and Cdl have their usual meanings. Cf is a new capacitance term that depends upon the change in the charge stored in the adsorbed interme- diate film resulting from a gradual change in the film coverage with potential.2 The adsorbed film has a charge associated with it in this case because it is formed by a charge-transfer process. Recall that the source of any fixed capacitance is a charge that is proportional to potential. Hence, the rate of change of surface charge is proportional to the rate of change in interfacial potential. The capacitance (C) is the proportionality factor that is independent of the rate of change in charge or potential assuming a fixed capacitance:2 C = dq dE = dt dE dqT dt (12) (a) (b) FIGURE 5. (a) Bode magnitude and (b) Bode phase angle plots for hypothetical corroding interfaces with RP = 100 Ω, C dl = 100 µF, and RS = 1, 10, or 100 Ω using the electrical equivalent circuit model of Figure 3(a).
  • 7. CORROSION–Vol. 56, No. 2 205 CRITICAL REVIEW OF CORROSION SCIENCE AND ENGINEERING In the case of a double-layer capacitance, Cdl = dqdl/ dE. For C␾ = dqF/dE. Here, qF is the charge to form the surface film of an adsorbed intermediate, for ex- ample. qF = qM␪, where ␪ describes the fractional surface coverage by the film (assumed to be one monolayer thick), and qM describes the charge required to form one monolayer: Cφ = dqF dE = qM dθ dE = qM dt dE dθ dt (13) Hence, C␾ differs from Cdl since the former involves charge transfer to create the change in surface charge. The latter involves a charge balance across an electrochemical interface brought about by rear- rangement of ions in solution in response to a change in excess charge in the metal.2 Therefore, Cdl requires no charge transfer. The adsorption C␾ ap- pears in the circuit model as a physically justified capacitance that behaves just like a capacitor should; it allows passage of an AC signal but pro- vides an infinite resistance to a DC signal. The physical significance of this, when placed in series with a resistor, is that it allows a transient current flow when the potential is shifted until the coverage reaches the equilibrium value defined by the new potential. If the reaction still proceeds at a new steady-state rate after the coverage has formed, this can be described by placing a second resistor in par- allel with C␾. In this example, the charge-transfer reaction rate and coverage are assumed to increase with potential, with increasing coverage acting against the overall reaction rate. In this case, the in- terphase acts as an added resistor such that |Z(␻)| at the zero frequency limit is equal to Rs + RF + Rct. Therefore, RF and Rct are both potential dependent, and RF + Rct yields Rp if Rs is minimal. As the fre- quency of an AC signal increases, the coverage can no longer change with potential, and C␾ approaches zero. Since the coverage is frozen, d␪/dE approaches zero and the interface can be represented by a sim- plified Randles’ circuit where Cdl is parallel to Rct. Rct is therefore a charge-transfer resistance inversely proportional to the charge-transfer reaction rate at zero or frozen coverage. Electrochemical Noise Resistance Electrochemical noise analysis can provide a pa- rameter called the electrochemical noise resistance (Rn).23-29 It is desirable to utilize this parameter in an analogous fashion as the polarization resistance. One electrode configuration that enables such a measure- ment involves connecting a zero resistance ammeter between two nominally identical corroding electrodes immersed in the same solution. A third, nominally identical electrode can be immersed in solution and connected to the first two using a high impedance voltmeter. This electrode serves as a “noisy” psuedo- reference electrode. This approach is attractive in field applications because of the more rugged nature of the metallic electrode compared to laboratory ref- erence electrodes but complicates the analysis because two uncorrelated potential sources (i.e., from the couple and the psuedo-reference) are measured in the collection of potential noise (Vn). Since Vn(meas) = (Vn(couple) + Vn(psuedo-ref))1/2 , Vn(meas) must be divided by √230 to yield Vn(couple). Another alternative is a four-elec- trode arrangement where the first pair is coupled through a zero resistance ammeter to monitor cur- rent and the second pair is connected with a high-impedance voltmeter to sample an uncorrelated Vn(couple). Alternatively, a less noisy, conventional refer- ence electrode may be utilized in the three-electrode arrangement. In this case, Vn(meas) and In(meas) are corre- lated, where In is the electrochemical current noise. (a) (b) FIGURE 6. (a) Bode magnitude and (b) Bode phase angle plots for hypothetical corroding interfaces with Rct = 100 Ω, RD = 1,000 Ω, Cdl = 100 µF, RS = 10 Ω, leff = 0.1 cm, and D = 10–5 , 10–6 , and 10–7 cm2 /s using the electrical equivalent circuit model of Figure 3(b).
  • 8. 206 CORROSION–FEBRUARY 2000 CRITICAL REVIEW OF CORROSION SCIENCE AND ENGINEERING The reference electrode noise can be defined sepa- rately as the electrochemical voltage noise between two nominally identical reference electrodes.31 If the reference electrode noise is low, then the √2 correc- tion factor is not needed. In either case, the third electrode (reference electrode) is connected to the first two via a high-impedance voltmeter. These ar- rangements enable simultaneous recording of the galvanic current with time and the galvanic couple potential versus time. The standard deviation of the voltage noise divided by the standard deviation of the current noise has been proposed to yield a statistical parameter called the noise resistance (Rn).23-30,32 Fur- ther analysis of simulated noise data has led to the conclusion that the ratio of the standard deviations of the current and voltage noises measured between two identical electrodes can be normalized by surface area by multiplying by √AvAi:29 Rn = σV(meas) σI(meas) AνAI (14) where ␴V(meas) is the standard deviation of the voltage noise, ␴I(meas) is the standard deviation of the current noise, and Av and AI are the surface areas of the elec- trodes used for voltage and current measurement, respectively. Correlations between this parameter and conventionally determined Rp and mass- loss-based corrosion rates have been obtained.24,30 Unfortunately, experimental confirmation of the area normalization factor has not been performed exten- sively. Recall that in the case of a Rp determined from E-iapp data or EIS data at the zero frequency limit, measured resistance can be multiplied by electrode area and will yield the same area normalized Rp over a broad range of electrode areas. Moreover, the correlation has lacked a rigorous fundamental foundation for correlating Rn with corro- sion rate, despite the intuitive connection between sV and sI given by the proportionality factor Rn. It is clear that the surface of one freely corroding elec- trode could be divided into areas that experience fluctuations in interfacial resistance that produce changes in anodic and cathodic half-cell reaction rates in any one patch. The electrode potential must change then in each patch to drive the half-cell reac- tions such that the sum of all the anodic half-cell currents from all patches equals the sum of all cathodic half-cell currents, regardless of whether the source of cathodic half-cell current is from capacitive discharge or electrochemical reaction.28 Some global change in potential also occurs on the electrode. If the first electrode is now connected to a second elec- trode whose interfacial properties and global electrode potential do not change on their own at the same instant in time and by the same degree as on the first electrode, then a galvanic cell is created momentarily, which induces a further difference in anodic and cathodic half-cell currents on the first electrode. Current now flows between the first and second electrodes such that the sum of anodic and cathodic half-cell currents over all patches on both electrodes is equal. When the interfacial resistances return to normal values over all patches, the potential difference between the two electrodes is eliminated and so is the measurable current between the two electrodes. Bertocci argued that the external current fluctuation measured between two identical electrodes is identical to the fluctuation in one elec- trode.28-29 Others have argued using concepts of mixed potential theory that, at worst, the current sampled is only one half of the total for equal-sized electrodes. Theoretical relationships establishing the con- nection between Rn and Rp have been sought by several researchers,29,33-36 but their validity has been questioned. A great concern has been that the largest current peaks would occur during the most rapid voltage fluctuations since the electrode interface con- tains a capacitance through which current can be shorted.28-29 Thus, when voltage fluctuations are rapid, the measured noise current will be shorted through the interfacial capacitance assuming a simple electrical equivalent circuit model consisting of a two-parallel resistor-capacitor network describ- ing the interface for each electrode connected in series through Rs. This situation would lead to the lowest impedance between the two electrodes during the most rapid voltage fluctuations that, in turn, produce the greatest current fluctuations. The theoretical maximum measured current would be given by the voltage fluctuation divided by Rs. The outcome would be a statistical Rn parameter that is proportional to, or heavily influenced by higher fre- quency data. Indeed, Rn is found to equal an absolute impedance at some frequency that depends on the frequency of the voltage fluctuations and the resis- tive-capacitive (RC) time constant of the electrode interface in one study of simulated noise.28 Unfortu- nately, a Rn value obtained at high frequency would be smaller in magnitude than the Rp obtained at the zero frequency limit. Hence, it would not represent the desired zero frequency limit interfacial resistance, Rp. Indeed, such underestimations in the true value of Rp have been observed experimentally.30,32 Recently, a more rigorous theoretical and experi- mental analysis has been made comparing the spectral noise resistance (Rsn[v]) obtained at each fre- quency with the Rp obtained from the zero frequency limit of impedance data |Z(v = 0)|, as well as the frequency dependent impedance of two electrodes.37-41 The spectral noise resistance (Rsn[v]) is determined by taking the square root of power spectral density of the voltage noise, VPSD, (V2 /Hz)1/2 and dividing it by the square root of power spectral density of the cur-
  • 9. CORROSION–Vol. 56, No. 2 207 CRITICAL REVIEW OF CORROSION SCIENCE AND ENGINEERING rent noise, IPSD, (A2 /Hz)1/2 at each frequency using the same two electrode arrangement as discussed above:40-41 Rsn ω = VPSD IPSD (15) Rsn(␻) is proportional to the magnitude of the cell impedance, |Z(␻)|, in the two-electrode arrange- ment.40-41 The proportionality factor is unity in the case of identically sized electrodes in a two-electrode cell with identical impedances and a noiseless refer- ence electrode.40-41 Therefore, the Rsn(␻) at the zero frequency limit could equal the interfacial impedance at the zero frequency limit |Z(␻ = 0)| in the theoreti- cal case of identical electrode impedances with negligible Rs. Figure 7 illustrates data for identical iron electrodes in 1 M sodium sulfate (Na2SO4) with an iron reference electrode. Here, Rsn(␻) = √3 |Z(␻)| resulting from the noisy reference electrode (RE). Thus, 2 |Z(␻)| and Rsn(␻) appear to be similar. It is well known that in many instances |Z(␻ = 0)| equals Rp. Even Rn may equal Rsn(␻ = 0) = |Z(␻ = 0)| = Rp if |Z(␻)| equals Rp in the frequency regime dominating the Rn value. The frequency range dominating the Rn value is determined by several factors, but this state- ment is more likely to be true if |Z(␻)| and Rsn(␻) exhibit long low-frequency plateaus over a broad frequency range that encompasses the fmin and fs utilized in the Rn measurement. Here, fmin is given by the total sampling time (T), where fmin = 1/T and fs equals the data sampling rate. Rn typically varies with fs and underestimates |Z(␻ = 0)|. Unfortunately, Rsn(␻→0) does not equal Rp in the zero frequency limit under many other conditions, such as when log (Rs/Rp ) > 0 or in the case of very noisy reference elec- trodes.40-41 Moreover, Rsn(␻) can be dominated by the properties of the high-impedance electrode in the case of dissimilar electrode impedances that are equally noisy, but this is not always the case. For instance, the low-impedance electrode in a two- electrode cell with a third reference electrode can be sensed by Rsn(␻) if the higher impedance electrode is much noisier than the low-impedance electrode.40-41 Recent attempts have been made to address circum- stances where Rsn(␻) lies between |Z(␻)|1 and |Z(␻)|2 representing the impedance values of the high- and low-impedance electrodes. Methods have been suggested for sensing the current fluctuations on both electrodes.42 Complications With Polarization Resistance Measurements Error-producing complications related to the po- larization resistance method and possible remedies are reported in the literature.14-15,43-48 The most com- mon errors involve invalidation of the results through oxidation of some other electroactive species besides the corroding metal in question; a change in the open-circuit or corrosion potential during the time taken to perform the measurement; use of ∆E that is too large, invalidating the assumption of a linear re- lationship between iapp and E required by Equation (2) (i.e., ∆E/␤ < 1); too fast of a voltage scan rate or insufficient potential hold time; ohmic solution resis- tance; and current and potential distributions. Oxidation or Reduction of Some Other Electroactive Species If the Ecorr of the corroding system is close the re- versible electrode potential of the anodic or cathodic reactions or near the reversible electrode potential of any other redox process, then the corrosion rate likely will be overestimated because electrochemical reactions occur in parallel to metal dissolution. This situation can be ascertained experimentally with the use of any noncorroding, readily polarizable electrode such as platinum, gold, or high-density graphite. These materials have a low corrosion rate in most aqueous solutions and will assume a redox potential that is governed by the dominant parallel reduction- oxidation processes occurring in the system. If the corrosion potential of the corroding metal is very close to the redox potential of such an electrode, then Ecorr may be close to a reversible electrode potential. The error in estimation of the corrosion rate depends FIGURE 7. Rsn(␻)vsfrequencycomparedtotwotimestheimpedance |Z(␻)| vs frequency for two iron electrodes in 1 M Na2SO4 at pH 4 with a “noisy” iron reference electrode. Impedance measurements performed in a two-electrode cell yielded 2|Z(␻)|. Rsn(␻)= √3|Z(␻)| for the case of three “noisy” electrodes.41 (Reproduced by permission of The Electrochemical Society, Inc.)
  • 10. 208 CORROSION–FEBRUARY 2000 CRITICAL REVIEW OF CORROSION SCIENCE AND ENGINEERING upon the exchange current density for the redox pro- cess, icorr, ␤a, ␤c, and the difference in potentials between Ecorr and the reversible electrode potential in question.48 A cyclic voltammogram on the platinum electrode may reveal the approximate reaction rate of any parallel redox process over the potential range of interest. Deviations from Linearity Near the Open-Circuit Potential Deviations from linearity have been discussed in the literature.48-50 At issue is the question of when the range of ∆E is small enough such that the higher terms in the series expansion of Equation (1) reason- ably can be neglected. This requires that ∆E/b << 1. Clearly, the extent of the E-i region where Equation (2) is a good approximation of Equation (1) depends on the values of ba and bc. An approximately linear region can be restricted to ± 2 mV for low values of ba and bc and can be > 60 mV for high values. This cur- vature has been described mathematically as:48 ∂2 iapp ∂2 E = icorr 1 βa/2.3 2 + 1 βc/2.3 2 (16) Therefore, the extent of the curvature will depend upon icorr, which itself depends on B/Rp and is in- versely proportional to the squares of ␤a and ␤c. Hence, the curvature will be greater for smaller Rp (Figures 2 and 8), and smaller values of ␤a and ␤c. Obviously, the linear regions will differ for anodic versus cathodic polarization if differing values of ␤a and ␤c exist. Of course, the Rp always is obtained properly from the tangent of the E-iapp data in the vicinity of Ecorr. Stated another way, there always will be finite curvature associated with the true governing electrode kinetic expression given by Equation (1) when plotted as E vs iapp (Figure 2). Since the E-iapp behavior of the corroding electrode will have a finite, albeit small curvature, the presence of persistent lin- earity over a significant potential range may be a clue that ohmic voltage-controlled E-i behavior exists. 48 A second related issue is the asymmetry in the E-i response near Ecorr for different values of ba and bc. Corrosion involves a cathodic electron transfer reaction that is different from the metal oxidation reaction. Therefore, there is no fundamental reason why ba and bc should be equal and they should be expected to differ. The extent of their difference de- fines the degree of asymmetry. Asymmetry matters because the extent of the region where Equation (2) is a good approximation of Equation (1) then differs for anodic compared to cathodic polarization.50 The errors in assuming ±10 mV linearity using the tan- gent to the E-iapp data at Ecorr and for 10 mV or –10 mV potentiostatic polarizations has been defined for different Tafel slopes.51 Voltage Scan Rate, AC Frequency, or Hold Time During Potential or Current Step Capacitive current can result in hysteresis in small amplitude cyclic voltammogram E-iapp plots.16,51- 55 Hysteresis in the current density-applied potential plot is brought about by combinations of high-voltage scan rate, large interfacial capacitances, and large polarization resistances. High capacitance, multiplied by a rapid voltage scan rate, causes a high capacitive current that results in hysteresis in cyclic E-iapp data. Attempting to determine Rp at too fast of a scan rate can underestimate the true value inversely propor- tional to corrosion rate as shown by Macdonald,52 leading to an overestimation of corrosion rate. This error can be minimized by determining the polariza- tion resistance at a slow scan rate or extrapolating the results at several different slow scan rates to zero scan rate.52 Alternatively, one may take two or more current density measurements from potentiostatic data after long time periods near Ecorr to minimize scan rate effects. However, since cyclic voltammo- grams, potential steps, and current steps all represent the Fourier synthesis of sine waves, they all equally require adequate hold time, a low enough scan rate, or a low fmax to perform each measurement. This required time period depends on the RpCdl time constant of the electrochemical interface (Figure 3[a]) for an electrode that does not involve mass-trans- port-controlled reactions or Cf associated with adsorbed intermediates. The maximum scan rate allowed to obtain accu- rate measurements of the Rp has been addressed in the literature.56 The governing principles are best understood through the concepts of impedance and the Bode magnitude plot for the simplified Randles’ circuit (Figures 4[a] and [b]). Here, the maximum applied frequency allowed to obtain Rs + Rp from the FIGURE 8. Second derivative of E-iapp data (d2 iapp/d2 E) vs the sum (␤a + ␤c) for icorr = 1.305, 13.05, and 130.5 µA/cm2 , indicating that curvature of E-iapp data is a function of corrosion rate and Tafel parameters.
  • 11. CORROSION–Vol. 56, No. 2 209 CRITICAL REVIEW OF CORROSION SCIENCE AND ENGINEERING low-frequency plateau can be approximated by: fmax < fbp ≅ 1 2πC Rs + Rp (17) where fbp is an approximation of the lower breakpoint frequency (Hz) and fmax is the maximum test fre- quency (Hz). Thus, it can be seen from Equation (17) that increasing values of C, Rs, or Rp dictate that a lower fmax is required to accurately obtain Rp + Rs on the low-frequency plateau as Z␻→0 (Figure 4). Capaci- tances may become larger than that expected for the Cdl when adsorption C␾ are present. Such a C␾ may be caused by an adsorbed intermediate with some fractional monolayer coverage. Corrosion of steel in concrete can complicate LPR measurements owing to very large apparent capacitances that actually may represent the finite diffusional impedance associated with mass transport control of the oxygen reduction reaction.57 One way that Rp may be increased is by passivity. Another is by diffusion-controlled corrosion such that Rp = Rct + RD. A 1-mHz frequency typically is chosen as a reasonable initial choice of fmax, but it is obvious from Equation (17) that either lower or higher frequencies may be required depending upon the exact values of Rs, Rp, and C. Since the magni- tudes of C, Rs, and Rp are not known explicitly, a priori prudence dictates that fmax be selected as one tenth of the estimated fbp. Mansfeld and Kendig pro- posed that fmax determined from the impedance method defines the maximum voltage scan rate (vmax) for the potentiodynamic method.43 This derivation is based on the assumption that the vmax should not exceed the maximum rate of change of voltage with time during the sinusoidal voltage excitation at fmax. vmax = π∆Eppfmax 10 (18) Here, ∆Epp is the peak-to-peak voltage excitation. Therefore, vmax is 0.16 mV/s assuming a 10-mV peak-to-peak amplitude for the equivalent circuit shown in Figure 3 with Rp = 1,000 Ω, Rs = 10 Ω, and C = 1,000 µF. If ∆E is ±5 mV, then the time required for one complete cyclic voltammogram at such a potential sweep rate is 125 s. However, for a slowly corroding electrode with the Rs + Rp = 10,010 Ω, vmax becomes 0.0157 mV/s and the time required is 1,250 s. Similarly, a frequency above the high- frequency breakpoint (fhf) must be applied to obtain Rs. Typically, fapp must be in the KHz range to deter- mine accurately Rs: fhf ≥ 1 2πCRs (19) In separate but parallel efforts, Gabrielli,53 Macdonald,52 and Townley54 each discussed the appropriate choice of voltage scan rates for accurate Rp determination from small amplitude cyclic voltammograms. Each investigator considered a simple equivalent circuit (Figure 3[a]). Macdonald and Townley derived the current response of the standard three-element electrical equivalent circuit to describe an electrochemical interface (Figure 3[a]) to a small amplitude triangular voltage excitation (e.g., a potential sweep at fixed scan rate with a reverse sweep at some peak potential). The E-iapp response of this circuit to the triangular voltage exci- tation was shown to be a complex function of circuit elements, ∆Epp, and the voltage sweep rate. The rela- tionships between the various ∆E/∆iapp slopes (R) and scan rate were determined. Macdonald characterized the E-iapp response by the diagonal resistance associ- ated with iapp at the peak potentials, Rd. The apparent resistance (Rapp) determined from the tangent to the E-iapp curve at the end of the upward sweep before the downward sweep (and vice versa), Rapp, and the hysteresis current. Townley obtained Rmeas, which is similar to the tangent resistance, Rapp: 1 Rd = 1 Rs + Rp + 2Rp 2 C ∆E Rs + Rp ea∆Epp/vb – 1 ea∆Epp/vb + 1 (20) 1 Rapp = 1 Rs + Rp + 2Rp Rs Rs + Rp 1 1 + ea∆Epp/vb (21) 1 Rmeas = 1 Rs + Rp + Rp Rs Rs + Rp e–t/τ (22) In these equations, a = Rs + Rp, b = RsRpC, t is time, v is sweep rate, and τ = 1/RsC + 1/RpC. Time (t) in Equation (22) can be equated to the sweep rate since t = ∆Epp/v. Therefore, all three equations include a term that is independent of the voltage scan rate and a second transient term that depends on voltage scan rate or time relative to the RC time constant of the equivalent circuit representing the electrochemical interface. The scan rate dependent term becomes negligible at low scan rates. These analyses predict an increase in current hysteresis and deviation of Rd and Rmeas from Rp + Rs at high scan rates, as shown in the theoretical cyclic E-iapp data of Figure 9(a). Figure 9(b) shows actual experimental results from a Cu-Ni alloy in flowing seawater. A plot of experimental 1/Rd and 1/Rapp data vs scan rate is shown in Figure 9(c) for the Cu-Ni system. Macdonald and Townley de- duced (Equations [21] and [22]) that it is theoretically
  • 12. 210 CORROSION–FEBRUARY 2000 CRITICAL REVIEW OF CORROSION SCIENCE AND ENGINEERING possible in the ideal case to determine Rp + Rs from the tangent to the E-iapp curve at the end of the for- ward and reverse sweeps at much higher scan rates than predicted by Equations (17) and (18). The ideal scan rate maxima can be seen in Figures 10(a) and (b) for the same circuit parameters as examined above (i.e., Rs = 10 Ω, Rp = 1,000 Ω, and C = 10–3 F). Specifically, it is shown that 1/Rmeas and 1/Rapp ap- proach the values 1/(Rs + Rp) at scan rates as high as 100 mV/s when the slope of the E-iapp plot is care- fully taken at the very end of the forward or reverse voltage scan just before reversal. However, accurate determination of 1/(Rs + Rp) from experimental 1/Rd values still requires a scan rate < 1 mV/s, which is in agreement with the predictions from Equations (17) and (18). The equivalence of Rapp to (Rs + Rp) at fast scan rate must be treated with precaution in real corrod- ing systems. Such an equivalence is only true for ideal, fast charge-transfer-controlled corrosion pro- cesses and ideal finite Cdl (e.g., when Rp = Rct). The presence of mass transport control or an adsorption C␾ caused by formation of an adsorbed intermediate that participates in the corrosion process may com- plicate the results and the ability to use faster scan rates. Roles of adsorbed intermediates and mass transport in corrosion may not be accounted for properly at very fast scan rates because the surface coverage and diffusional boundary layer does not have time to react fully and adjust to a very fast change in voltage. Rct may be determined instead of Rp at the DC limit if the scan rate is so fast so as to freeze in the coverage (Figure 3[c]). Unfortunately, a sufficiently fast scan rate that “freezes-in” an inter- mediate coverage also may result in large capacitive currents that could result in Rd values far below Rp. Moreover, as the scan rate or frequency is lowered, the effects of an adsorbed intermediate that gives rise to an adsorption C␾ and dependency of Rp on the sum of Rct and the parallel impedance of C␾||RF be- come factors in the resistance measured (Figure 3[c]). Indeed, Macdonald observed that an accurate value of Rs + Rp was, in fact, not obtained from Rapp or Rd determined at fast scan rates for a corroding Cu-Ni alloy in flowing seawater (Figures 9[b] and [c]).52 The experimental case of Cu-Ni in seawater shows that a much lower scan rate is required despite the more optimistic predictions of Equations (20) through (22) (Figures 10[a] and [b]). In contrast, a model like that of Figure 3(a) for an ideal RpC interface, where Rp = Rct, suggests that 4 mV/s to 20 mV/s scan rates would be more than slow enough to obtain an Rapp (a) (b) (c) FIGURE 9. (a) Small amplitude cyclic voltammograms depicting the theoretical E-iapp response for the electrical equivalent circuit of Figure 3(a) with RP = 1,000 Ω, Cdl = 1,000 µF, and RS = 10 Ω when triangle voltage excitation waveform is applied to a corroding interface at the various scan rates indicated. All results are for the circuit parameters listed above. (b) Experimental small amplitude cyclic voltammograms for 90:10 Cu-Ni in flowing seawater showing effect of voltage scan rate. (c) Reciprocal values of Rd and Rapp vs scan rate obtained from experimental E-iapp data for 90:10 Cu-Ni in seawater. (D.D. Macdonald, J. Electrochem. Soc. 125 (1978): p. 1,443. Reproduced by permission of The Electrochemical Society, Inc.)
  • 13. CORROSION–Vol. 56, No. 2 211 CRITICAL REVIEW OF CORROSION SCIENCE AND ENGINEERING value that approaches Rp. Experimentally, this is not the case in the Cu-Ni system since corrosion rate would be overestimated from such an assumption. In this system, the O2 reduction reaction is likely at least partially mass-transport controlled at the Ecorr of the Cu-Ni alloy and adsorbed oxidized Cu interme- diate species also control the overall dissolution process. Regarding measurement speed, Jones and Greene proposed that a current step method was attractive because of measurement speed and ability to contend with Ecorr drift during the time taken to conduct the measurement.58 For negligible Rs, it has been shown the potential transient during a current step is given by: Eapp = Ecorr + iappRp 1 – exp–t/RpC (23) When t ≥ 4 RpC, Eapp reaches 98% of the value achieved at infinite time. Therefore, the polarization resistance condition is reached when t ≥ 4 RpC, and Equation (23) reduces to ∆E/iapp = Rp. The time re- quired to reach this condition is ~ 4 s for Rp = 1,000 Ω, Rs = 10 Ω, and C = 1,000 µF. However, the time required for a slowly corroding electrode with Rp = 10,000 Ω is ~ 40 s. Thus, in comparison to polariza- tion scans using the voltage scan rates predicted from Equation (18), the time required for a single current step to approach steady state is much less than the time required to complete a low-amplitude cyclic voltammogram given exactly the same electri- cal equivalent circuit parameters. It also has been argued that the measurement of overvoltages at selected times after a series of small current steps produces ∆E vs iapp plots that develop linear slopes approximating the steady-state conditions after in- complete, short periods of decay.58 Finally, short time, fast scan rate, or high fmax concerns equally plague time as well as frequency domain methods for obtaining Rp, since in the time domain measurement, the triangle waveform is sim- ply the Fourier synthesis of a series of sinusoidal signal functions. However, voltage sweep, potential step, and impedance methods should all yield the same value of Rp when all the scan rate and AC fre- quency precautions discussed above are taken into consideration such that the low-frequency plateau in |Z(␻)| data is obtained and this data represents Rp + Rs. This has been demonstrated by Syrett in a study that produced Rp values that were independent of voltage excitation waveform.59 Use of Rct vs Rp When the Adsorbed Intermediate Surface Coverages Affect Anodic and/or Cathodic Reaction Rates Some complexities remain concerning whether to use Rct at intermediate frequencies instead of Rp at the DC limit when attempting to conduct corrosion rate determinations in the presence of adsorbed in- termediate surface coverages that affect anodic and/ or cathodic reaction rates. To address this issue, it is necessary to clarify the difference between Rct and Rp. Recall the definition of Rp given by (∂E/∂iapp)at t=∞, ∆E=0. To define Rct, consider a derivation of the slope of the E-i app data from a cyclic voltammogram conducted near Ecorr following the derivation of Epelboin.60-61 Iapp is the difference between the anodic and cathodic half-cell currents: Iapp = Ia – Ic (24) where the subscripts a and c represent the anodic and cathodic half-cell reaction rates. Rp (Ω) is given in terms of Ia and Ic as: (a) (b) FIGURE 10. Relationship between measured Rapp, Rd, and Rmeas and scan rate using Equations (20) through (22) for the circuit model of Figure 3(a) with RP = 1,000 Ω, C dl = 1,000 µF, and RS = 10 Ω. The impedance of the system at the limit of zero scan rate is RS + RP. The impedance of the system at infinite scan rate is RS. Measured Rapp, Rd, and Rmeas values lie in between these limits depending on scan rate: (a) linear scale and (b) semilogarithmic scale. The predicted vmax from Equations (17) and (18) is indicated.
  • 14. 212 CORROSION–FEBRUARY 2000 CRITICAL REVIEW OF CORROSION SCIENCE AND ENGINEERING 1 Rp = ∂Iapp ∂E t=∞,∆E=0 = ∂Ia ∂E _ ∂Ic ∂E (25) When the low-overpotential linear approximation is valid at small values of ∆E, ∂Ia/∂E, and ∂Ic/∂E = 2.3I(a)corr/␤a and –2.3I(c)corr/␤c, respectively. Here, I(a)corr and I(c)corr describe the anodic and cathodic currents at the corrosion potential. At Ecorr, these equal Icorr, and ␤a and ␤c are Tafel slopes for the anodic and ca- thodic reactions. 1 Rp = 1 Rct = ∂Iapp ∂E = 2.3Icorr 1 βa + 1 βa (26) A complexity arises in taking the derivatives ∂Ia/∂E and ∂Ic/∂E if a corrosion reaction is considered that depends upon the surface coverage (␪) of an interme- diate that participates in the anodic dissolution or cathodic reduction reactions. Here, either the overall anodic or cathodic reaction or both occur on only a fraction ␪ of the total electrode surface area (A). An oxidized intermediate is typical of corrosion processes that involve multiple oxidation or electro- chemical reaction steps that must be completed sequentially to describe the overall reaction rate. The reaction only can proceed on the fraction of surface area containing the required intermediate. Example of intermediates during active metallic dissolution include Fe/Fe(OH)/Fe(OH)+ /Fe+2 and Ti(OH– )/Ti(OH)/ Ti(OH)+ /Ti(OH)2+ /Ti(OH)3+ /Ti3+ ,62-63 although no Tafel E-log(ia) region is observed in the case of the latter. In these cases, the overall corrosion rate may depend upon the coverage of the anodic intermediate ␪a, depending upon the exact rate-determining step. Similarly, a cathodic reaction such hydrogen evolu- tion (HER) may depend upon the coverage of bare sites, special sites, or for the electrochemical desorp- tion HER mechanism by sites already covered with adsorbed hydrogen (␪c). Depending on the HER mechanism, the rate may increase or decrease with coverage. Often, these coverages are potential depen- dent. The reaction rate per fractional area is then ia = Ia/␪a and ic = Ic/␪a assuming unity electrode area (A). Rp will depend on two terms that yield the overall slope ∂Iapp/∂E at fixed coverage and two terms that are dependent on the variation in the coverages with potential: 1 Rp = ∂Iapp ∂E = θa ∂ia ∂E – θc ∂ic ∂E + ia ∂θa ∂E – ic ∂θc ∂E (27) The first two right-hand terms equal Rct in this simple analysis where charge transfer describes simple interface charge-transfer control occurring quickly (subject to charging of the Cdl) at fixed cover- ages ␪a and ␪c. The dependency of Rp on reaction intermediate coverage occurs when the third and fourth terms apply. The third and fourth terms can be ignored under two conditions. In either case, Rp then equals Rct given by the first two terms. The first condition is the simple ideal case where the cover- ages are fixed at a value equal to the coverage present at Ecorr or there is no coverage involved and reactions proceed over the total bare area of the elec- trode. The second case is at some high voltage scan rate or AC frequency, where the applied potential (E) changes too quickly to allow the coverage to be modi- fied during the potential sweep or sinusoidal voltage excitation (the potential sweep must not be so fast so as to produce appreciable Cdl currents). At fast scan rate, the coverages present at Ecorr are effectively “frozen in” and the third and fourth terms equal zero. The current shorts through the C␾ created by such a coverage (Figure 3[c]).22 If ideal charge-transfer con- trol is assumed at fixed coverages, ia and ic respond almost instantaneously to an applied potential through the following relationships: ia = i(a)corr exp 2.3 E – Ecorr βaθ(a)corr (28) ic = i(c)corr exp –2.3 E – Ecorr βcθ(c)corr (29) where ␤a␪(a)corr and ␤c␪(c)corr give the Tafel slopes at a fixed coverage equal to the coverages present at Ecorr. Taking the derivatives ∂ia/∂E and ∂ic/∂E using the small overpotential approximation yields ia = 2.3i(a)corr/␤a␪(a)corr and ic = –2.3i(c)corr/␤c␪(c)corr. Making these substitutions, recognizing that icorr = ia(corr) = ic(corr), and rearranging yields the Stern-Geary equa- tion in a slightly different form: 1 Rp = ∂Iapp ∂E = θ(a)corr 2.3i(a)corr βa + θ(c)corr 2.3i(c)corr βc (30) Recognizing that i(a)corr = Ia(corr)/␪a(corr) , i(c)corr = Ic(corr)/ ␪a(corr), Icorr = Ia(corr) = Ic(corr), and by making these substi- tutions, a familiar linear relation is obtained with the simple distinction that ␤a␪(a)corr and ␤c␪(c)corr define the Tafel slopes for the coverages present at the Ecorr: ∂Iapp ∂E = 1 Rp = 2.3Icorr 1 βaθ(a)corr + 1 βcθ(c)corr (31)
  • 15. CORROSION–Vol. 56, No. 2 213 CRITICAL REVIEW OF CORROSION SCIENCE AND ENGINEERING Thus, Rct = Rp in the simple cases where ideally fast charge transfer occurs and the coverage is fixed or when there is no coverage dependency. A more complicated result is obtained at slow scan rate or low AC frequency when the coverage can change with potential. Again, the linear approxima- tion is enabled as ∆E becomes small: ∂Iapp ∂E = 1 Rp = 2.3Icorr 1 βaθ(a)corr + 1 βcθ(c)corr + Icorr 1 θa ∂θa ∂E – 1 θc ∂θc ∂E (32) The first right-hand term is 1/Rct (e.g., the instanta- neous portion related to the faradaic current) and the whole right-hand expression gives 1/Rp.60-61 The 1/␪(∂␪/dE) terms are typical nonzero contributions at Ecorr when there are potential dependent coverages that are nonzero near Ecorr. There is absolutely no reason that the coverages should be zero at Ecorr since the corrosion potential is an “open-circuit” po- tential established at a specific potential somewhere between the respective reversible electrode potentials of the cathodic and anodic half-cell reactions. Spe- cifically, Ecorr is established at the potential where ia␪a A = ic␪c A. Therefore, it is clear that Rp may be > or < Rct, depending whether the partial derivatives ∂␪a/∂E and ∂␪c/∂E are positive or negative quantities as the applied potential is swept in forward and re- verse directions. This can account for the common observation that Rp > Rct in the case of so-called pseudo-capacitive behavior,22 as shown in the circuit model of Figure 3(c) containing an adsorption pseudo-capacitance. Moreover, it is possible that Rp < Rct,64 as in the case of so-called pseudo-inductive behavior where an inductance is observed at low fre- quency (Figure 6[b]63 ). The condition, Rp > Rct, has been seen by subtracting the Cdl from the faraday im- pedance data.65 Thus, Equation (32) supports the view that Rp at the zero frequency limit can be < or > Rct, depending on how the coverages that factor into the anodic and cathodic reaction rates change with potential. The differences between Rp and Rct are observed sometime to decrease when the magnitude of the voltage perturbation is reduced such that the coverage is negligibly altered.64 An alternative view of the effect of voltage perturbation in the case of in- hibitors is that the inhibitor is desorbed irreversibly by potential scanning above Ecorr such that the corro- sion rate is increased.64 However, such phenomena also might be understood using Equation (32) since Rp would be expected to be similar to Rct when the voltage perturbation is smaller. Also, physically unre- alistic parameters such as the electrical inductor do not have to be invoked. It is tempting to eliminate the right-hand second term by conducting experiments at fast scan rate to freeze-in or fix the coverages.66 However, the lower impedance of the Cdl and adsorption C␾ at high frequency may complicate measurements by switching capacitive currents into the iapp measurement. Furthermore, it also must be recognized that the Tafel slopes presented in the first right-hand term of Equation (32) still would need to be the “iso-coverage” Tafel slopes, ideally obtained by experiments where the coverages were fixed at their values present at Ecorr. Unfortunately, ␤a and ␤c rarely are obtained under iso-coverage conditions in practi- cal corrosion situations.67-71 Iso-coverage Tafel parameters have been produced by correction of HER reaction rate data by exploiting hydrogen absorption and permeation through iron foils to control cover- age.67 Here, foil thickness decreased as current density is increased to change permeation flux such that surface coverage is held constant over a range of reaction rates. Consequently, determination of corro- sion rates in the presence of adsorbed intermediates is not a simple matter of obtaining Rct at high fre- quency or scan rate, where ∂␪a/∂E equals zero because ␪ might be frozen during such rapid poten- tial changes. As shown here, another source of errors is the values of ␤a and ␤c obtained in slow scans at high overpotential because this mixes ∆E-iapp data where the coverage is frozen-in (e.g., Rct) with E- log(iapp) Tafel data (e.g., ␤a and ␤c) where potential dependent coverages may differ from those at Ecorr. An additional problem is that there is now another reason why ∂i/∂E should not be linear even as ∆E approaches zero if the coverage changes significantly with potential over the same potential range. More- over, there is no reason why E-log (iapp) data obtained over a large potential range should be linear on a semi-log plot when the coverage changes with poten- tial. Nonstraight Tafel data often are observed.68,71 Theoretical E-log iapp data with changing intermediate coverage are shown in Figure 11. The data is pre- sented for charge-transfer-controlled oxidation kinetics over a fraction of the surface area given by coverage ␪a. The E-log(iapp) curve was created under the following conditions. Anodic coverage (␪a) is com- monly an exponential function of potential as governed by the following expression assuming a Langmuir isotherm. This expression yields a nonzero coverage at E = Ecorr: θa 1 + θa = kexp F E – Erev RT (33) As an example, a hypothetical E-iapp relationship is considered for corrosion involving an overall oxida- tion half-cell reaction (M + OH– → MOH+ + 2e– ) that depends on the coverage ␪a as described in Equation
  • 16. 214 CORROSION–FEBRUARY 2000 CRITICAL REVIEW OF CORROSION SCIENCE AND ENGINEERING (33) for the adsorbed intermediate MOH that partici- pates in a series of single electron transfer reactions. The cathodic reaction in this example is assumed to be the fast-discharge slow electrochemical desorption hydrogen evolution reaction. This HER reaction rate depends on the coverage of adsorbed hydrogen. This situation is similar to the corrosion mechanism of iron in acid where either the catalyzed mechanism of Huesler72-73 or the intermediate mechanism of Bockris62 involves an anodic half-cell reaction whose rate depends on the coverage of the adsorbed com- plex FeOHads. In the present example, the coverage of the hypothetical activated complex MOHads is a factor determining the overall anodic half-cell reaction rate. Consider the case where the coverage changes form near zero to near one in the vicinity of Ecorr, such that the assumption of a fixed Tafel slope is unrealistic, even though it often is assumed to be constant in the literature. In conventional textbook examples, the coverage is assumed to either remain near zero or near unity and a fixed Tafel slope can be developed and used as a reaction diagnostic. For instance, the Tafel slope often is taken to be constant at ␤a = 2.3RT/[(1 + 2␣a)F], assuming a low coverage (␪a) at all potentials when the FeOHads coverage is an exponen- tial function of potential. In this case, the Tafel slope approaches 0.029 V when the symmetry factor (␣a) is 0.5 in agreement with experimental data. However, the assumption has been made that ␪a remains low over the entire potential range of the experiment. This is not the case in the hypothetical example used here. If coverages change considerably in the potential range studied, the more general expression should be used where ␪a is determined from Equation (33): Iapp = icorrA θaexp αaF E – Ecorr RT – θcexp –αcF E – Ecorr RT (34) Here, the anodic and cathodic reactions increase with the coverages of adsorbed MOH and H species, the coverages change from near zero to near unity over the potential range near Ecorr, and the Langmuir isotherm is assumed. In this case, the condition of equality at Ecorr is that ia(corr) A ␪a(corr) = ic(corr) A ␪c(corr), where A is the total electrode area. Under these simple assumptions, the resulting E-log(iapp) data ex- hibits a continuously varying slope ∂E/∂log (iapp) that does not yield a single value for ␤a until ␪a reaches one (Figure 11). Therefore, to determine the corrosion rate in a rigorously correct manner in the case of adsorbed intermediate coverages that change near Ecorr, Rct obtained from suitably fast scans only can be used only if ␤a and ␤c values also are representa- tive of the iso-coverage conditions existing at Ecorr. In other words, Tafel slopes need to be determined at a relevant frozen-in or fixed coverage. This could be achieved by obtaining ␤a and ␤c from fitting E-iapp data near Ecorr under the premise that coverage changes only slightly at low ∆E; producing iso-cover- age Tafel data from E-log(iapp) data fixed at the coverage present at Ecorr; or determining Tafel slopes from E-log(iapp) data at fast scan rate to freeze-in ␪a and ␪, assuming negligible capacitive current. Unfor- tunately, the merits of these various methods toward producing accurate results compared to one another remain relatively untested. Obviously, numerous (a) (b) FIGURE 11. (a) Theoretical E-log(Iapp) plot and (b) corresponding E-Iapp plot for reactions rates that depend upon film coverage based on Equation (34). The anodic coverage is an exponential function of potential according to Equation (33) with k = 0.01 in the case of the dotted curve. The dashed curve is constructed at fixed coverages (␪a [E = Ecorr] = 0.068, ␪HER [E = Ecorr] = 0.06) equal to the coverages present at OCP (0 V). The solid curve assumes no role of coverage such that the reaction proceeds over the entire electrode area of 1 cm2 . The open-circuit potential was selected arbitrarily to be 0 mV, and the corrosion rate is 1.3 µA/cm2 per unit area covered with the intermediate film MOH. ␤a = ␤c = 120 mV in all calculations.
  • 17. CORROSION–Vol. 56, No. 2 215 CRITICAL REVIEW OF CORROSION SCIENCE AND ENGINEERING other situations can be envisioned that have not been covered here, such as inhibiting species desorb- ing as a function of potential, coverage governed by Frumkin or Temkin isotherms, reaction mechanisms that change near Ecorr, or multiple-step, single- electron-transfer reactions that have other coverage dependencies, etc. The purpose of the present ex- ample was only to illustrate the role of changing coverage in creating a difference between Rct and Rp and in adding complexities to the determination of Tafel slopes. Rp still is often estimated from slow scans ap- proaching the DC limit by taking a tangent to the nonlinear E-iapp data near Ecorr. The Stern-Geary approximation still is utilized to estimate icorr using an apparent B factor involving apparent Tafel slopes that are imprecise. Such data still often agrees with gravimetric mass loss and solution analysis data. Two reasons emerge. Although the terms 1/␪(∂␪/dE) in Equation (32) are often nonzero at Ecorr, they often are small. Moreover, the weak dependence of corrosion rate on the parameter B in the Stern approximation permits imprecise estimates of Tafel slope to be tolerated in many cases. Of course, Rp values obtained at extremely low-frequency or scan rates should be used in the modified Stern equation in the case of total mass transport control of either the anodic or cathodic reaction (with an infinite Tafel slope for the mass-transport-controlled reaction) as well as in the case of passive dissolution. Use of the Rct obtained at higher frequency or scan rate yields the value of corrosion rate that would be pertinent if both anodic and cathodic reactions were under in- stantaneous charge-transfer control. Rct should be used in the Stern approximation if Tafel slopes under charge-transfer-controlled conditions are utilized.66 In some cases, effects of inhibitor concentration on iron corrosion rate were best assessed using Rct as opposed to Rp.66 Effect of Solution Resistance Another frequently encountered complication is the need to correct polarization data for errors that arise from the contribution of Rs. Rs contributes to a voltage error as well as a scan rate error.2 Since the applied potential is increased by an ohmic voltage component, an apparent value of Rp is obtained, which overestimates Rp by an amount equal to Rs. Consequently, the corrosion rate is underestimated. Nonuniform Current and Potential Distributions to Polarization Resistance Probes A dimensionless parameter known as the Wagner number is useful for qualitatively predicting whether a current distribution will be uniform or nonuniform.2,74-75 This parameter helps to answer the question of which current distribution applies to the electrochemical cell: primary, secondary, or tertiary? The Wagner parameter (W) is the ratio of the kinetic resistance to the ohmic resistance. The W is the ratio of the true polarization slope given by the partial derivative, ∂Etrue/∂iapp, (evaluated at the overpotential of interest at constant pressure, tem- perature, and concentration) divided by the characteristic length and the Rs.2,74 W = κ L ∂E ∂i (35) where ␬ (or 1/␳) is the specific solution conductivity (Ω-cm)–1 and L is a characteristic length (cm), or the dimension of “irregularity.” Its value marks the tran- sition from the primary to the secondary current distribution. When the Wagner number is much less than 1, the ohmic component dominates and current and potential distributions are governed primarily by cell geometry. When it is much larger than 1, the kinetic component dominates and the resistance of the interface primarily governs the current flow from counter electrode to working electrode. In practice, the primary current distribution is said to exist when W < 0.1, and the secondary current distribution ex- ists if W > 102 . The partial derivative, ∂E/∂i, can be taken from any expression describing the interfacial potential (Etrue) as a function of iapp or obtained as a Rp from experimental E vs iapp data. The partial de- rivative, ∂E/∂i, has the units of Ω-cm2 . The Rs expressed in the same units is given by (␬/L). The resulting Wagner number in the low-overpotential region where the linear E-i approximation can be applied is: W = Rp Rs (36) Thus, the experimenter interested in estimating the current distribution “regime” pertinent to their polar- ization cell can estimate whether the primary or secondary current distribution applies from knowl- edge of Rp and Rs. The corrosion engineer can use this information in the following way. If the primary current distribution applies (W < 0.1), then current distributions are likely to be very nonuniform unless an ideal cell geometry leading to a uniform primary current distribution is used. Otherwise, errors in polarization resistance and other kinetic parameters are then likely because the electrode area actually undergoing polarization differs from the total area. Low scan rate data at the zero frequency limit may yield the same apparent value of Rp + Rs, but the area required to compute a true Rp value is uncertain. Errors in Rp from nonuniform primary or second- ary current distributions have been documented.76 Data presented in the literature (Figure 12) show
  • 18. 216 CORROSION–FEBRUARY 2000 CRITICAL REVIEW OF CORROSION SCIENCE AND ENGINEERING examples of the extent of such errors.77 Positioning of the reference electrode at the center, edge, and at infinity with respect to the disk-shaped working elec- trode altered the apparent polarization resistance value (Reff) by some amount relative to the true value given by Rp. Placement at the edge is typical of flush- mounted probes. The source of difference between Rp and Reff with position lies in the fact that no single Rs value applies for all electrode positions. In other words, there is a nonuniform ohmic potential drop over the disk. There can be large errors depending on reference electrode position (center, infinity, edge), solution conductivity geometry, and Rp.73 When solu- tion conductivity (␬) and Reff are increased, the Wagner number becomes larger, indicating a more uniform current distribution and minimization of this source of error. Similarly, counter and reference elec- trode placement in low conductivity environments can alter Rs values and apparent Reff values.78 SUMMARY The polarization resistance method, when per- formed properly, enables reliable determinations of instantaneous corrosion rates. Modern methods for obtaining Rp data such as the electrochemical imped- ance as well as statistical and spectral noise methods are now available. The Rsn(␻) has been shown in the literature to be equivalent to the electrochemical im- pedance over the same frequency range for identical electrodes in a two-electrode cell. The Rsn(␻) near the zero frequency limit is proportional to Rp if the im- pedance yields Rp over the same range of frequency. The statistical noise resistance taken from E-t and iapp-t data is typically equivalent to the cell impedance at some frequency above zero. Traditional sources of error such as high excitation voltage amplitude, insufficiently slow scan rate, high AC frequency, inadequate polarization hold period, high solution resistance, presence of parallel reduction-oxidation reactions, and nonuniform current and potential dis- tributions can confound accurate determination of corrosion rate. Lastly, the affects of potential-depen- dent adsorbed intermediate films that regulate the overall reaction rate and adsorption C␾ on electro- chemical reaction rates are discussed with emphasis on how they influence the measured interfacial resis- tance. The Rct can be obtained if the coverage is unchanged by excitation voltage but it may be larger or smaller than Rp. ACKNOWLEDGMENTS Financial support from the Air Force Office of Scientific Research (Major H.D. Long) and The Office of Naval Research (A.J. Sedriks) is acknowledged. Electrochemical Instrumentation and Software in the Center for Electrochemical Science and Engineering are supported by EG&G Instruments and Scribner Associates, Inc. C. Quarmby and R. Leggat assisted in manuscript preparation. REFERENCES 1. J.O’M. Bockris, A.K.N. Reddy, Modern Electrochemistry 2 (New York, NY: Plenum Press, 1970). 2. E. Gileadi, Electrode Kinetics for Chemists, Chemical Engi- neers, and Materials Scientists (New York, NY: VCH Publishers, 1993). 3. D.A. Jones, Principles and Prevention of Corrosion (New York, NY: Macmillan Publishing, 1992). 4. M. Stern, R.M. Roth, J. Electrochem. Soc. l04 (1957): p. 390. 5. M. Stern, A.L. Geary, J. Electrochem. Soc. 105 (1958): p. 638. 6. M. Stern, A.L. Geary, J. Electrochem. Soc. 104 (1957): p. 56. 7. I. Epelboin, C. Gabrielli, M. Keddam, H. Takenouti, Electro- chemical Corrosion Testing, STP 727, eds. F. Mansfeld, U. Bertocci (West Conshohocken, PA: ASTM, 1981), p. 150. 8. M. Stern, E.D. Weisert, “Experimental Observations on the Relation Between Polarization Resistance and Corrosion Rate,” in ASTM Proceedings, vol. 59 (West Conshohocken, PA: ASTM, 1959), p. 1,280. 9. D 2776-79, 03.02, “Test Methods for Corrosivity of Water in the Absence of Heat Transfer (Electrical Methods),” Annual Book of ASTM Standards (West Conshohocken, PA: ASTM). 10. ASTM Standard G-59, “Standard Practice for Conducting Poten- tiodynamic Polarization Resistance Measurements,” Annual Book of Standards (West Conshohocken, PA: ASTM). 11. F. Mansfeld, Electrochemical Techniques for Corrosion, ed. R. Baboian (Houston, TX: NACE, 1977), p. 18. 12. D.A. Jones, N.D. Greene, Corrosion 22 (1966): p. 198. 13. D.A. Jones, Corrosion 39 (1983): p. 444. 14. K.B. Oldham, F. Mansfeld, Corros. Sci. 13 (1973): p. 813. 15. F. Mansfeld, J. Electrochem. Soc. 120 (1973): p. 515. 16. D.D. MacDonald, M.C.H. McKubre, Electrochemical Corrosion Testing, STP 727, eds. F. Mansfeld, U. Bertocci (West Conshohocken, PA: ASTM, 1981), p. 110. FIGURE 12. Relationship between the measured Reff value and true Rp value at ␻ = 0 for nonuniform current distributions to a flush- mounted electrode. The error decreases with increasing Wagner number, which is equivalent to a decreasing error as Reff and solution conductivity increase.77
  • 19. CORROSION–Vol. 56, No. 2 217 CRITICAL REVIEW OF CORROSION SCIENCE AND ENGINEERING 17. A.J. Bard, L.R. Faulkner, Electrochemical Methods: Fundamen- tals and Applications (New York, NY: John Wiley and Sons, 1980). 18. F. Mansfeld, Corrosion 36, 5 (1981): p. 301. 19. F. Mansfeld, M.W. Kendig, S. Tsai, Corrosion 38 (1982): p. 570. 20. ASTM G 106, vol. 03.02, “Practice for Verification of Algorithm and Equipment for Electrochemical Impedance Measurements,” Annual Book of ASTM Standards (West Conshohocken, PA: ASTM). 21. D.R. Franceschetti, J.R. Macdonald, Electroanal. Chem. 101 (1979): p. 307. 22. S.R. Taylor, E. Gileadi, Corrosion 51 (1995): p. 664. 23. D.A. Eden, A.N. Rothwell, J.L. Dawson, “Electrochemical Noise for Detection of Susceptibility to Stress Corrosion Crack- ing,” CORROSION/91, paper no. 444 (Houston, TX: NACE, 1991). 24. J.L. Dawson, ASTM STP 1277, “Electrochemical Noise Measure- ment for Corrosion Applications,” eds. J. Kearns, J.R. Scully, P.R. Roberge, D.L. Reichert, J.L. Dawson (West Conshohocken, PA: ASTM, 1996), p. 3-35. 25. D.A. Eden, K. Hladky, D.G. John, J.L. Dawson, “Electrochemi- cal Noise — Simultaneous Monitoring of Potential and Current Noise Signals from Corroding Electrodes,” CORROSION/86, paper no. 274 (Houston, TX: NACE, 1986). 26. D.A. Eden, A.N. Rothwell, “Electrochemical Noise Data: Analy- sis Interpretation Presentation,” CORROSION/92, paper no. 292 (Houston, TX: NACE, 1992). 27. A.N. Rothwell, D.A. Eden, “Electrochemical Noise Techniques for Determining Corrosion Rates and Mechanisms,” CORRO- SION/92, paper no. 223 (Houston, TX: NACE, 1992). 28. U. Bertocci, ASTM STP 1277, “Electrochemical Noise Measure- ment for Corrosion Applications,” eds. J. Kearns, J.R. Scully, P.R. Roberge, D.L. Reichert, J.L. Dawson (West Conshohocken, PA: ASTM, 1996), p. 39-58. 29. U. Bertocci, F. Huet, Corrosion 51 (1995): p. 131. 30. D.L. Reichert, ASTM STP 1277, “Electrochemical Noise Mea- surement for Corrosion Applications,” eds. J. Kearns, J.R. Scully, P.R. Roberge, D.L. Reichert, J.L. Dawson (West Conshohocken, PA: ASTM, 1996), p. 79-89. 31. P.C. Searson, J.L. Dawson, J. Electrochem. Soc. 135, 8 (1988): p. 1,908. 32. F. Mansfeld, H. Xiao, ASTM STP 1277, “Electrochemical Noise Measurement for Corrosion Applications,” eds. J. Kearns, J.R. Scully, P.R. Roberge, D.L. Reichert, J.L. Dawson (West Conshohocken, PA: ASTM, 1996), p. 59-78. 33. G.P. Bierwagen, J. Electrochem. Soc. 141 (1994): p. L155. 34. F. Mansfeld, H. Xiao, J. Electrochem. Soc. 141 (1994): p. 1,402. 35. F. Huet, J. Electrochem. Soc. 142 (1995): p. 2,861. 36. J.F. Chen, W.F. Bogaerts, Corros. Sci. 37 (1995): p. 1,839. 37. H. Xiao, F. Mansfeld, J. Electrochem. Soc. 141 (1994): p. 2,332 38. F. Mansfeld, H. Xiao, J. Electrochem. Soc. 140 (1993): p. 2,205 39. F. Mansfeld, L.T. Han, C.C. Lee, J. Electrochem. Soc. 143 (1996): p. L286. 40. U. Bertocci, C. Gabrielli, F. Huet, M. Keddam, J. Electrochem. Soc. 144 (1997): p. 31. 41. U. Bertocci, C. Gabrielli, F. Huet, M. Keddam, J. Electrochem. Soc. 144 (1997): p. 37. 42. A. Bautista, F. Huet, J. Electrochem. Soc. 146 (1999): p. 1,730- 1,736. 43. F. Mansfeld, M. Kendig, Corrosion 37, 9 (1981): p. 556. 44. R. Bandy, D.A. Jones, Corrosion 32 (1976): p. 126. 45. M.J. Danielson, Corrosion 36, 4 (1980): p. 174. 46. J.C. Reeve, G. Bech-Nielsen, Corros. Sci. 13 (1973): p. 351. 47. L.M. Callow, J.A. Richardson, J.L. Dawson, Brit. Corros. J. 11 (1976): p. 132. 48. F. Mansfeld, K.B. Oldham, Corros. Sci. 27 (1971): p. 434. 49. S. Barnartt, Corros. Sci. 9 (1969): p. 148. 50. R.L. Leroy, Corrosion 29 (1973): p. 272. 51. F. Mansfeld, Corrosion 29 (1973): p. 397. 52. D.D. MacDonald, J. Electrochem. Soc. 125 (1978): p. 1,443. 53. C. Gabrielli, M. Keddam, H. Takenouti, V. Kirk, F. Bourelier, Electrochem. Acta 24 (1979): p. 61. 54. D.W. Townley, Corrosion 47 (1991): p. 737. 55. D.D. Macdonald, J. Electrochem. Soc. 125 (1979): p. 1,977. 56. F. Mansfeld, M. Kendig, Corrosion 37 (1981): p. 545. 57. K. Videm, R. Myrdal, Corrosion 53 (1997): p. 734. 58. D.A. Jones, N.D. Greene, Corrosion 22 (1966): p. 198. 59. B. Syrett, D.D. MacDonald, Corrosion 35 (1979): p. 505. 60. I. Epelboin, M. Keddam, J. Electrochem. Soc. 117 (1970): p. 1,052-1,056. 61. I. Epelboin, M. Keddam, H. Takenouti, J. Appl. Electrochem. 2 (1972): p. 71-79. 62. J.O’M. Bockris, D. Drazic, A.R. Despic, Electrochim. Acta 4 (1961): p. 315. 63. E.J. Kelly, J. Electrochem. Soc. 126, 12 (1979): p. 2,064-2,075. 64. W.J. Lorenz, F. Mansfeld, Corros. Sci. 21, 9 (1981): p. 647-672. 65. H. Schweikert, W.J. Lorenz, H. Friedburg, J. Electrochem. Soc. 127 (1980): p. 1,693. 66. I. Epelboin, C. Gabrielli, M. Keddam, H. Takenouto, ASTM STP 727, “Electrochemical Corrosion Testing,” eds. F. Mansfeld, U. Bertocci, (West Conshohocken, PA: ASTM, 1981), p. 150-166. 67. R.N. Iyer, H.W. Pickering, J. Electrochem. Soc. 137, 11 (1990): p. 3,512-3,514. 68. C. Cato, H.J. Grabke, B. Egert, G. Panzer, Corros. Sci. 24 (1984): p. 591. 69. E.G. Dafft, K. Bohnenkamp, H.J. Engell, Corros. Sci. 19 (1979): p. 591. 70. R.N. Iyer, I. Takekeuchi, M. Zamanzadeh, H.W. Pickering, Cor- rosion 46 (1990): p. 460. 71. R.S. Lillard, J.R. Scully, Corrosion 52 (1996): p. 125. 72. K.E. Heusler, Habilitation Thesis, Univ. Of Stuttgart, 1966. 73. K.F. Bonhoeffer, K.E. Heusler, Z. Phys., Chem., N.F., 8 (1956): p. 390. 74. J. Newman, Electrochemical Systems (Englewood Cliffs, NJ: Prentice Hall, Inc., 1973). 75. C. Wagner, J. Electrochem. Soc. 101 (1959): p. 225. 76. W.C. Ehrhardt, ASTM STP 1056, “The Measurement and Cor- rection of Electrolyte Resistance in Electrochemical Cells,” eds. Scribner, Taylor (West Conshohocken, PA: ASTM, 1990), p. 5- 26. 77. K. Nisancioglu, Corrosion 43 (1987): p. 258. 78. M.A. Pech-Canul, A.A. Sagues, P. Castro, Corrosion 54, 8 (1998): p. 663. LIST OF SYMBOLS A = electrode area (cm2 ) B = proportionality constant used in Stern- Geary Equation C = capacitance (farad-cm–2 ) Cdl = double layer capacitance (farad-cm–2 ) C␾ = adsorption pseudo-capacitance (farad-cm–2 ) E = electrochemical potential (volts) Ecorr = corrosion potential (volts) Erev = reversible electrode potential (volts) F = Faraday’s constant (96,485 coul/equivalent) f = frequency (s–1 ) fmax = maximum frequency (s–1 ) iapp = applied current density (amp-cm–2 ) icorr = corrosion current density (amp-cm–2 ) Ia = anodic half-cell current (amp) Ic = cathodic half-cell current (amp) IPSD = power spectral density of current noise (amp2 -Hz–1 ) j = √-1 k = pre-exponential term defining Langmuir coverage q = charge (farads) qF = charge in adsorbed film (farads) qM = charge associated with one monolayer of film (farads) R = ideal gas constant (8.31441 J-mol–1 -K–1 ) Rs = solution resistance (Ω-cm2 ) Rct = charge-transfer reaction resistance (Ω-cm2 ) Reff = measured resistance at DC limit in case of nonuniform current distribution (Ω-cm2 ) RF = additional reaction resistance in the pres-
  • 20. 218 CORROSION–FEBRUARY 2000 CRITICAL REVIEW OF CORROSION SCIENCE AND ENGINEERING ence of an adsorbed intermediate that cre- ates additional resistance to charge transfer at the interphase (Ω-cm2 ) Rp = polarization resistance (Ω-cm2 ) RD = reaction resistance under mass transport control (Ω-cm2 ) Rd = diagonal resistance from E-iapp plot (Ω-cm2 ) Rapp = tangent resistance from E-iapp plot (Ω-cm2 ) Rn = noise resistance (Ω-cm2 ) Rsn(␻) = spectral noise resistance (Ω) s = diffusional impedance time factor, leff 2 /D (s) t = time (s) T = total time of measurement (s) T = temperature (K) Vn = potential noise VPDS = power spectral density of voltage noise (V2 -Hz–1 ) W = Wagner number (–) Z´(␻) = real component of impedance (Ω-cm2 ) Z´´(␻) = imaginary component of impedance (Ω-cm2 ) Z(␻) = complex impedance (Ω-cm2 ) |Z(␻)| = impedance modulus (Ω-cm2 ) ␣a = symmetry factor for anodic reaction (–) ␣c = symmetry factor for anodic reaction (–) ␤a = anodic Tafel slope (V/decade) ␤c = cathodic Tafel slope (V/decade) ␪ = surface coverage of adsorbed intermediate (–) ␾ = impedance phase angle (degrees) ␩ = overpotential (volts) ␴v = standard deviation of Vn – time record ␴I = standard deviation of current – time record ␻ = frequency (rad-s-1 ) 218 CORROSION–FEBRUARY 2000 CRITICAL REVIEW OF CORROSION SCIENCE AND ENGINEERING