Downloaded 18 times
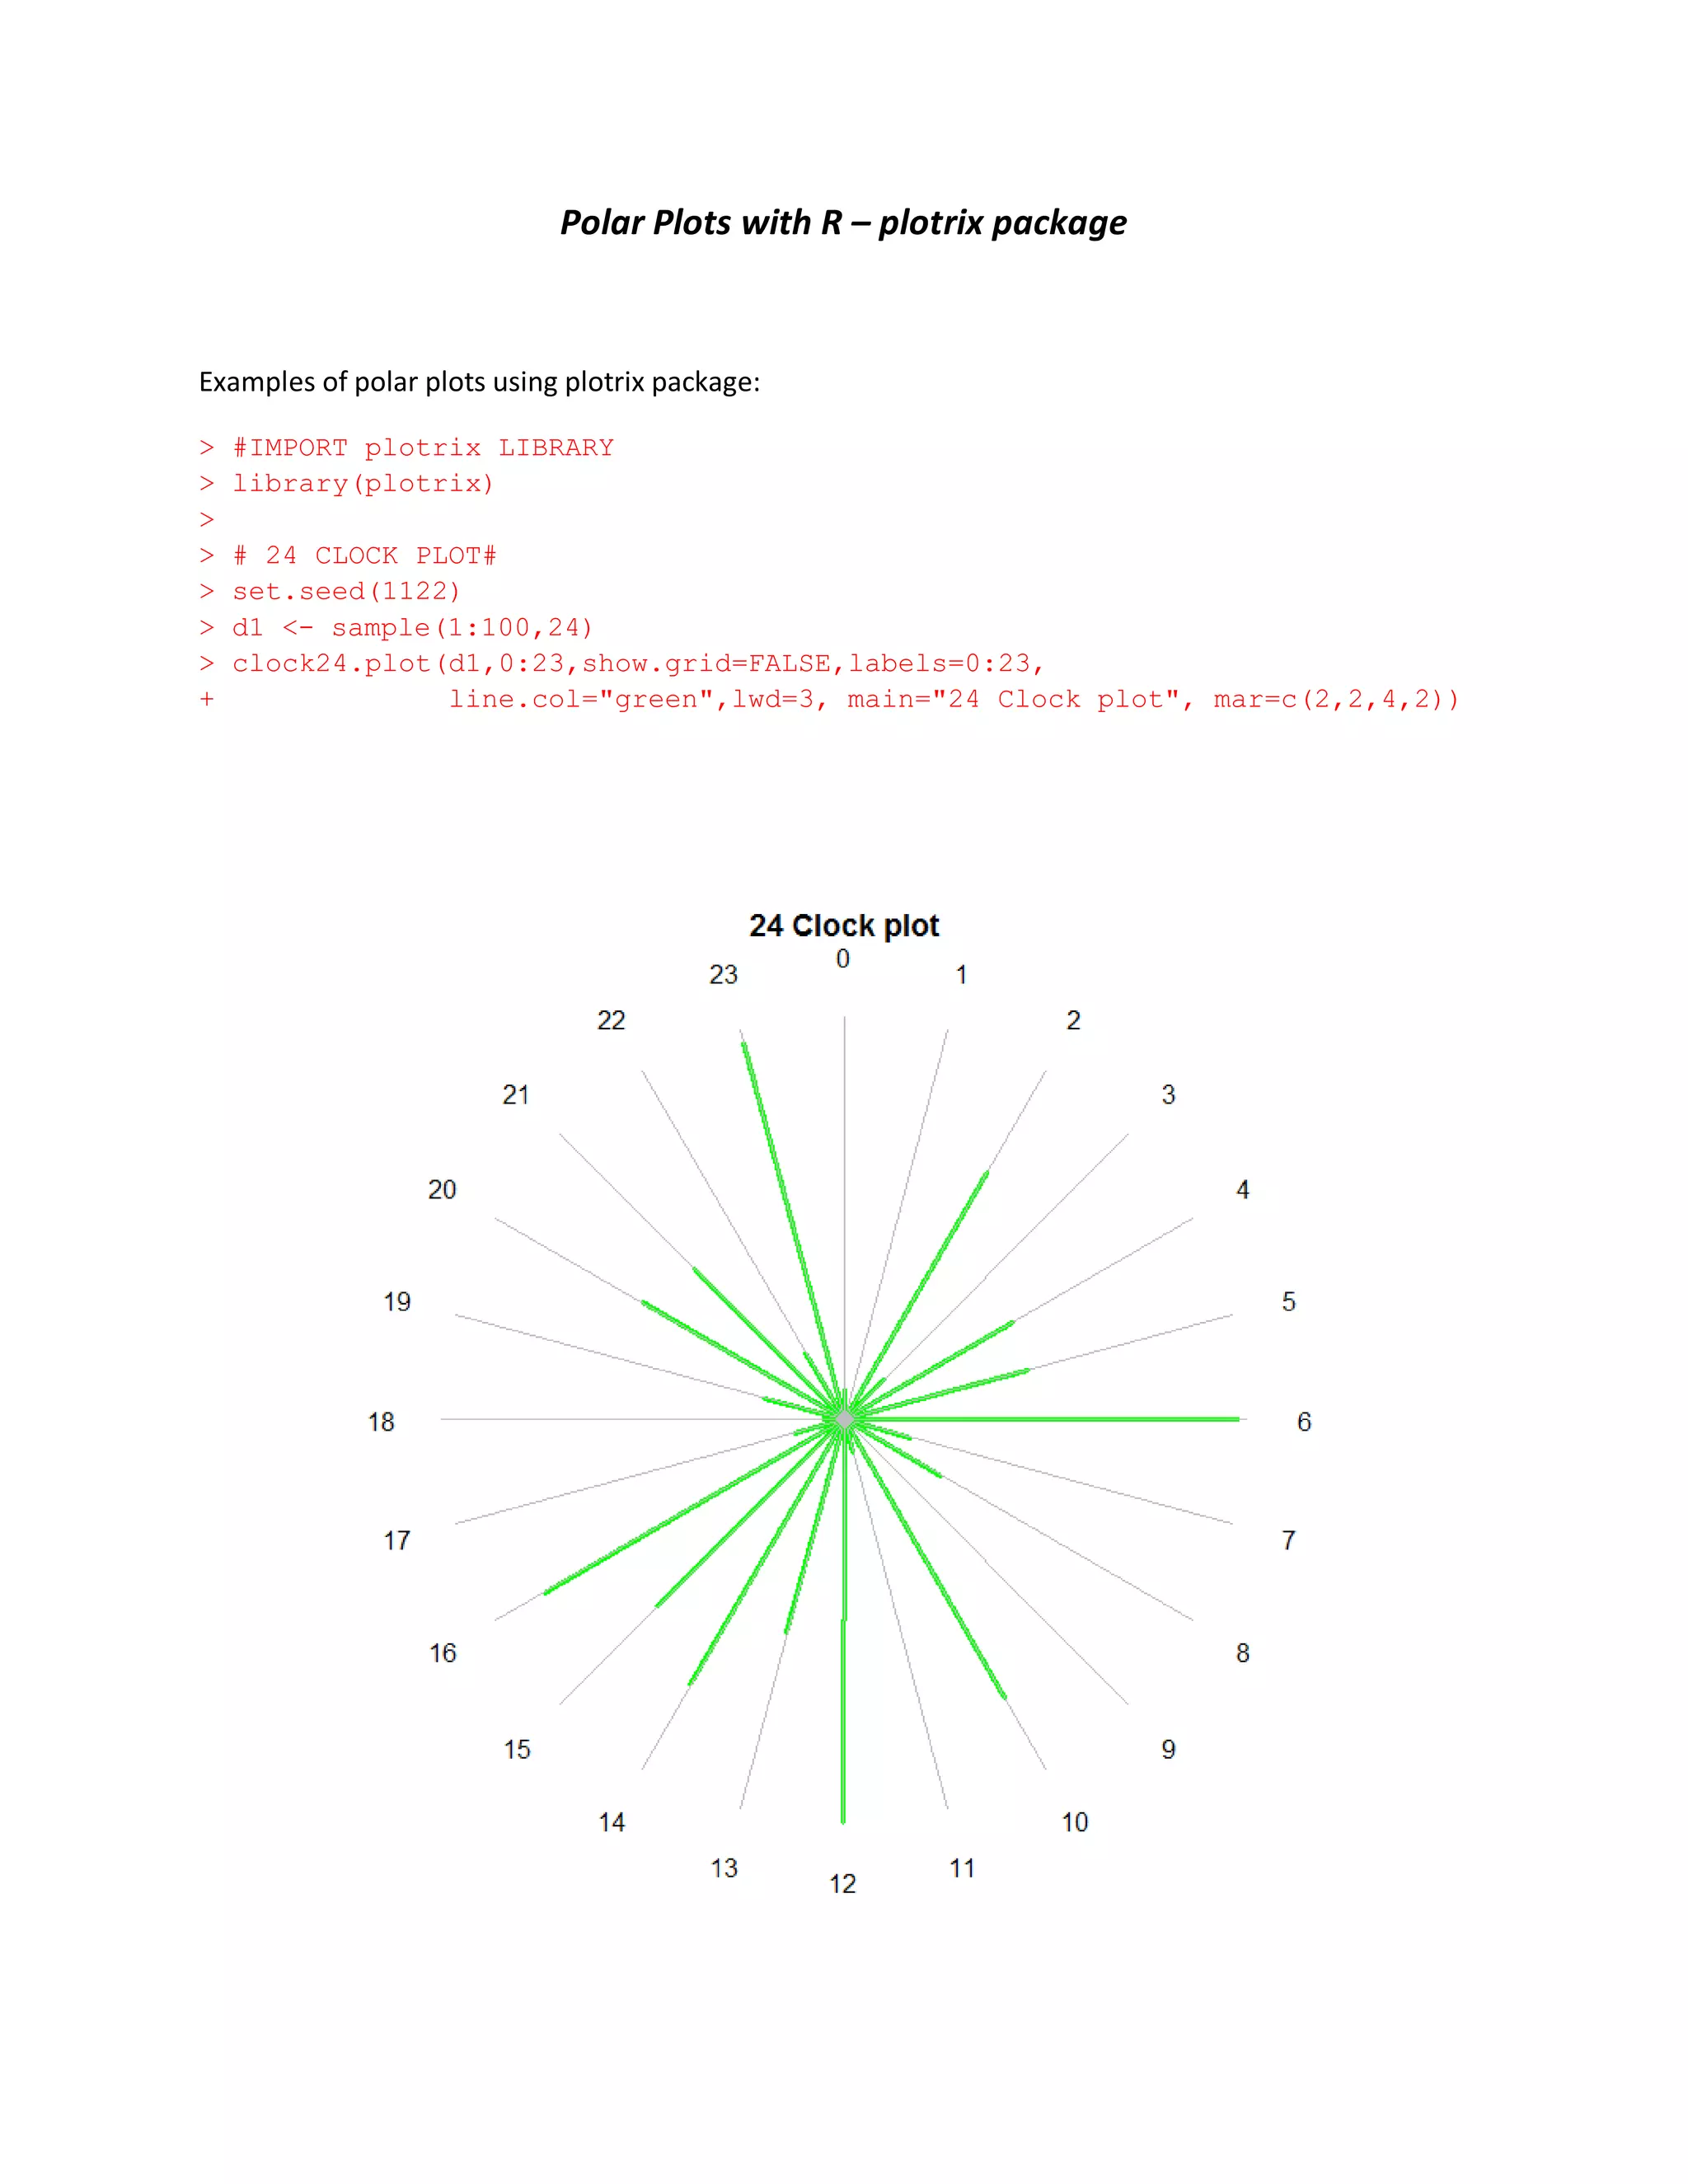
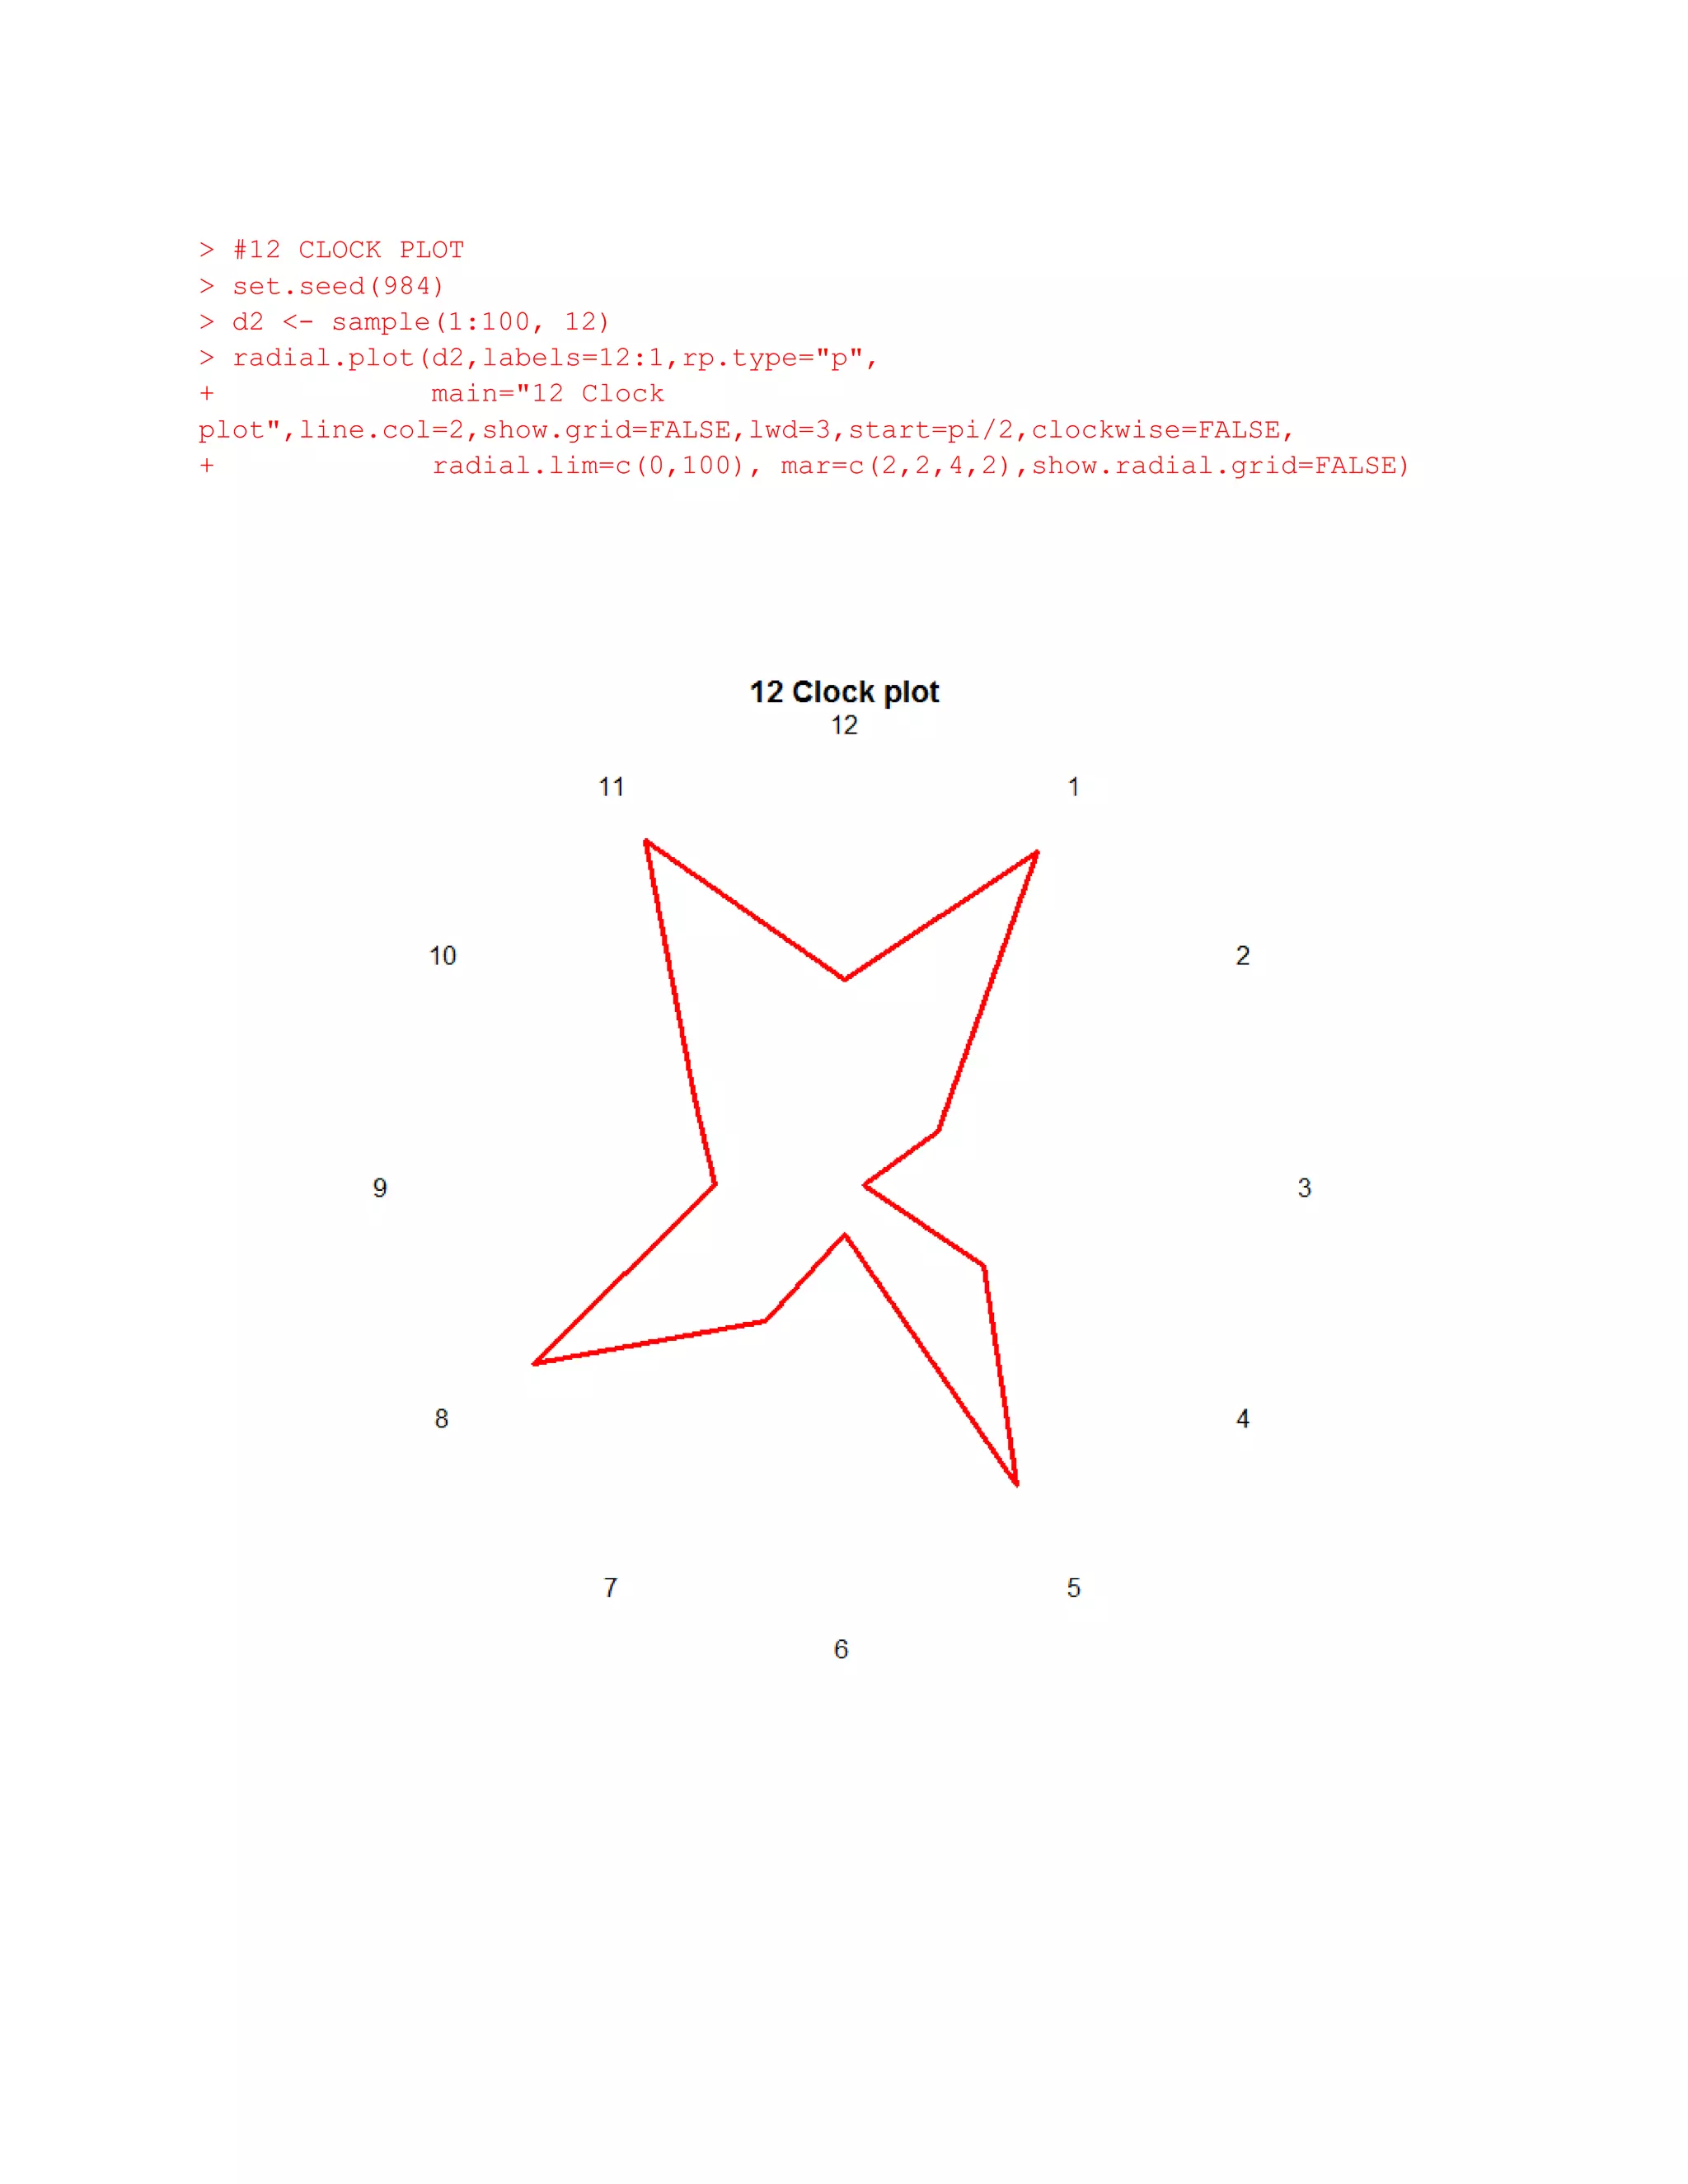
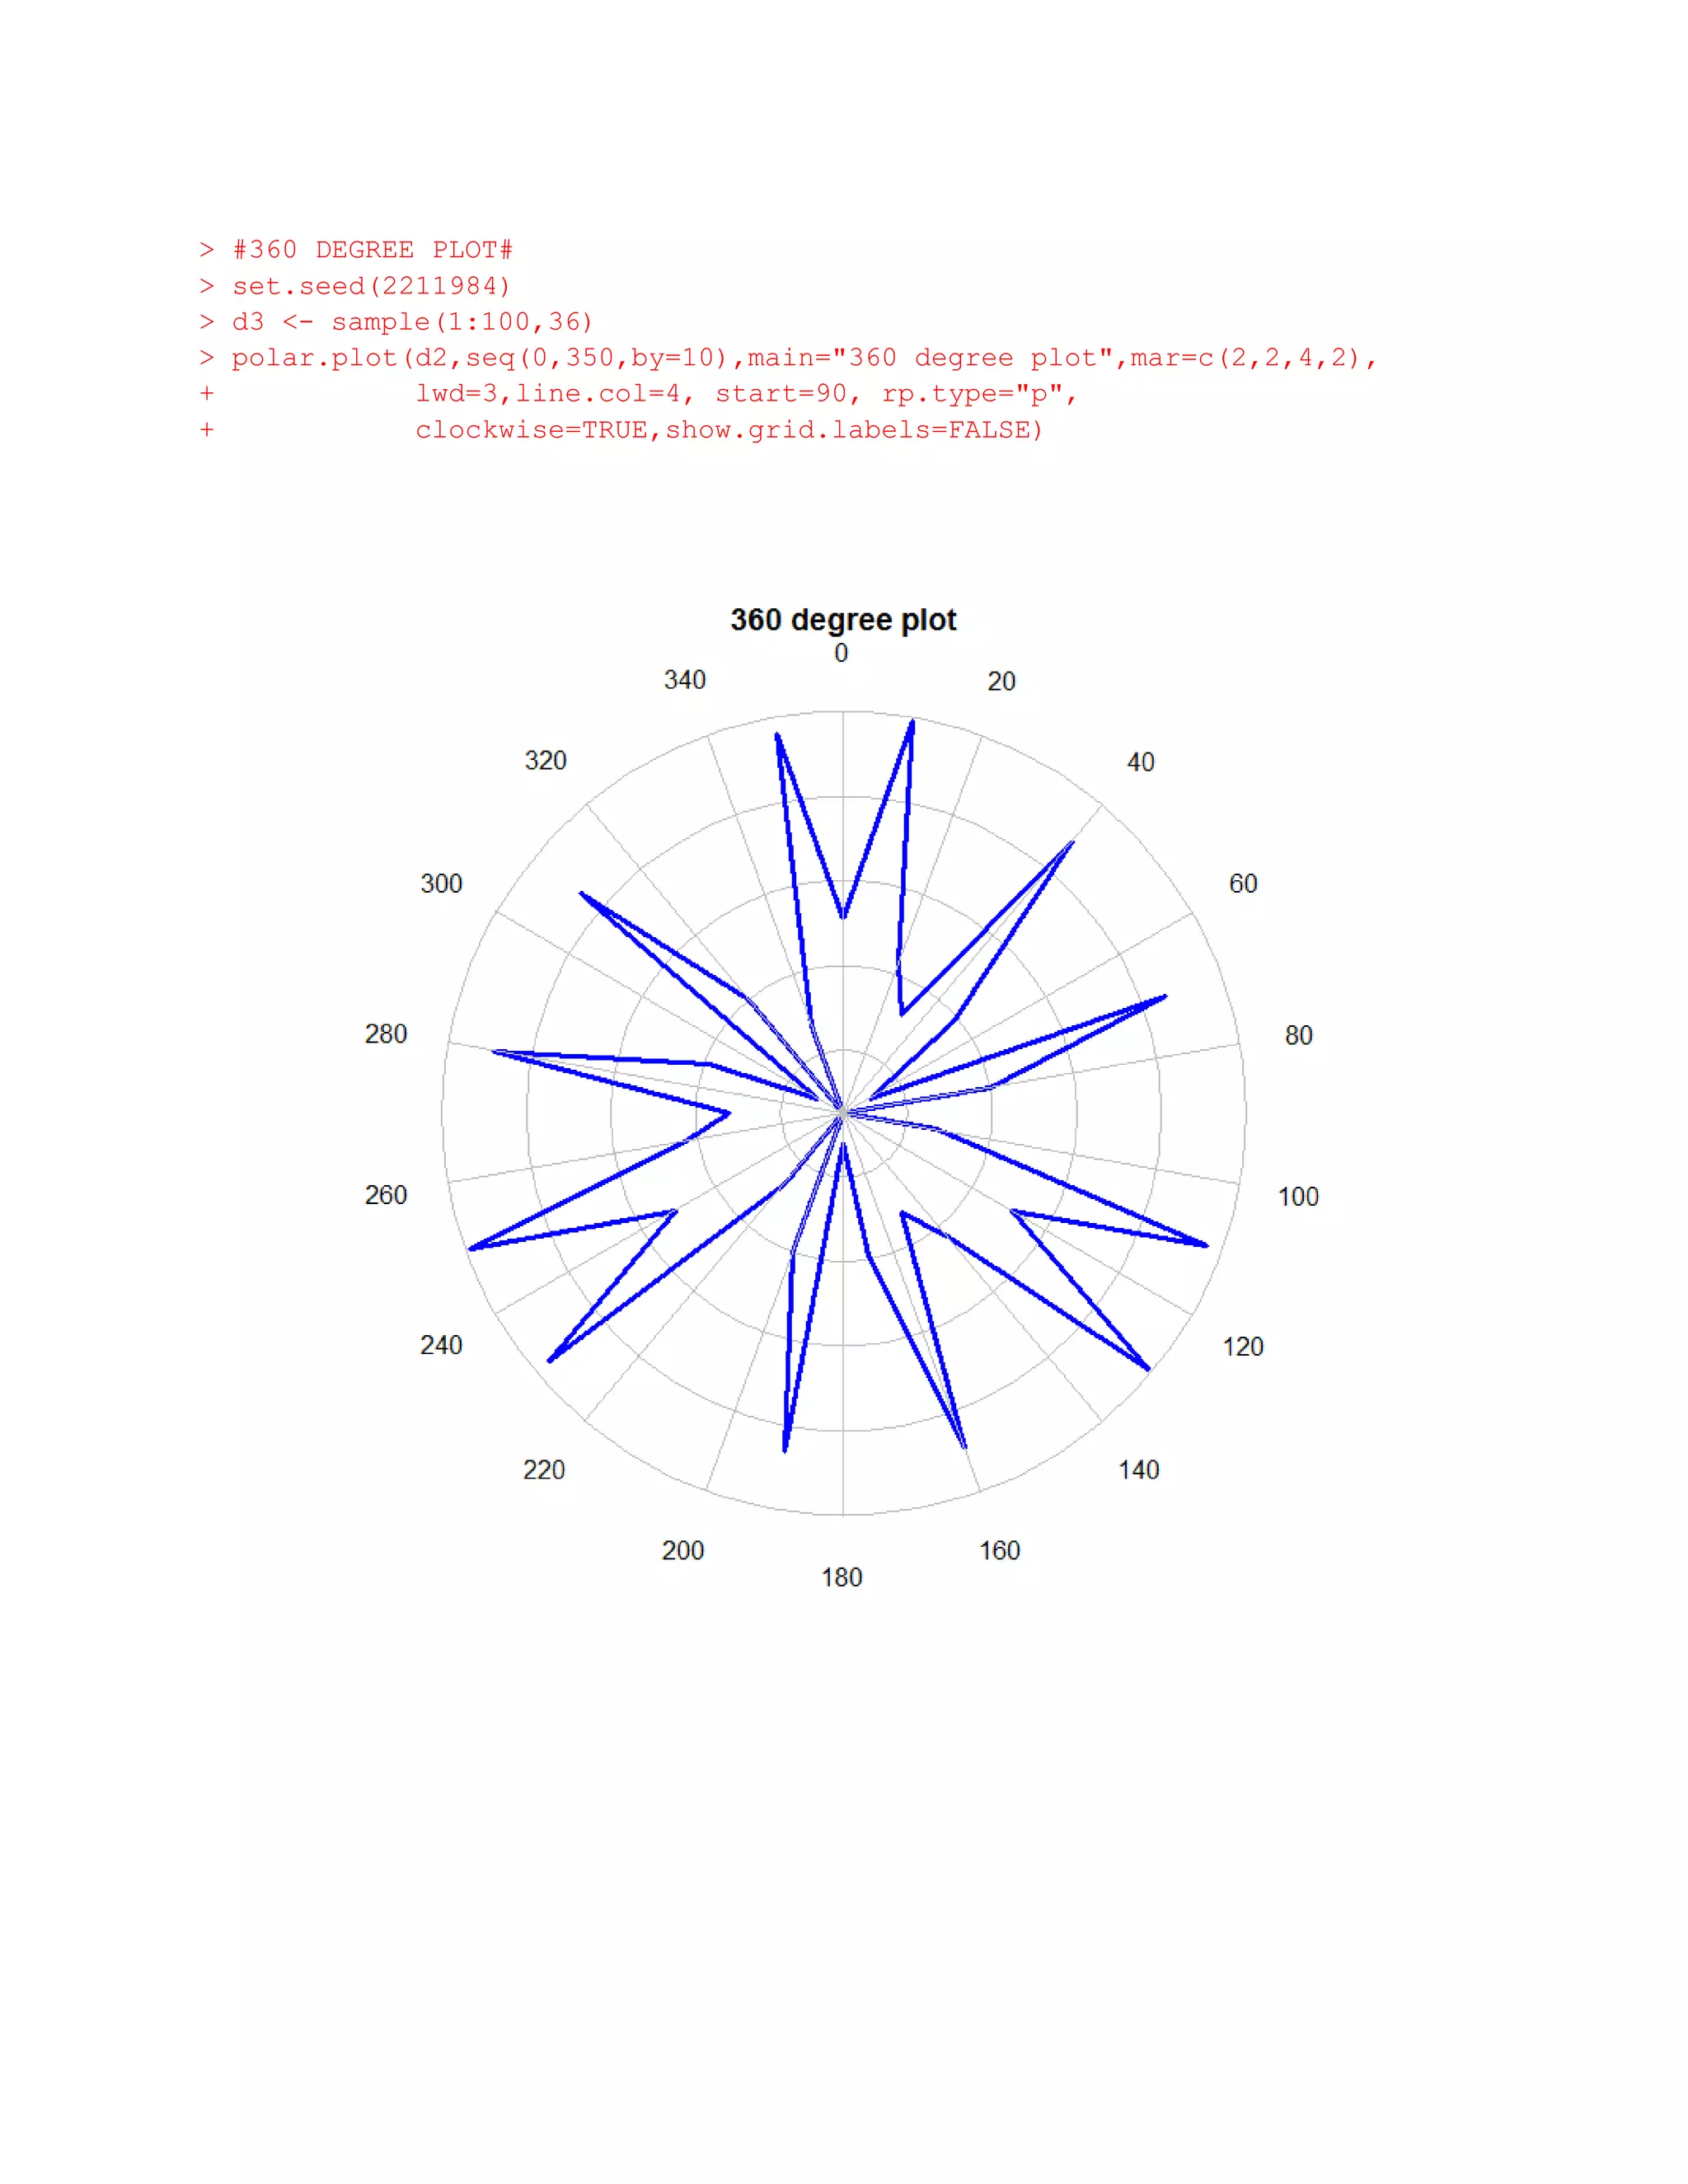

This document demonstrates how to create different types of polar plots using the plotrix package in R, including a 24 hour clock plot, 12 hour clock plot, and a 360 degree plot. Sample data is generated and each plot type is created by calling the appropriate plotrix function, specifying parameters like the data, angle labels, colors, and other graphical properties. The plotrix package provides functions for easily generating circular and polar plots of data in R.