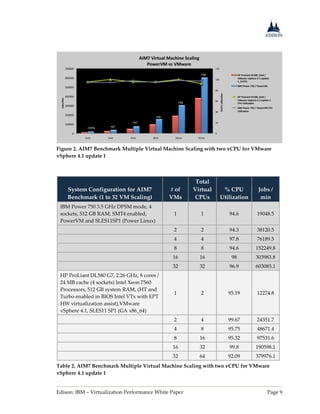
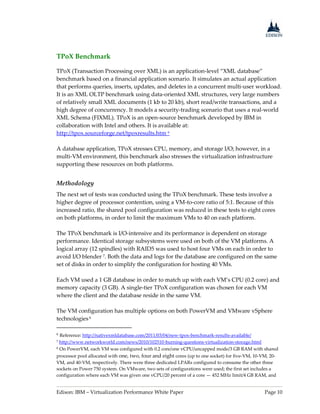
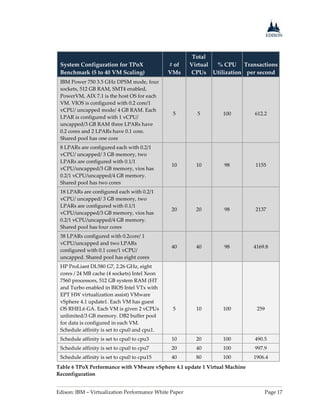
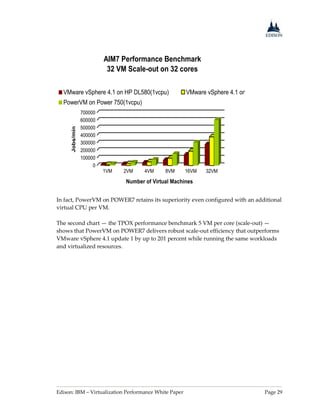
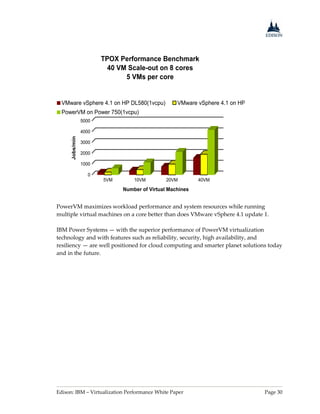
SlideShare a Scribd company logo
89 Fifth Avenue, 7th Floor
New York, NY 10003
www.TheEdison.com
212.367.7400
White Paper
IBM PowerVM Virtualization
Technology on IBM POWER7 Systems
A Comparison of PowerVM and
VMware vSphere (4.1 & 5.0)
Virtualization Performance
Printed in the United States of America
Copyright  2011 Edison Group, Inc. New York. Edison Group offers no warranty either
expressed or implied on the information contained herein and shall be held harmless for errors
resulting from its use.
All products are trademarks of their respective owners.
First Publication: September 2011; Second Publication: January, 2012
Produced by: Craig Norris, Sr Analyst; Barry Cohen, Editor-in-Chief; Manny Frishberg, Editor
This document was developed with IBM funding. Although the document may utilize publicly
available material from various vendors, including IBM, it does not necessarily reflect the
positions of such vendors on the issues addressed in this document.
Table of Contents
Executive Summary ..................................................................................................................... 1
Introduction .................................................................................................................................. 3
Objective .................................................................................................................................. 3
Audience.................................................................................................................................. 3
Contents of this Report.......................................................................................................... 3
The Business Value of Virtualization...................................................................................... 4
Benchmark Comparison Study: PowerVM vs. VMware...................................................... 6
AIM7 Benchmark.................................................................................................................... 6
TPoX Benchmark.................................................................................................................. 10
Summary of Results ............................................................................................................. 20
IBM’s Virtualization Infrastructure: POWER7 Systems .................................................... 21
PowerVM............................................................................................................................... 22
Processor Virtualization ...................................................................................................... 22
Memory Virtualization ........................................................................................................ 23
I/O Virtualization.................................................................................................................. 23
Partition Mobility ................................................................................................................. 23
Partition Hibernation........................................................................................................... 23
Workload Partitioning......................................................................................................... 24
Systems Management .......................................................................................................... 24
PowerVM Advantages......................................................................................................... 25
Conclusions................................................................................................................................. 28
Appendices.................................................................................................................................. 31
Appendix 1 — Benchmark Configuration Information ........................................................ 31
Appendix 2 — General Benchmark Descriptions .................................................................. 34
Addendum................................................................................................................................... 35
Edison: IBM – Virtualization Performance White Paper Page 1
Executive Summary
Today’s business organizations need to rein in IT costs without sacrificing performance,
security, reliability, and flexibility. A new era has emerged in which it is now possible,
through intelligent and strategic use of new and/or advanced technology, to achieve
breakthrough economics, considerably reducing the cost of delivering the workloads
central to a business’s operation.
IBM has aggressively been making pioneering strides in IT infrastructure, harnessing
trends and innovation to deliver top-notch functionality with great efficiency for
considerable data center savings. IBM's Smarter Computing initiative has helped many
forward-thinking organizations design, tune, and manage their IT infrastructures to
make them designed for data, tuned to the task, and managed in the cloud.
A cornerstone of this initiative is a move toward architectures optimized for specific
purposes and built around deep domain knowledge. The goals here are to reduce
deployment times for systems from months to days, improve performance with
utilization rates of up to 90 percent, and to reduce floor space, power consumption,
labor, and total cost per workload. The key technology advancement harnessed to
achieve these goals is server consolidation through virtualization.
Using virtualization to consolidate data center servers has become an integral
component of how successful companies design their IT systems. However, the majority
of businesses fall far short of realizing the full potential of server consolidation. On
average, consolidation ratios are only around six virtual machines (VMs) per physical
server. Even world-class organizations are only consolidating at a ratio of about 18 to 1
at best. Much higher VM densities are possible without degrading system performance,
significantly reducing data center consolidation expenses and yielding a considerable
economic advantage to organizations.
Under the banner of “Power is performance redefined,” IBM has introduced an
impressive profile of servers with the 2010 launch and 2011 release of Power Systems
servers and blades. These products are based on the IBM POWER7 processor
architecture, ranging from 2-socket to 32-socket with up to 256 cores.
To evaluate what IBM’s virtualization technology can offer clients, Edison Group was
engaged to help provide a clear understanding of the benefits that can be seen when
organizations implement virtualization technology as part of their IT environment. IBM
virtualization technologies support a server virtualization ratio of 1,000 to 1, outdoing
competitors and providing for massive data center consolidation. Clients using
Edison: IBM – Virtualization Performance White Paper Page 2
POWER7 systems and PowerVM virtualization technology achieve higher operational
savings by using greater VM density. Many of the advantages stem from the fact that
PowerVM technology is built directly into the firmware of all Power Systems servers.
The widely-deployed VMware vSphere and other x86-based virtualization products are
typically third-party software add-ons, sold and installed separately.
This technical white paper presents benchmark results showing greater VM
consolidation ratios than demonstrated in previous benchmarks and demonstrating the
extent of the performance lead that PowerVM virtualization technologies deliver over
x86-based add-on virtualization products. The tests, running two workload benchmarks
of different consolidation ratios on POWER7 processor-based and comparable Intel-
based systems, demonstrate the exceptional performance and scalability of PowerVM
virtualization technologies compared to VMware vSphere1 on an x86-based platform.
Key findings include the following:
 PowerVM technology on an IBM Power 750 system performs up to 131 percent
better than VMware vSphere in whole core configuration with a consolidation ratio
of 32 to 1.
 PowerVM on Power 750 outperforms VMware by up to 525 percent when running
multiple VMs and workloads, despite the test Intel x86 system (Westmere-EX)
containing a greater number of cores (40 versus 32).
 PowerVM technology on a 4-socket IBM Power 750 system demonstrated linear
scaling, with 50 percent more absolute throughput performance compared to
VMware vSphere.
 In terms of throughput performance, vSphere 5 demonstrated no improvement over
vSphere 4.1 update 1; in fact, it demonstrated slightly lower performance overall.
The benchmark results clearly reveal that PowerVM virtualization technology on
POWER7 processor-based platforms offers greater performance than that offered by
VMware vSphere on Intel x86 platforms. They enable high consolidation ratios, broader
scalability, and increased flexibility for a far superior virtualization solution. PowerVM
virtualization technology on POWER7 processor-based platforms not only uses system
resources in shared processor mode more efficiently, but also delivers superior
performance when resources are over-committed with a higher consolidation ratio.
Together they establish PowerVM virtualization technology as the consolidation system
of choice for organizations wishing to realize the full advantages of greater VM density.
1 For results of comparison benchmarks with VMware vSphere 5, see the Addendum to this study.
Edison: IBM – Virtualization Performance White Paper Page 3
Introduction
Objective
The objective of this white paper is to compare the performance of PowerVM
virtualization technologies on POWER7 processor-based server platforms against
VMware vSphere on comparable Intel x86 platforms. It describes tests using industry-
standard benchmarks to compare virtualization technologies. The results were
reviewed, analyzed, and presented by Edison Group.
Audience
This paper is intended for anyone interested in the advantages of server consolidation
through virtualization. IT managers, CIOs, system architects, and others will find
valuable information that will help them further enhance and adopt virtualization
technology within their IT environments.
Contents of this Report
This white paper contains the following major sections:
 The Business Value of Virtualization — This section discusses the business value
propositions underlying the benchmark evaluations presented in this paper.
 Benchmark Comparison Study: PowerVM Virtualization Technology vs. VMware
vSphere 4.1 update 1 — This section presents the comparative testing, describing the
test bed setup, the benchmarks, the actual tests, and the results of the tests.
 IBM’s Virtualization Infrastructure: POWER7 Processor-Based Systems — This
section describes the Power Systems virtualization infrastructure, its components,
and its advantages.
 Appendices — The appendices contain configuration information and general
descriptions for the benchmarks used in the tests discussed in this paper
 Addendum — Benchmark Comparison Study: PowerVM Virtualization
Technology vs. VMware vSphere 5 — This section presents the comparative results
with VMware vSphere 5 on an HP ProLiant DL580 G7 E7-4870 server — which
features the X5600-series Xeon (Westmere-EX) chip architecture.
Edison: IBM – Virtualization Performance White Paper Page 4
The Business Value of Virtualization
Inefficiencies have cropped up in data center operations as applications, workloads, and
data have multiplied. These include: underutilization of server processor capacity,
memory bottlenecks that restrict performance, server sprawl and its related difficulties
in deployment and management, as well as higher energy bills from excessive power
demands. Such inefficiencies increase costs, both through expenditures for equipment
purchases and licensing, as well as through greater demands on administrative staff
resources, etc.
Virtualization technologies allow IT organizations to consolidate workloads running on
multiple operating systems and software stacks, and to dynamically allocate platform
resources to meet specific business and application requirements. Server virtualization,
the foundation platform for today’s data center, is quickly reaching maturity. More than
half of business server workloads are now deployed on virtual machines. According to
IDC, 2 virtualization has become the default build for new server installations, driving
down costs and establishing the foundation for more efficient and flexible configurations
and technology platforms. The average size of virtualized workloads increased threefold
between 2006 and 2009. The performance of virtualization is a critical factor to realize
success of server pools and cloud computing (and is also a key component in IBM’s
roadmap in its Smarter Computing initiative).
Well-implemented virtualization solutions may be employed to:
 Reduce hardware expenditures by consolidating multiple environments, including
underutilized servers, and systems with varied and dynamic resource requirements.
 Reduce costs for power and cooling, floor space, hardware maintenance, and
software licensing.
 Grow and shrink resources dynamically according to business needs.
 Deploy new workloads through provisioning VMs or new systems rapidly to meet
changing business demands.
 Develop and test applications in secure, independent domains while allocating
production to its own domain on the same system.
 Transfer live workloads to support server migrations, balance system load, or avoid
planned downtime that can otherwise adversely impact productivity.
 Control server sprawl, reducing system management costs.
2 The Value of Memory-Dense Servers: IBM’s System x MAX5 for its eX5 Server Family, March 2010, IDC
Edison: IBM – Virtualization Performance White Paper Page 5
Despite this, the majority of businesses fall far short of seizing upon the full potential of
server consolidation. Their average consolidation ratio hovers around six VMs per
server,3 yet economic advantages from data center consolidation increase significantly at
much higher VM densities. By increasing the consolidation ratio per system, businesses
can reduce capital expenditures and operational costs by reducing the number of
systems in their data center or IT organization.
IBM’s Smarter Computing systems, which allow for greater VM density without
degrading system performance, can deliver considerable economic advantages to
organizations using them. This study examines the performance and scaling aspects of
PowerVM and VMware vSphere virtualization at high consolidation ratios (32:1 and
40:1) across two different commonly employed industry benchmarks (AIM7 and TpoX).
The case of 40:1 consolidation ratio — “five virtual machines per core”— was mapped to
achieve a higher amount of compression than the client deployment consolidation ratio
surveyed in 2010.4
3 According to a recent Aberdeen Group report, Best-in-Class Practices for Virtualizing Microsoft Applications,
August 2010, even the best-in-class organizations in the study consolidate at only an 18:1 ratio.
4 http://www.networkworld.com/news/2010/121510-vmware-server.html
Edison: IBM – Virtualization Performance White Paper Page 6
Benchmark Comparison Study:
PowerVM vs. VMware vSphere 4.1 update 1
AIM7 Benchmark
AIM7 is a well-known open source benchmark. It is widely used by UNIX computer
system vendors to compare system performance. It comprises three pre-defined tests
suites (compute, multi-user, and database). Each suite is a mix of compute-, memory-
and I/O-intensive atomic tests covering a wide range of operations. AIM7 also stresses
the guest operating system’s kernel performance within virtualized environments. The
testing described in this paper used the compute server test suite.
Methodology
For AIM7 scaling tests, all 32 available cores were used to scale from one to 32 virtual
machines on both platforms. The Power Linux version used on PowerVM virtualization
technology was SuSE 11 SP1, while SuSE 11 SP1 x86_64 version was used as guest OS on
VMware vSphere 4.1 update 1. (Configuration details of the tests are in the appendices.)
Results
AIM7 was scaled in one, two, four, eight, 16, and 32 virtual machines (each virtual
machine having one virtual processor). Scaling was close to linear on both the POWER7
processor-/PowerVM technology-based systems and the Intel/VMware vSphere 4.1
update 1 platforms. The tests were run at close to 100 percent utilization to measure the
absolute performance of AIM7 in each VM configuration.
POWER7 processor-/PowerVM technology-based systems demonstrated more than two
times (110 percent) better performance than Intel/VMware vSphere 4.1 update 1 at one,
two, four, eight, and 16 VM configurations, while at 32 VM, PowerVM technology
demonstrated a 115 percent advantage (Figure 1).
NOTE: The VM configuration and the test results can be found in the tables
following the graphs for each test in this paper, starting with Figure 1.
Table 1 shows the details on throughput and CPU utilization for each configuration. In
this test, the VMs on both platforms were configured as close to identically as possible.
In the case of PowerVM, each logical partitioning (LPAR) was given one core
entitlement, one vCPU (virtual CPU), and 3 GB RAM; in the case of VMware vSphere 4.1
Edison: IBM – Virtualization Performance White Paper Page 7
update 1, each VM was given one vCPU and 3 GB RAM, with the remainder left at
default options.
Figure 1. AIM7 Benchmark Virtual Machine Scaling Performance
System Configuration for AIM7
Benchmark (1 to 32 VM Scaling)
# of
VMs
Total
Virtual
CPUs
% CPU
Utilization Jobs / min
IBM Power 750 3.5 GHz DPSM mode, 4
sockets, 512 GB RAM, SMT4 enabled,
PowerVM and SLES11 SP1 (Power Linux)
1 1 94.6 19048.5
2 2 94.3 38120.5
4 4 97.8 76189.5
8 8 94.6 152249.8
16 16 98 303983.8
32 32 96.9 603085.1
HP ProLiant DL580 G7, 2.26 GHz, 8 cores /
24 MB cache (4 sockets Intel Xeon 7560
Processors, 512 GB system RAM, (HT and
Turbo enabled in BIOS Intel VTx with EPT
HW virtualization assist) VMware
vSphere 4.1, SLES11 SP1 (GA x86_64)
1 1 100 9068.6
2 2 99.89 18137.2
4 4 94.15 36180.1
8 8 100 72398.3
16 16 92.5 144365.4
32 32 95.2 280726.8
Table 1. AIM7 Benchmark Multiple Virtual Machine Scaling Results
Edison: IBM – Virtualization Performance White Paper Page 8
PowerVM and VMware vSphere technologies differ in the way they map a physical
processor to a virtual processor. PowerVM virtualization technology maps all four
threads of a core (SMT4, introduced with POWER7 processor-based systems) to a virtual
processor. So, PowerVM technology leveraged POWER7 SMT4 technology with one
vCPU configuration. VMware vSphere maps one of the two threads of a core (Intel’s HT
technology) to a virtual processor. Therefore, VMware vSphere 4.1 update 1 was not
able to leverage Intel’s HT technology with one vCPU configuration per VM.
The tests on VMware vSphere 4.1 update 1 were thus repeated with two vCPU per VM
configuration in order to observe performance with two threads running on a core.
Because the VMware vSphere 4.1 update 1 VM was reconfigured to have two virtual
processors, the test team wished to ensure that each VM was assigned a core to match
with PowerVM technology. So, CPU affinity was used to assign two threads (the
primary and secondary thread of a core) to two virtual processors of each VM.5 This set
of tests was a fair comparison with PowerVM test results, since it allowed the workload
to consume all the capacity of the system in a manner similar to POWER/PowerVM
technology. The results of the second test are shown below (Figure 2).
The second test results with two vCPU reveal that results for the Intel Xeon processor
running VMware vSphere 4.1 update 1 had improved, but still lagged behind
POWER/PowerVM results. In each of the tests, PowerVM technology still demonstrated
up to 59 percent higher throughput performance than Intel 7560 /VMware vSphere 4.1
update 1, at close to 100 percent utilization.
Power 750/PowerVM technology demonstrated higher AIM7 throughput performance
than the HP system with Intel 7560 processor using VMware technologies. Many factors
contributed to this superior performance, including: PowerVM technology efficiency,
IBM POWER7 SMT4 technology, and IBM POWER7 processor core frequency
(specifically, the fact that IBM POWER7 technology supports higher frequency with the
same processor capacity than does Intel Xeon technology).
5 That is, one vCPU of a VM was assigned to an even number logical processor, and a second vCPU of a VM
was assigned to an odd number logical processor. For example, the first vCPU of the first VM was assigned
to logical cpu0, and the second vCPU of the first VM was assigned to logical cpu1, so that all the primary
and secondary threads of cores were consumed by the workload running on that VM.
Edison: IBM – Virtualization Performance White Paper Page 9
Figure 2. AIM7 Benchmark Multiple Virtual Machine Scaling with two vCPU for VMware
vSphere 4.1 update 1
System Configuration for AIM7
Benchmark (1 to 32 VM Scaling)
# of
VMs
Total
Virtual
CPUs
% CPU
Utilization
Jobs /
min
IBM Power 750 3.5 GHz DPSM mode, 4
sockets, 512 GB RAM, SMT4 enabled,
PowerVM and SLES11SP1 (Power Linux)
1 1 94.6 19048.5
2 2 94.3 38120.5
4 4 97.8 76189.5
8 8 94.6 152249.8
16 16 98 303983.8
32 32 96.9 603085.1
HP ProLiant DL580 G7, 2.26 GHz, 8 cores /
24 MB cache (4 sockets) Intel Xeon 7560
Processors, 512 GB system RAM, (HT and
Turbo enabled in BIOS Intel VTx with EPT
HW virtualization assist),VMware
vSphere 4.1, SLES11 SP1 (GA x86_64)
1 2 95.19 12274.8
2 4 99.67 24351.7
4 8 95.75 48671.4
8 16 95.32 97531.6
16 32 99.8 190598.1
32 64 92.09 379976.1
Table 2. AIM7 Benchmark Multiple Virtual Machine Scaling with two vCPU for VMware
vSphere 4.1 update 1
Edison: IBM – Virtualization Performance White Paper Page 10
TPoX Benchmark
TPoX (Transaction Processing over XML) is an application-level “XML database”
benchmark based on a financial application scenario. It simulates an actual application
that performs queries, inserts, updates, and deletes in a concurrent multi-user workload.
It is an XML OLTP benchmark using data-oriented XML structures, very large numbers
of relatively small XML documents (1 kb to 20 kb), short read/write transactions, and a
high degree of concurrency. It models a security-trading scenario that uses a real-world
XML Schema (FIXML). TPoX is an open-source benchmark developed by IBM in
collaboration with Intel and others. It is available at:
http://tpox.sourceforge.net/tpoxresults.htm 6
A database application, TPoX stresses CPU, memory, and storage I/O; however, in a
multi-VM environment, this benchmark also stresses the virtualization infrastructure
supporting these resources on both platforms.
Methodology
The next set of tests was conducted using the TPoX benchmark. These tests involve a
higher degree of processor contention, using a VM-to-core ratio of 5:1. Because of this
increased ratio, the shared pool configuration was reduced in these tests to eight cores
on both platforms, in order to limit the maximum VMs to 40 on each platform.
The TPoX benchmark is I/O-intensive and its performance is dependent on storage
performance. Identical storage subsystems were used on both of the VM platforms. A
logical array (12 spindles) with RAID5 was used to host four VMs on each in order to
avoid I/O blender 7. Both the data and logs for the database are configured on the same
set of disks in order to simplify the configuration for hosting 40 VMs.
Each VM used a 1 GB database in order to match up with each VM’s CPU (0.2 core) and
memory capacity (3 GB). A single-tier TPoX configuration was chosen for each VM
where the client and the database reside in the same VM.
The VM configuration has multiple options on both PowerVM and VMware vSphere
technologies8
6 Reference: http://nativexmldatabase.com/2011/03/04/new-tpox-benchmark-results-available/
7 http://www.networkworld.com/news/2010/102510-burning-questions-virtualization-storage.html
8 On PowerVM, each VM was configured with 0.2 core/one vCPU/uncapped mode/3 GB RAM with shared
processor pool allocated with one, two, four and eight cores (up to one socket) for five-VM, 10-VM, 20-
VM, and 40-VM, respectively. There were three dedicated LPARs configured to consume the other three
sockets on Power 750 system. On VMware, two sets of configurations were used; the first set includes a
configuration where each VM was given one vCPU/20 percent of a core — 452 MHz limit/4 GB RAM, and
Edison: IBM – Virtualization Performance White Paper Page 11
Results
The database for each VM on each of the platforms was populated with the same
configuration set. The transaction rate for populating the database is shown in Table 3.
Power
750/PowerVM
HP DL580G7/ VMware
vSphere 4.1 update 1 1vCPU
Order (inserts per second) 1,591 746
Custacc (inserts per second) 684 271
Table 3. TPoX Database Populated Rate for First Configuration Set
As these results indicate, the performance rate for populating the database is two to two-
and-a-half times better for POWER/PowerVM technology than with Intel Xeon 7560
/VMware vSphere 4.1 update 1. Figure 3, below, presents results demonstrating that the
transactions throughput performance on POWER/PowerVM technology is as much as
three times better than Intel Xeon 7560 /VMware vSphere 4.1 update 1. 9
Figure 3. TPoX Benchmark Results in 40:1 Consolidation Ratio
Table 4 presents detailed information on the total number of TPoX users used in each
test, pool utilization, throughput, and VM configuration for each tests.
advanced shared panel settings that included 1) hyperthread core sharing and, 2) scheduling affinity set to
0-15 (logical processors). The idea was to run five VMs on a single core; with five vCPUs the entire core
should be utilized in hyperthreading mode.
9 Because processor utilization in the first VMware configuration set made it harder to report total
percentage, in this case pool utilization was used. With a single virtual processor per VM, it would not be
realistic to map to either a primary or secondary thread per VM. For example, in the five-VM test, where the
goal was to use 20 percent of a core, binding a VM could be done either to a primary or to a secondary
thread, in which case some VMs would be running on primary and others would running on secondary.
Thus, the decision was made to use the pool to assign cpu0 to cpu15 for all the tests. At a lower number of
VMs, VMware used around 20 percent from each of the cores in the pool; at 40 VMs the pool utilization
matched with PowerVM as it is shown in Figure 3.
Edison: IBM – Virtualization Performance White Paper Page 12
System Configuration for TPoX
Benchmark (1 to 40 VM Scaling)
# of
VMs
Total
Virtual
CPUs
Total # of
TPoX
Users
% Pool
Utilization
Transactions
per second
IBM Power 750 3.5 GHz DPSM mode, 4
sockets, 512 GB RAM, SMT4 enabled,
PowerVM, AIX 7.1 is the host OS for
each VM. VIOS is configured with 0.2
core/1 vCPU/ uncapped mode/ 4 GB
RAM. Each LPAR is configured with 1
vCPU/ uncapped/3 GB RAM 3 LPARs
have 0.2 cores and 2 LPARs have 0.1
core Shared pool has one core
5 5 50 12.5 612.2
8 LPARs are configured each with 0.2/1
vCPU/ uncapped/ 3 GB memory, 2
LPARs are configured with 0.1/1
vCPU/uncapped/3 GB memory, vios
has 0.2/1 vCPU/uncapped/4 GB
memory. Shared pool has two cores
10 10 100 24.5 1155
18 LPARs are configured each with
0.2/1 vCPU/ uncapped/ 3 GB memory,
2 LPARs are configured with 0.1/1
vCPU/uncapped/3 GB memory, vios
has 0.2/1 vCPU/uncapped/4 GB
memory. Shared pool has four cores
20 20 200 49 2137
38 LPARs configured with 0.2core/
1vCPU/uncapped and 2 LPARs
configured with 0.1core/1vCPU/
uncapped. Shared pool has eight cores
40 40 400 98 4169.8
HP ProLiant DL580 G7, 2.26 GHz, eight
cores / 24 MB cache (4 sockets) Intel
Xeon 7560 Processors, 512 GB system
RAM (HT and Turbo enabled in BIOS
Intel VTx with EPT HW virtualization
assist) VMware vSphere 4.1 update1.
Each VM has guest OS RHEL6 GA.
Each VM is given 0.2 of a core/1
vCPU/3 GB memory. DB2 buffer pool
for data is configured in each VM.
Schedule affinity is set to cpu0 and
cpu1.
5 5 50 21.8 203.18
Schedule affinity is set to cpu0 to cpu3 10 10 100 33.89 397.15
Schedule affinity is set to cpu0 to cpu7 20 20 200 56.62 760.52
Schedule affinity is set to cpu0 to cpu15 40 40 400 97.26 1571.27
Table 4. TPoX Benchmark Results
Edison: IBM – Virtualization Performance White Paper Page 13
Figures 4A and 4B depict the response time for each transaction type — query, update,
delete, and insert — for each test on both platforms.
Figure 4A. TPoX Query and Update Response Time
Edison: IBM – Virtualization Performance White Paper Page 14
Figure 4B. TPoX Delete and Insert Response Time
As shown in Figure 4A and 4B (above), the response time on VMware vSphere 4.1
update 1 was two to six times higher, compared to PowerVM virtualization technology,
as the number of VMs scaled from five to 40 VMs. The pool utilization was higher as
well, while throughput was lower on VMware vSphere 4.1 update 1 than on PowerVM
technology. Even though hyper threading (HT) technology was leveraged in this test,
VMware vSphere 4.1 update 1 performance remained one-third of that demonstrated by
PowerVM technology.
Edison: IBM – Virtualization Performance White Paper Page 15
# of
VMs
Total
Virtual
CPUs
Avg
query
rsp
(sec)
Avg
update
rsp
(sec)
Avg
delete
rsp
(sec)
Avg
insert
rsp
(sec)
IBM Power 750 3.5 GHz DPSM mode,
four sockets, 512 GB RAM, SMT4
enabled, PowerVM, AIX 7.1 is the host
OS for each VM. VIOS is configured
with 0.2 core/1 vCPU/ uncapped mode/
4 GB RAM. Each LPAR is configured
with 1 vCPU/ uncapped/3 GB RAM 3
LPARs have 0.2 cores and 2 LPARs have
0.1 core. Shared pool has one core
5 5 0.09 0.08 0.03 0.05
8 LPARs are configured each with 0.2/1
vCPU/ uncapped/ 3 GB memory, two
LPARs are configured with 0.1/1
vCPU/uncapped/3 GB memory, vios has
0.2/1 vCPU/uncapped/4 GB memory.
Shared pool has two cores
10 10 0.09 0.08 0.04 0.06
18 LPARs are configured each with 0.2/1
vCPU/ uncapped/ 3 GB memory, two
LPARs are configured with 0.1/1
vCPU/uncapped/3 GB memory, vios has
0.2/1 vCPU/uncapped/4 GB memory.
Shared pool has four cores
20 20 0.1 0.1 0.06 0.07
38 LPARs configured with 0.2core/ one
vCPU/uncapped and two LPARs
configured with 0.1core/1 vCPU/
uncapped. Shared pool has eight cores
40 40 0.1 0.15 0.1 0.12
HP ProLiant DL580 G7, 2.26 GHz, eight
cores / 24 MB cache (four sockets) Intel
Xeon 7560 Processors, 512 GB system
RAM (HT and Turbo enabled in BIOS
Intel VTx with EPT HW virtualization
assist) VMware vSphere 4.1 update1.
Each VM has guest OS RHEL6 GA. Each
VM is given 0.2 of a core/1 vCPU/3 GB
memory. DB2 buffer pool for data is
configured in each VM. Schedule
affinity is set to cpu0 and cpu1.
5 5 0.22 0.33 0.205 0.26
Schedule affinity is set to cpu0 to cpu3 10 10 0.22 0.376 0.26 0.3
Schedule affinity is set to cpu0 to cpu7 20 20 0.22 0.39 0.275 0.315
Schedule affinity is set to cpu0 to cpu15 40 40 0.24 0.348 0.18 0.265
Table 5. TPoX Response Time for Each Transaction Type
Edison: IBM – Virtualization Performance White Paper Page 16
Power 750/PowerVM
HP DL580G7/ VMware
vSphere 2vCPU
Order (inserts per second) 1591 1176
Custacc (inserts per second) 684 333
Table 5A. TPoX Database Populated Rate for Second Set (2 vCPU) of Configuration
A second configuration set on VMware vSphere 4.1 update 1 was added in order to
restrict the VMs to run within the core, similar to the PowerVM virtualization
configuration.10 Again, the database of each VM in this new configuration on VMware
vSphere 4.1 update 1 was populated. The transaction rate for populating the database is
shown in Table 5A. The results of this set of tests were compared with results for
PowerVM technology, as shown in Figures 6, A and B.
POWER/PowerVM still retained 2.3 times better performance than HP Intel/VMware
vSphere 4.1 update 1 technologies, even with reconfiguration using CPU affinity
(VMware Scheduling Affinity group) on VMware vSphere 4.1 update 1. CPU utilization
on both platforms remained close to identical.
Figure 5. TPoX Performances with VMware vSphere 4.1 update 1 Virtual Machine
Reconfiguration
10 In this set each virtual machine was configured to have two vCPUs, using the CPU affinity feature in
VMware; the first vCPU was bound to the primary thread while the second vCPU of a VM was bound to
secondary thread of a core. For the five-VM test, all 10 vCPUs were bound to one core (both primary and the
secondary thread); for the 10-VM test, all 20 vCPUs were bound to two cores; for the 20-VM test, all 40
vCPUs were bound to four cores; and for 40-VM test, all 80 vCPUs were bound to eight cores. In each case
each VM was able to leverage both primary and secondary threads concurrently.
Edison: IBM – Virtualization Performance White Paper Page 17
System Configuration for TPoX
Benchmark (5 to 40 VM Scaling)
# of
VMs
Total
Virtual
CPUs
% CPU
Utilization
Transactions
per second
IBM Power 750 3.5 GHz DPSM mode, four
sockets, 512 GB RAM, SMT4 enabled,
PowerVM, AIX 7.1 is the host OS for each
VM. VIOS is configured with 0.2 core/1
vCPU/ uncapped mode/ 4 GB RAM. Each
LPAR is configured with 1 vCPU/
uncapped/3 GB RAM three LPARs have
0.2 cores and 2 LPARs have 0.1 core.
Shared pool has one core
5 5 100 612.2
8 LPARs are configured each with 0.2/1
vCPU/ uncapped/ 3 GB memory, two
LPARs are configured with 0.1/1
vCPU/uncapped/3 GB memory, vios has
0.2/1 vCPU/uncapped/4 GB memory.
Shared pool has two cores
10 10 98 1155
18 LPARs are configured each with 0.2/1
vCPU/ uncapped/ 3 GB memory, two
LPARs are configured with 0.1/1
vCPU/uncapped/3 GB memory, vios has
0.2/1 vCPU/uncapped/4 GB memory.
Shared pool has four cores
20 20 98 2137
38 LPARs configured with 0.2core/ 1
vCPU/uncapped and two LPARs
configured with 0.1 core/1 vCPU/
uncapped. Shared pool has eight cores
40 40 98 4169.8
HP ProLiant DL580 G7, 2.26 GHz, eight
cores / 24 MB cache (4 sockets) Intel Xeon
7560 processors, 512 GB system RAM (HT
and Turbo enabled in BIOS Intel VTx with
EPT HW virtualization assist) VMware
vSphere 4.1 update1. Each VM has guest
OS RHEL6 GA. Each VM is given 2 vCPUs
unlimited/3 GB memory. DB2 buffer pool
for data is configured in each VM.
Schedule affinity is set to cpu0 and cpu1.
5 10 100 259
Schedule affinity is set to cpu0 to cpu3 10 20 100 490.5
Schedule affinity is set to cpu0 to cpu7 20 40 100 997.9
Schedule affinity is set to cpu0 to cpu15 40 80 100 1906.4
Table 6 TPoX Performance with VMware vSphere 4.1 update 1 Virtual Machine
Reconfiguration
Edison: IBM – Virtualization Performance White Paper Page 18
Consider how the response time improved with CPU scheduling affinity on VMware
vSphere 4.1 update 1. The query response time was reduced by approximately 30
percent. However, the impact on other transactions’ response time was negligible.
The question arose as to how these results would compare to previously published
TPoX benchmark results. No published results using virtualization technologies existed,
so Edison Group compared these results with those of published results for testing non-
virtualized systems on a comparable Intel Xeon 7560 system.11
Figure 6A. TPoX Query and Update Response Time
Figure 6B. TPoX Delete and Insert Response Time
11 In March 2010, Intel had published TPoX benchmark results on an Intel Xeon 7560 system with 32
cores/256 GB RAM using a 1 TB database in a non-virtualized environment. Further results can be found at
http://tpox.sourceforge.net/TPoX_Results_X7560.pdf
Edison: IBM – Virtualization Performance White Paper Page 19
System Configuration for TPoX
Benchmark (5 to 40 VM scaling)
# of
VMs
Total
Virtual
CPUs
Avg
query
rsp
(sec)
Avg
update
rsp
(sec)
Avg
delete
rsp
(sec)
Avg
insert
rsp
(sec)
IBM Power 750 3.5 GHz DPSM mode,
four sockets, 512 GB RAM, SMT4
enabled, PowerVM, AIX 7.1 is the host
OS for each VM. VIOS is configured
with 0.2 core/1 vCPU/ uncapped mode/
4 GB RAM. Each LPAR is configured
with 1 vCPU/ uncapped/3 GB RAM 3
LPARs have 0.2 cores and two LPARs
have 0.1 core Shared pool has one core
5 5 0.09 0.08 0.03 0.05
8 LPARs are configured each with 0.2/1
vCPU/ uncapped/ 3 GB memory, two
LPARs are configured with 0.1/ 1
vCPU/uncapped/3 GB memory, vios
has 0.2/1 vCPU/uncapped/4 GB
memory. Shared pool has two cores
10 10 0.09 0.08 0.04 0.06
18 LPARs are configured each with
0.2/1 vCPU/ uncapped/ 3 GB memory,
two LPARs are configured with 0.1/1
vCPU/uncapped/3 GB memory, vios
has 0.2/1 vCPU/uncapped/4 GB
memory. Shared pool has four cores
20 20 0.1 0.1 0.06 0.07
38 LPARs are configured with 0.2core/ 1
vCPU/uncapped and 2 LPARs
configured with 0.1core/1 vCPU/
uncapped. Shared pool has eight cores
40 40 0.1 0.15 0.1 0.12
HP ProLiant DL580 G7, 2.26 GHz, eight
cores / 24 MB cache (four sockets) Intel
Xeon 7560 Processors, 512 GB system
RAM (HT and Turbo enabled in BIOS
Intel VTx with EPT HW virtualization
assist) VMware vSphere 4.1 update1.
Each VM has guest OS RHEL6 GA. Each
VM is given two vCPU unlimited/3 GB
memory. DB2 buffer pool for data is
configured in each VM. Schedule
affinity is set to cpu0 and cpu1.
5 10 0.145 0.3 0.245 0.26
Schedule affinity is set to cpu0 to cpu3 10 20 0.17 0.36 0.285 0.33
Schedule affinity is set to cpu0 to cpu7 20 40 0.16 0.39 0.25 0.275
Schedule affinity is set to cpu0 to cpu15 40 80 0.17 0.345 0.25 0.28
Table 7 TPoX Response Time with VMware vSphere 4.1 update 1 Reconfiguration
Edison: IBM – Virtualization Performance White Paper Page 20
These previously-published results were better than what was achieved in tests using
the HP Intel Xeon 7560 system described here. The difference in these results could be
attributed to differences in storage subsystem, database size, execution of a large
number of software images such as guest OS, database middleware, etc. Most
significant, however, is that the tests described here were conducted in a virtualized
environment using VMware vSphere, which adds overhead in comparison to a non-
virtualized environment.
Summary of Results
Overall, PowerVM virtualization technology demonstrated superior performance over
VMware vSphere 4.1 update 1 in two different configurations, each configuration
covering two different virtual machine densities featuring high resource contention. As
demonstrated using the AIM7 and TPoX benchmarks, the difference in throughput
performance was quite considerable throughout, ranging from 50 percent better to as
much as 200 percent better on PowerVM technology.
Edison: IBM – Virtualization Performance White Paper Page 21
IBM’s Virtualization Infrastructure:
POWER7 Processor-Based Systems
The currently available POWER7 processor-based systems combine excellent
performance, scalability, and modularity. IBM’s clients realize a high return on their
investments with flexible, responsive infrastructures that easily adapt and grow based
on business needs. A virtualization hypervisor is built into Power Systems to provide
superior performance over competitive systems which rely on third-party virtualization
software such as the widely-deployed VMware vSphere.
POWER7 processor-based systems offer balanced systems designs that automatically
optimize workload performance and capacity at either a system or a virtual machine
level. Features include:
 TurboCore workload-optimizing mode for maximum per-core performance for
databases.
 MaxCore for parallelization and maximum capacity throughput.
 Intelligent threading technology to utilize more threads when it benefits workloads.
 Intelligent Cache technology to optimize cache utilization, flowing from core to core.
 Intelligent Energy that maximizes performance dynamically when thermal
conditions allow.
 Active Memory Expansion 12 that dynamically provides more memory on an as-
needed basis.
 Active Memory Sharing that allows for logical over-commitment of physical
memory and deduplication.
IBM PowerVM technology — the virtualization software built into the POWER7
processor-based systems — offers an unprecedented level of platform support,
scalability, efficient resource utilization, flexibility, and heterogeneous server
management. IBM PowerVM virtualization offers autonomic resource affinity, resulting
in higher workload performance in a virtualized environment. IBM POWER7 Systems,
and PowerVM technology with its efficient virtualization, are an excellent foundation
for cloud computing environments.
12 Supported on AIX operating systems only.
Edison: IBM – Virtualization Performance White Paper Page 22
PowerVM Virtualization Technology
With IBM POWER processor-based systems and IBM PowerVM virtualization
technologies, an organization can consolidate applications and servers using
partitioning and virtualized system resources to achieve a more flexible and dynamic IT
infrastructure. PowerVM delivers robust virtualization for IBM i, IBM AIX, and Linux
environments on IBM POWER processor-based systems. The POWER Hypervisor is
integrated as part of the system firmware and supports multiple operating
environments on a single system. PowerVM virtualization technology offers the
flexibility of combining dedicated and shared resources in the same partition. IBM
Power Systems servers and PowerVM technology are designed to deliver a dynamic
infrastructure that can help reduce costs, manage risk, and improve service levels.
Processor Virtualization
PowerVM technology’s advanced dynamic logical partitioning (LPAR) capabilities
allow a single partition to act as a completely separate AIX, IBM i, or Linux operating
environment. Partitions can be assigned either dedicated or shared processor resources.
With shared resources, PowerVM virtualization technology can automatically adjust
pooled processor resources across multiple operating systems, borrowing processing
power from idle partitions to handle high transaction volumes in other partitions.
PowerVM technology’s Micro-Partitioning supports up to 10 dynamic logical partitions
per processor core. Depending upon the Power server, up to 1,000 independent
virtualized servers can be run on a single physical Power server — each virtualized
server with its own fractional processor share, memory, and I/O resources. These
partitions can be assigned at a granularity of 1/100th of a core. Consolidating systems
with PowerVM technology can reduce operational costs, improve availability, ease
management, and improve service levels, while allowing businesses to deploy
applications quickly.
Shared processor pools increase throughput by allowing for the automatic non-
disruptive balancing of processing power between partitions assigned to shared pools. It
also provides for the ability to reduce processor-based software licensing costs by
capping the processor core resources used by a group of partitions.
Shared dedicated capacity allows for the “donation” of spare CPU cycles, from
dedicated processor partitions to a shared processor pool. The dedicated partition
maintains absolute priority for dedicated CPU cycles. Enabling this feature can help to
increase system utilization without compromising the computing power for critical
workloads in a dedicated processor.
Edison: IBM – Virtualization Performance White Paper Page 23
Memory Virtualization
PowerVM technology features Active Memory Sharing, a technology that intelligently
and dynamically reallocates memory from one partition to another for increased
utilization, flexibility, and performance. Active Memory Sharing enables the sharing of a
pool of physical memory among logical partitions on a single server. This helps reduce
the need for reserve memory resource capacity in a consolidated environment by
increasing the efficiency of memory utilization, driving down system costs. The memory
is dynamically allocated among the partitions as needed, to optimize the usage of
physical memory in the pool. Along with shared memory, PowerVM technology also
supports dedicated memory allocation, which enables partitions having shared memory
to coexist in the same system as partitions having dedicated memory.
I/O Virtualization
The Virtual I/O Server (VIOS) is an integral part of PowerVM technology. A special-
purpose partition, VIOS eliminates the need for dedicated network adapters, disk
adapters and disk drives, and tape adapters and tape drives in the guest partitions
running as VMs. It can reduce costs by virtualizing I/O resources to those partitions.
VIOS owns the resources that are shared with clients; a physical adapter assigned to the
VIOS partition can be shared by one or more other partitions. With VIOS, guest
partitions can easily be created for test, development, or production purposes. PowerVM
technology also supports dedicated I/O along with VIOS on the same system. Therefore,
a single system can have I/O hosted by VIOS for some partitions and other partitions
with dedicated I/O devices. An organization can thus reserve a dedicated VM of a given
capacity that can be relied upon for high-priority and/or mission-critical workloads,
while assigning other VMs to a general resource pool.
Partition Mobility
Live Partition Mobility facilitates the migration of a running AIX or Linux partition from
one physical server to another without requiring application downtime for planned
system maintenance, migrations, provisioning, and workload management.
Partition Hibernation
IBM POWER7 systems support Partition Hibernation, where a partition can be
suspended and resumed at a later time. In a suspended state, a partition’s resources can
be used by other partitions while the suspended partition’s state is stored in a paging
Edison: IBM – Virtualization Performance White Paper Page 24
space on a persistent storage device. Partition Hibernation can be used for resource
balancing and for planned CEC outages for maintenance or upgrades.
Workload Partitioning
PowerVM technology also supports a software partitioning technology provided by the
AIX operating system, a mode of virtualization capability called Workload Partitions
(WPARs). Introduced with AIX Version 6, WPAR is independent of hardware features.
It enables consolidation of workloads on a single AIX operating system by providing
isolation between workloads running in different WPARs. From an application
perspective, each workload is running in its own operating system environment. A key
feature of WPAR is mobility, a running WPAR can be relocated from one VM to another
on the same operating system platform. This enables applications to be migrated to
another system during planned maintenance operations, to balance workloads, to
provision rapidly to meet growth dynamically, and to improve energy efficiency by
further consolidating on the fly during low load periods.
Systems Management
IBM Systems Director (Express, Standard, and Enterprise Editions) for Power servers
supports the PowerVM environment. It is IBM’s tool for heterogeneous platform
management of Power Systems, IBM System x, IBM System z, and IBM System Storage
systems. IBM Systems Director Editions support advanced management functions such
as system discovery, workload lifecycle management, health monitoring, system
updates, and topology mappings. It also provides the ability to take action on defined
event thresholds of monitored system components.
IBM Systems Director VMControl transforms Systems Director from managing
virtualization to using virtualization in order to better manage an entire IT
infrastructure. It is offered as a plug-in option included with the Systems Director
Standard and Enterprise Editions. Together, IBM Systems Director and VMControl help
reduce the total cost of ownership in a virtual environment by increasing asset
utilization and reducing the time and effort required to deploy workloads. Using them,
administrators can maintain high levels of availability through proactive monitoring
and collaborative troubleshooting, reducing costs further.
VMControl is available in three editions, to suit the varying levels of virtualization
deployment at client sites:
 VMControl Express Edition provides basic VM lifecycle management.
Edison: IBM – Virtualization Performance White Paper Page 25
 VMControl Standard Edition adds virtual appliance lifecycle management to capture
information from active systems and store it in a repository as reusable system
images (called virtual appliances).
 VMControl Enterprise Edition adds system pool lifecycle management. It allows
users to create and manage system pools – or groups of virtual appliances deployed
across multiple physical servers – as easily as managing a single entity. The
advanced virtualization management capabilities of VMControl provide a pathway
for organizations to build sophisticated cloud computing environments.
PowerVM Virtualization Technology Advantages
PowerVM virtualization technology offers a secure virtualization environment built on
the advanced RAS features and excellent performance of the Power Systems platform.
PowerVM technology delivers numerous advantages, including:
 High resource utilization — PowerVM technology makes the most efficient
utilization of IT investments by virtualizing resources that include processors,
memory, and I/O across multiple virtual machines.
 Flexibility — PowerVM technology runs on all Power Systems servers, from blades
to high-end servers. It provides the greatest flexibility by supporting both dedicated
and shared resource models. Unlike VMware vSphere on the x86 platform,
PowerVM virtualization technology allows virtual machines to have all dedicated
resources (CPU, memory and I/O) , or all shared resources (virtual processors,
virtual memory, virtual I/O), or a mix of dedicated and shared resources in the same
LPAR.
 Quality of Service — PowerVM technology ensures that workloads achieve high
quality of service even when LPARs share processors from a shared pool.
 Scalability — PowerVM technology can reduce server purchases by supporting
partitions as small as 1/10 of a processor. POWER7 processor-based high-end
systems support up to 256 physical processors in a single LPAR and up to 1,000
partitions in a system.
 Availability — Live Partition Mobility (LPM) helps eliminate planned downtime by
allowing partitions to be moved to another server while running, freeing hardware
for upgrades or maintenance without interrupting productive operations. In a
system pool, LPM enables autonomic load balancing across multiple systems.
 Resource pools — IBM PowerVM technology has enhanced CPU and memory
affinity to improve performance of resource-intensive workloads, such as database
workloads, across multiple virtual machines sharing resources in a system. IBM
VMControl enhancements make it easier to deploy and manage large numbers of
Edison: IBM – Virtualization Performance White Paper Page 26
these virtual machines in a shared resource pool spanning one or more physical
systems.
Integrated Virtualization
Because of its level of sophistication and maturity, PowerVM technology is commonly
employed with enterprise-class applications and workloads. Power Systems servers
implement virtualization architecture with components embedded in the hardware,
firmware, and operating system software, all while running with significantly less
overhead. The capabilities of this integrated virtualization architecture are significantly
different and, in many areas, more advanced than VMware vSphere and other third-
party software, which must be installed on x86 hardware that leverages hardware-assist
virtualization optimizations.
Power Systems servers and PowerVM virtualization technology capabilities are more
granular and more closely integrated than are those of VMware vSphere or Microsoft
Hyper-V (or equivalent x86-based virtualization tools), or Oracle VM for SPARC. The
Power Systems platform also benefits from numerous industry-leading availability
optimization features. These distinctive capabilities have led to widespread adoption of
Power Systems servers to support the significantly more demanding performance and
uptime requirements of transaction- and database-intensive systems.
Greater Partition Isolation
By enabling “firmware-based” partitions, PowerVM technology provides greater
partition isolation than software-based virtualization technologies. Firmware-based
logical partitions (or virtual machines) reduce the potential for performance bottlenecks
and contribute to higher levels of availability and security than does software-based
virtualization. They also contribute to increased linear scalability.
Partitioning and Workload Management Integration
The importance of workload management cannot be overstated. Partitioning creates the
potential to utilize capacity very efficiently. The extent that this potential is realized in
practice depends on the mechanisms that allocate system resources, monitor, and
control workload execution across partitions. If these mechanisms are ineffective, a high
proportion of system capacity may remain idle at any given time.
Close integration of partitioning and workload management capabilities help prevent
surges in workloads running in individual partitions from impacting performance and
availability. POWER7 processor-based systems have a large number of cores per socket,
Edison: IBM – Virtualization Performance White Paper Page 27
abundant memory, and a great deal of I/O bandwidth per core. They also support a high
number of threads per core with simultaneous multithreading (SMT). Different
workloads can benefit from different processor core thread settings; processor-intensive
workloads might benefit from using one thread (SMT1) while workloads that are I/O-
intensive can benefit from using several. POWER7 processor-based systems support up
to an SMT4 setting.
Thus, POWER7 processor-based systems consolidate an unprecedented number of
partitions and can handle workload surges more effectively, for demonstrably higher
performance.
Accommodating Greater Consolidation Density
PowerVM technology is optimized to handle business-critical systems and complex
multi-partition production environments. IBM Power Systems and PowerVM
technologies allow a high consolidation ratio and thus greater levels of efficiency in
utilization.
Edison: IBM – Virtualization Performance White Paper Page 28
Conclusions
Virtualization has become a pervasive means of consolidating workloads on fewer
systems, controlling server sprawl and minimizing costs. With IBM Power Systems and
PowerVM virtualization technologies, organizations can achieve virtualization with
outstanding performance. For every benchmark and every scenario covered in this
paper, IBM Power Systems with PowerVM technology demonstrated superior
performance and greater efficiency in using system capacity at higher utilization, as well
as at higher resource contention (over-commit levels), and superior scaling with higher
throughput performance.
In summary, this study has shown that IBM POWER7 systems and PowerVM
technology have demonstrated:
 Higher throughput performance for both AIM7 and TPoX benchmarks, ranging from
50 percent better to as much as 200 percent better.
 Higher efficiency in resource over-commit mode (higher consolidation ratio), with
the response time on PowerVM virtualization technology two to six times shorter,
compared to response time for VMware vSphere 4.1 update 1, as the number of VMs
scaled from five to 40 VMs.
 Higher processor affinity by default (40 VMs sharing eight cores), retaining 2.3 times
better performance than HP Intel/VMware vSphere 4.1 update 1 technologies, even
with reconfiguration using CPU affinity (VMware Scheduling Affinity group) on
VMware vSphere 4.1 update 1.
 Efficient leveraging of maximum configured processor capacity.
 Accurate accounting of resource usage within a VM.
 Tighter integration across system, hypervisor, and guest OS.
 Better performance overall than Intel Xeon 7560 /VMware vSphere 4.1 update 1.
The charts that follow summarize the results of the tests described in this paper.
The first — the AIM7 performance benchmark 32-core VM scaling (scale-up) results—
shows that PowerVM on POWER7 delivers superior scale-up efficiency that
outperforms VMware vSphere 4.1 update 1 by up to 115 percent while running the same
Linux workloads and virtualized resources.
Edison: IBM – Virtualization Performance White Paper Page 29
0
100000
200000
300000
400000
500000
600000
700000
Jobs/min
1VM 2VM 4VM 8VM 16VM 32VM
Number of Virtual Machines
AIM7 Performance Benchmark
32 VM Scale-out on 32 cores
VMware vSphere 4.1 on HP DL580(1vcpu) VMware vSphere 4.1 on HP DL580(2vcpu)
PowerVM on Power 750(1vcpu)
In fact, PowerVM on POWER7 retains its superiority even configured with an additional
virtual CPU per VM.
The second chart — the TPOX performance benchmark 5 VM per core (scale-out) —
shows that PowerVM on POWER7 delivers robust scale-out efficiency that outperforms
VMware vSphere 4.1 update 1 by up to 201 percent while running the same workloads
and virtualized resources.
Edison: IBM – Virtualization Performance White Paper Page 30
0
1000
2000
3000
4000
5000
Jobs/min
5VM 10VM 20VM 40VM
Number of Virtual Machines
TPOX Performance Benchmark
40 VM Scale-out on 8 cores
5 VMs per core
VMware vSphere 4.1 on HP DL580(1vcpu) VMware vSphere 4.1 on HP DL580(2vcpu)
PowerVM on Power 750(1vcpu)
PowerVM maximizes workload performance and system resources while running
multiple virtual machines on a core better than does VMware vSphere 4.1 update 1.
IBM Power Systems — with the superior performance of PowerVM virtualization
technology and with features such as reliability, security, high availability, and
resiliency — are well positioned for cloud computing and smarter planet solutions today
and in the future.
Edison: IBM – Virtualization Performance White Paper Page 31
Appendices
Appendix 1 — Benchmark Configuration Information
IBM started competitive research on PowerVM virtualization in 2009 and published two
papers 13 comparing IBM POWER processor-based systems and PowerVM virtualization
technologies to Microsoft Hyper-V and VMware vSphere 4.0 update 1 running on an HP
ProLiant DL 370 G6/ Intel Xeon 5570 processors. Both these studies, which show the
superior performance of POWER processors and PowerVM technology, took a
simplified approach to answering the two most commonly expressed considerations in
deploying virtualization technologies:
1. How efficient is the technology?
2. How well does the technology scale?
The current study builds upon those simple premises to include two additional
considerations:
1. How efficient is the technology when resources are in high contention?
2. How well does it scale as virtual machine density increases?
Test Bed Setup
The servers employed for this study were chosen for their equivalencies from the
standpoint of core and socket count.
IBM POWER7 Processor-Based Server
The IBM POWER7 processor-based IBM Power 750 Express system was used in this
study to demonstrate the capabilities of IBM’s PowerVM virtualization technology. The
system was configured with four sockets, 3.5 GHz, 32 cores (eight per socket) supporting
up to four threads (SMT4) per core, and 512 GB of RAM.
13 A Comparison of PowerVM and x86-Based Virtualization Performance, Oct 2009
http://www-03.IBM.com/support/techdocs/atsmastr.nsf/WebIndex/WP101574
A Comparison of PowerVM and VMware Virtualization Performance, April 2010
http://www.spectrumconsulting.co.nz/aix/wp-content/uploads/PowerVM_VMware.pdf
Edison: IBM – Virtualization Performance White Paper Page 32
HP ProLiant DL580 G7 Intel Xeon X7560 (2.26GHz/8-core/24MB/130W)
Processor
HP ProLiant DL580 G7 is a rack-mounted, high-performance Intel Xeon 7560-based
server; this system was selected to demonstrate the capabilities of VMware vSphere 4.1
update 1 virtualization technologies. The system was configured with four sockets, with
eight cores each, supporting up to two threads per core (HT mode). The system was also
enabled for Turbo Mode, Intel VTx with EPT HW Virtualization assist.
Infrastructure Configuration
System Configuration Storage Configuration
IBM Power 750, 3.5 GHz, eight cores per
socket
POWER7 Processors, 128 GB RAM per
socket.
IBM DS4800 (4 GB cache), one 4 Gb Fiber
Channel adapter.
Each array has 12 (32 GB) disks using
RAID5.
Each array is shared by four virtual
machines, each getting 40 GB virtual
disk space.
HP ProLiant DL 580 G7, 2.26 GHz, eight
cores / 24 MB (four sockets) Intel Xeon
7560 Processors, 512 GB system RAM.
IBM DS4800 (4 GB cache), one 4 Gb Fiber
Channel adapter.
Each array has 12 (32 GB) disks using
RAID5.
Each array is shared by four virtual
machines, each getting 40 GB virtual
disk space.
Software Used
Category PowerVM Technology VMware vSphere
Hypervisor Power Hypervisor (IBM Power
750 in-built hypervisor)
VMware vSphere 4.1 Update 1
Guest OS SuSE 11, SP1
AIX 7.1
SuSE 11, SP1 GA x86_64
RHEL6 GAx86_64
Middleware IBM DB2 v9.7 IBM DB2 v9.7
Edison: IBM – Virtualization Performance White Paper Page 33
VMware vSphere 4.1 update 1 Virtual Machine Technical Configuration Details
1. VMware Virtual Machine was created using Virtual Machine version 7, which is
compatible with vSphere 4.0 hosts and greater, and provided greater virtual machine
functionality than earlier versions.
2. A Virtual Disk LSI Logic Parallel adapter was used. It was noted (in vSphere Help)
that the LSI Logic Parallel adapter and the LSI Logic SAS adapter offer equivalent
performance.
3. The VMware vSphere 4.1 update 1 system was updated to the latest VMware Tools.
4. Scheduling affinity group was used to bind cores to virtual machines.
5. Memory affinity was enabled.
6. vSpheretop –ab and vmstat were collected from the virtual machine.
Edison: IBM – Virtualization Performance White Paper Page 34
Appendix 2 — General Benchmark Descriptions
The performance tests described here characterized hypervisor efficiency and scalability.
Both benchmarks stress the entire stack of application, middleware, OS, and
hypervisors. Neither benchmark requires external clients to drive the load.
The following tests were conducted:
1. Demonstrate the effect that adding virtual processors incrementally has on
throughput performance in a single VM. Where direct performance comparisons
were to be made, the testing team limited the number of virtual processors to the
lesser of the maximum supported across the two virtualization platforms.
Note: While consolidation deployments by definition entail multiple VMs,
understanding how each technology deals with processor scaling in the simplest
possible configuration within a single VM provides insights into hypervisor
efficiency.
2. Demonstrate the effect that adding VMs has on throughput performance.
Throughput is monitored as the number of VMs is scaled from 1 to n. Throughput in
each VM was also evaluated using varying numbers of virtual processors and load.
Note: This will show the effect of multiple VMs running on a system in a non-
over-commit as well as an over-commit resource environment.
Each of these tests (1 and 2) was run on different workloads. The tests included running
the same workloads (homogeneous) or a mix of workloads (heterogeneous) across
multiple VMs concurrently. This revealed how each class of workload is affected by the
respective types of resource scaling in each test.
To ensure fair comparison across platforms and to remove variability across each set of
tests, the following actions were taken:
 Similar VM configurations were deployed in terms of virtual processors and
memory allocated per VM.
 The same set of “benchmark parameters” was used across platforms.
 Tuning was performed based on best practices of respective platforms (VMware
vSphere 4.1 update 1, RHEL 6.0, AIX 7.1, DB2 tuning).
Edison: IBM – Virtualization Performance White Paper Page 35
Addendum:
Benchmarks Comparing PowerVM on Power 750
with vSphere 5 on Intel Westmere EX-Based System
At the time that the systems were tested for this white paper, VMware vSphere 4.1
update 1 was most current version available from VMware. Subsequently, VMware
announced a significant new release: version 5, which includes nearly 200 new or
enhanced features and capabilities such areas as deployment, storage, management,
availability, and security.
The central improvement to virtualization and consolidation capacity (and thus to this
white paper) in version 5 is that vSphere VMs can now be configured with up to 1
terabyte of memory and 32 virtual CPUs. VMware is touting this version (“supporting
VMs that are up to four times more powerful than previous versions”) as the way to
accelerate a data center’s move to a more efficient cloud infrastructure.
Edison sought to assess whether a commensurate improvement in throughput
performance accompanied vSphere’s greater vCPU capacity. It also wanted to
investigate whether PowerVM retains the considerable advantage over vSphere in
performance and hardware utilization that it demonstrated in the original edition of the
white paper.
Summary
Edison wished to evaluate a comparison of PowerVM performance against the latest
solutions that the x86-based VMware platform has to offer on a similar class of server
hardware. Therefore, on the vSphere side, the tests described in this addendum were
run on an HP ProLiant DL580 G7 E7-4870 server, which features the X5600-series Xeon
chip architecture (Westmere-EX) and contains 40 cores (10 cores per chip). As in the
previously published edition of this white paper, PowerVM was run on an IBM Power
750 system, based on the POWER7 processor.
Edison reviewed and analyzed the results of the open source AIM7 benchmark testing
applied to the three virtualization solutions — VMware vSphere 4.1 update 1, VMware
vSphere 5, and PowerVM — in a scale-up scenario of 32 vCPUs within a single VM. A
second test — a vCPU scale-out scenario of 32 vCPUs using eight VMs — was evaluated
that compares vSphere 5 with PowerVM.
Edison: IBM – Virtualization Performance White Paper Page 36
The key findings, summarized, are as follows:
 In terms of throughput performance, vSphere 5 demonstrated no improvement over
vSphere 4.1 update 1; in fact, it demonstrated slightly lower performance overall.
 PowerVM on Power 750 outperforms vSphere 5 on the Intel-based system by up to
131 percent, running the same workloads across virtualized resources.
 PowerVM on Power 750 outperforms VMware vSphere 5 by up to 525 percent when
running multiple VMs and workloads, despite the test Intel x86 system (Westmere-
EX) containing a greater number of cores (40 versus 32).
The benchmark results reveal that PowerVM virtualization technology on POWER7
processor-based platforms retains as great a performance advantage over VMware
vSphere 5 on Intel x86 platforms as it does over VMware vSphere 4.1 update 1.
Therefore, PowerVM virtualization technology remains the consolidation system of
choice for organizations wishing to realize the full advantages of greater VM density, as
was demonstrated in the earlier edition of the white paper.
The Benchmarks
To obtain the results presented in this addendum, the AIM7 benchmark (described on
Page 7 of this white paper) was employed in two different scenarios. Once again, the
Power Linux version used on PowerVM virtualization technology was SuSE 11 SP1.
SuSE 11 SP1 x86_64 was used as guest OS on VMware vSphere 4.1 update 1.
Scale-Up Benchmark
This scenario tested three platforms: VMware vSphere 4.1 update 1 and VMware
vSphere 5, each running on an HP ProLiant DL580 G7 E7-4870 server; and PowerVM
running on an IBM Power 750 system.
AIM7 was scaled in one, two, four, eight, 16, and 32 vCPUs within a single VM. Scaling
was near linear on both the POWER7 processor/PowerVM technology-based systems
and both of the Intel/VMware vSphere platforms.
Running the same workloads across virtualized resources, the POWER7
processor/PowerVM system demonstrated superior performance well over twice the
percentage of either Intel/VMware vSphere 4.1 or Intel/VMware vSphere 5 at one, two,
four, and eight vCPU configurations. At the top end for vSphere 4.1 update 1 (8 vCPUs),
PowerVM technology demonstrated a 103 percent advantage; while at the top end for
vSphere 5 , PowerVM technology demonstrated a substantial 131 percent advantage
(Figure 1).
Edison: IBM – Virtualization Performance White Paper Page 37
NOTE: The VM and vCPU configurations and the numeric test result data
points can be found in the tables following the graphs for both tests in this
addendum.
0
100000
200000
300000
400000
500000
600000
Jobs/min
1 2 4 8 16 32
# of vcpus
AIM7 SingleVM Scale-up
PowerVM vSphere5 vSphere4.1
Figure 1. AIM7 Single VM Scale-Up
Table 1 shows the details on throughput and CPU utilization for each configuration. As
in the tests conducted for the original study, the VMs on all three platforms were
configured as close to identically as possible. In the case of PowerVM, each logical
partition (LPAR) was given 3 GB RAM, 1, 2, 4, 8, 16 and 32 virtual processors. In the case
of VMware vSphere, each VM was given 3 GB RAM, 1, 2, 4, 8, 16 and 32 virtual
processors with the remainder left at default options.
Edison: IBM – Virtualization Performance White Paper Page 38
System Configuration for AIM7
Benchmark (1 to 32 VM Scaling)
Cores in
the
System
Virtual
CPUs Jobs/Min
% CPU
Utilization
IBM Power 750 3.6 GHz, 4 sockets, 384 GB
RAM, SMT4-enabled, PowerVM and
SLES11 SP1 (Power Linux)
One core one vCPU 32 1 19027 3.09%
Two cores two vCPUs 32 2 37751 6.19%
Four cores four vCPUs 32 4 74624 12.38%
Eight cores four vCPUs 32 8 144680 25.00%
16 cores 16 vCPUs 32 16 287559 50.00%
32 cores 32 vCPUs 32 32 540666 98.00%
HP ProLiant DL580 G7, Intel Xeon E7 4870
2.4 GHz, 640 GB RAM, 4 sockets, VMware
vSphere 4.1 update 1 and SLES11 SP1
(x86_64)
One vCPU 40 1 9173 2.90%
Two vCPUs 40 2 18287 5.48%
Four vCPUs 40 4 36231 10.49%
Eight vCPUs 40 8 71239 20.42%
HP ProLiant DL580 G7, Intel Xeon E7 4870
2.4 GHz, 640 GB RAM, 4 sockets, VMware
vSphere 5 and SLES11 SP1 (x86_64)
One socket one vCPU 40 1 9018 4.42%
One socket two vCPUs 40 2 17898.7 6.85%
One socket four vCPUs 40 4 35379 11.79%
One socket eight vCPUs 40 8 69077 21.62%
One socket 16 vCPUs 40 16 130770 41.24%
One socket 32 vCPUs 40 32 233684 80.34%
Table 1. AIM7 Benchmark Single Virtual Machine Scale-Up
An interesting revelation can be seen more clearly in the table than the graph, where the
former top limit of eight vCPUs for vSphere has been highlighted in each version. Not
only is vSphere 5 no better than vSphere 4.1 update 1 in terms of scale-up efficiency as
reflected in throughput performance, it is actually slightly less efficient.
Edison: IBM – Virtualization Performance White Paper Page 39
As explained on Page 10 of this white paper, many factors contribute to this superior
performance, including: PowerVM technology efficiency, IBM POWER7 SMT4
technology, IBM POWER7 core efficiency and IBM POWER7 higher core frequency.
Furthermore, PowerVM on Power 750 systems can leverage all system resources in order
to maximize workload performance.
Scale-Out Benchmark
This scenario tested VMware vSphere 5 running on an HP ProLiant DL580 G7 E7-4870
server against PowerVM running on an IBM Power 750 system. AIM7 was scaled to
eight VMs using 32 vCPUs per VM, configuring a total of 256 vCPUs. Running the same
workloads across virtualized resources, the POWER7 processor/PowerVM -based
system demonstrated a very substantial 525 percent advantage over Intel/VMware
vSphere 5.
0
100000
200000
300000
400000
500000
600000
Jobs/Min
8 VM
AIM7 Multiple VM scale-out
(32 vcpus per VM)
PowerVM vSphere5
Figure 2. AIM7 Multiple VM Scale-Out
It is important to note that the difference in efficient use of hardware resources between
the two systems. The server used to run the vSphere workloads contains more cores (40)
than does the Power 750 hardware. Yet it is unable to leverage the greater hardware
capacity to achieve superior or even comparable throughput performance. Table 2,
below, shows that the workload on each platform consumed all the capacity in the
system (i.e., 100 percent CPU utilization).
Edison: IBM – Virtualization Performance White Paper Page 40
System Configuration for
AIM7 Benchmark
(1 to 32 VM Scaling)
Cores
in the
System
# of
VMs
Virtual
CPUs Jobs/Min
% CPU
Utilization
IBM Power 750 3.6 Ghz, 4
sockets, 384 GB RAM, SMT4-
enabled, Power VM and
SLES11 SP1 (Power Linux)
Eight VM - each VM has four
cores / 32 vCPUs
32 8 256 500,721.10 100%
HP Proliant DL580 G7, Intel
Xeon E7 4870 2.4 Ghz, 640 GB
RAM, 4 sockets, VMware
vSphere 5, SLES11 SP1 (x84 64)
Eight VM - each VM has 1
socket / 32 vCPUs
40 8 256 79,626.10 100%
Table 2. AIM7 Benchmark Multiple Virtual Machine Scale-Out
Conclusion
As shown in this addendum, IBM PowerVM on POWER 7-based systems demonstrate
the same distinct and considerable advantages over VMware vSphere 5 in workload
throughput performance on x86 Intel-based platforms as over vSphere 4.1 update 1. The
edge that POWER7/PowerVM has over Intel/vSphere remains linearly substantial as
VMs and vCPUs are scaled, becoming ever more significant as workloads increase.
A data center scaling up to a cloud-supporting infrastructure or large-scale enterprise
applications would have to purchase, deploy, provision, and maintain a good deal more
hardware and software to achieve the same workload productivity possible with
PowerVM on POWER7. This dilutes the multiple cost advantages delivered via
consolidation, and can increase total cost of ownership in the form of a more complex
infrastructure to manage and more time devoted to systems maintenance.
POL03090-USEN-02

More Related Content

What's hot

Ibm power ha v7 technical deep dive workshop
Ibm power ha v7 technical deep dive workshopIbm power ha v7 technical deep dive workshop
Ibm power ha v7 technical deep dive workshop
solarisyougood
 
Virtualisation overview
Virtualisation overviewVirtualisation overview
Virtualisation overview
sagaroceanic11
 
IBM POWER Systems
IBM POWER SystemsIBM POWER Systems
IBM POWER Systems
tcp cloud
 
Introduce: IBM Power Linux with PowerKVM
Introduce: IBM Power Linux with PowerKVMIntroduce: IBM Power Linux with PowerKVM
Introduce: IBM Power Linux with PowerKVM
Zainal Abidin
 
Fordele ved POWER7 og AIX, IBM Power Event
Fordele ved POWER7 og AIX, IBM Power EventFordele ved POWER7 og AIX, IBM Power Event
Fordele ved POWER7 og AIX, IBM Power Event
IBM Danmark
 
IBM XIV Gen3 Storage System
IBM XIV Gen3 Storage SystemIBM XIV Gen3 Storage System
IBM XIV Gen3 Storage System
IBM India Smarter Computing
 
Emc vipr srm workshop
Emc vipr srm workshopEmc vipr srm workshop
Emc vipr srm workshop
solarisyougood
 
Ibm aix
Ibm aixIbm aix
Future of Power: PureFlex and IBM i - Erik Rex
Future of Power: PureFlex and IBM i - Erik RexFuture of Power: PureFlex and IBM i - Erik Rex
Future of Power: PureFlex and IBM i - Erik Rex
IBM Danmark
 
IBM i 7.1 & TRs CEC 2012
IBM i 7.1 & TRs CEC 2012IBM i 7.1 & TRs CEC 2012
IBM i 7.1 & TRs CEC 2012
COMMON Europe
 
Power systems virtualization with power kvm
Power systems virtualization with power kvmPower systems virtualization with power kvm
Power systems virtualization with power kvm
solarisyougood
 
IBM PowerVM Best Practices
IBM PowerVM Best PracticesIBM PowerVM Best Practices
IBM PowerVM Best Practices
IBM India Smarter Computing
 
XIV Storage deck final
XIV Storage deck finalXIV Storage deck final
XIV Storage deck final
Joe Krotz
 
IBM informix: compared performance efficiency between physical server and Vir...
IBM informix: compared performance efficiency between physical server and Vir...IBM informix: compared performance efficiency between physical server and Vir...
IBM informix: compared performance efficiency between physical server and Vir...
BeGooden-IT Consulting
 
IBM PowerVM Virtualization Introduction and Configuration
IBM PowerVM Virtualization Introduction and ConfigurationIBM PowerVM Virtualization Introduction and Configuration
IBM PowerVM Virtualization Introduction and Configuration
IBM India Smarter Computing
 
VIOS in action with IBM i
VIOS in action with IBM i VIOS in action with IBM i
VIOS in action with IBM i
COMMON Europe
 
EMC Vmax3 tech-deck deep dive
EMC Vmax3 tech-deck deep diveEMC Vmax3 tech-deck deep dive
EMC Vmax3 tech-deck deep dive
solarisyougood
 
A15 ibm informix on power8 power linux
A15 ibm informix on power8  power linuxA15 ibm informix on power8  power linux
A15 ibm informix on power8 power linux
BeGooden-IT Consulting
 
Fulcrum Group Virtualization How does It Fit
Fulcrum Group Virtualization How does It FitFulcrum Group Virtualization How does It Fit
Fulcrum Group Virtualization How does It Fit
Steve Meek
 
Xiv svc best practices - march 2013
Xiv   svc best practices - march 2013Xiv   svc best practices - march 2013
Xiv svc best practices - march 2013
Jinesh Shah
 

What's hot (20)

Ibm power ha v7 technical deep dive workshop
Ibm power ha v7 technical deep dive workshopIbm power ha v7 technical deep dive workshop
Ibm power ha v7 technical deep dive workshop
 
Virtualisation overview
Virtualisation overviewVirtualisation overview
Virtualisation overview
 
IBM POWER Systems
IBM POWER SystemsIBM POWER Systems
IBM POWER Systems
 
Introduce: IBM Power Linux with PowerKVM
Introduce: IBM Power Linux with PowerKVMIntroduce: IBM Power Linux with PowerKVM
Introduce: IBM Power Linux with PowerKVM
 
Fordele ved POWER7 og AIX, IBM Power Event
Fordele ved POWER7 og AIX, IBM Power EventFordele ved POWER7 og AIX, IBM Power Event
Fordele ved POWER7 og AIX, IBM Power Event
 
IBM XIV Gen3 Storage System
IBM XIV Gen3 Storage SystemIBM XIV Gen3 Storage System
IBM XIV Gen3 Storage System
 
Emc vipr srm workshop
Emc vipr srm workshopEmc vipr srm workshop
Emc vipr srm workshop
 
Ibm aix
Ibm aixIbm aix
Ibm aix
 
Future of Power: PureFlex and IBM i - Erik Rex
Future of Power: PureFlex and IBM i - Erik RexFuture of Power: PureFlex and IBM i - Erik Rex
Future of Power: PureFlex and IBM i - Erik Rex
 
IBM i 7.1 & TRs CEC 2012
IBM i 7.1 & TRs CEC 2012IBM i 7.1 & TRs CEC 2012
IBM i 7.1 & TRs CEC 2012
 
Power systems virtualization with power kvm
Power systems virtualization with power kvmPower systems virtualization with power kvm
Power systems virtualization with power kvm
 
IBM PowerVM Best Practices
IBM PowerVM Best PracticesIBM PowerVM Best Practices
IBM PowerVM Best Practices
 
XIV Storage deck final
XIV Storage deck finalXIV Storage deck final
XIV Storage deck final
 
IBM informix: compared performance efficiency between physical server and Vir...
IBM informix: compared performance efficiency between physical server and Vir...IBM informix: compared performance efficiency between physical server and Vir...
IBM informix: compared performance efficiency between physical server and Vir...
 
IBM PowerVM Virtualization Introduction and Configuration
IBM PowerVM Virtualization Introduction and ConfigurationIBM PowerVM Virtualization Introduction and Configuration
IBM PowerVM Virtualization Introduction and Configuration
 
VIOS in action with IBM i
VIOS in action with IBM i VIOS in action with IBM i
VIOS in action with IBM i
 
EMC Vmax3 tech-deck deep dive
EMC Vmax3 tech-deck deep diveEMC Vmax3 tech-deck deep dive
EMC Vmax3 tech-deck deep dive
 
A15 ibm informix on power8 power linux
A15 ibm informix on power8  power linuxA15 ibm informix on power8  power linux
A15 ibm informix on power8 power linux
 
Fulcrum Group Virtualization How does It Fit
Fulcrum Group Virtualization How does It FitFulcrum Group Virtualization How does It Fit
Fulcrum Group Virtualization How does It Fit
 
Xiv svc best practices - march 2013
Xiv   svc best practices - march 2013Xiv   svc best practices - march 2013
Xiv svc best practices - march 2013
 

Viewers also liked

SoftwareONE Oracle Licensing Introduction 18.02.14
SoftwareONE Oracle Licensing Introduction 18.02.14SoftwareONE Oracle Licensing Introduction 18.02.14
SoftwareONE Oracle Licensing Introduction 18.02.14
SoftwareONEPresents
 
Database Systems Concepts, 5th Ed
Database Systems Concepts, 5th EdDatabase Systems Concepts, 5th Ed
Database Systems Concepts, 5th Ed
Daniel Francisco Tamayo
 
Oracle database - The most common license compliance issues seen
Oracle database - The most common license compliance issues seenOracle database - The most common license compliance issues seen
Oracle database - The most common license compliance issues seen
b.lay
 
Chapter01 introduction
Chapter01 introductionChapter01 introduction
Chapter01 introduction
Ngeam Soly
 
Understanding software licensing with IBM Power Systems PowerVM virtualization
Understanding software licensing with IBM Power Systems PowerVM virtualizationUnderstanding software licensing with IBM Power Systems PowerVM virtualization
Understanding software licensing with IBM Power Systems PowerVM virtualization
Jay Kruemcke
 
Insight into Oracle licensing
Insight into Oracle licensingInsight into Oracle licensing
Insight into Oracle licensing
ITsyndicaat
 
Fundamentals of Database system
Fundamentals of Database systemFundamentals of Database system
Fundamentals of Database system
philipsinter
 
Chapter 1 Fundamentals of Database Management System
Chapter 1 Fundamentals of Database Management SystemChapter 1 Fundamentals of Database Management System
Chapter 1 Fundamentals of Database Management System
Eddyzulham Mahluzydde
 
file system in operating system
file system in operating systemfile system in operating system
file system in operating system
tittuajay
 
File management
File managementFile management
File management
Vishal Singh
 
File Systems
File SystemsFile Systems
File Systems
Anil Kumar Pugalia
 
Operating Systems - File Management
Operating Systems -  File ManagementOperating Systems -  File Management
Operating Systems - File Management
Damian T. Gordon
 

Viewers also liked (12)

SoftwareONE Oracle Licensing Introduction 18.02.14
SoftwareONE Oracle Licensing Introduction 18.02.14SoftwareONE Oracle Licensing Introduction 18.02.14
SoftwareONE Oracle Licensing Introduction 18.02.14
 
Database Systems Concepts, 5th Ed
Database Systems Concepts, 5th EdDatabase Systems Concepts, 5th Ed
Database Systems Concepts, 5th Ed
 
Oracle database - The most common license compliance issues seen
Oracle database - The most common license compliance issues seenOracle database - The most common license compliance issues seen
Oracle database - The most common license compliance issues seen
 
Chapter01 introduction
Chapter01 introductionChapter01 introduction
Chapter01 introduction
 
Understanding software licensing with IBM Power Systems PowerVM virtualization
Understanding software licensing with IBM Power Systems PowerVM virtualizationUnderstanding software licensing with IBM Power Systems PowerVM virtualization
Understanding software licensing with IBM Power Systems PowerVM virtualization
 
Insight into Oracle licensing
Insight into Oracle licensingInsight into Oracle licensing
Insight into Oracle licensing
 
Fundamentals of Database system
Fundamentals of Database systemFundamentals of Database system
Fundamentals of Database system
 
Chapter 1 Fundamentals of Database Management System
Chapter 1 Fundamentals of Database Management SystemChapter 1 Fundamentals of Database Management System
Chapter 1 Fundamentals of Database Management System
 
file system in operating system
file system in operating systemfile system in operating system
file system in operating system
 
File management
File managementFile management
File management
 
File Systems
File SystemsFile Systems
File Systems
 
Operating Systems - File Management
Operating Systems -  File ManagementOperating Systems -  File Management
Operating Systems - File Management
 

Similar to IBM PowerVM Virtualization Technology on IBM POWER7 Systems

Virtualization Performance on the IBM PureFlex System
Virtualization Performance on the IBM PureFlex SystemVirtualization Performance on the IBM PureFlex System
Virtualization Performance on the IBM PureFlex System
IBM India Smarter Computing
 
Getting the MAX from your Virtualized Environment: Comprehensive Solutions fr...
Getting the MAX from your Virtualized Environment: Comprehensive Solutions fr...Getting the MAX from your Virtualized Environment: Comprehensive Solutions fr...
Getting the MAX from your Virtualized Environment: Comprehensive Solutions fr...
IBM India Smarter Computing
 
IBM-Power10-Brochure-Covenco.pdf
IBM-Power10-Brochure-Covenco.pdfIBM-Power10-Brochure-Covenco.pdf
IBM-Power10-Brochure-Covenco.pdf
Freelance Architect Informations systems
 
Harnessing the Power of vSphere
Harnessing the Power of vSphereHarnessing the Power of vSphere
Harnessing the Power of vSphere
IT Brand Pulse
 
Virtualization meisen 042811
Virtualization meisen 042811Virtualization meisen 042811
Virtualization meisen 042811
Morty Eisen
 
It's time to optimize
It's time to optimizeIt's time to optimize
It's time to optimize
IBM India Smarter Computing
 
IBM i for Midsize Businesses Minimizing Costs and Risks for Midsize Businesses
IBM i for Midsize Businesses Minimizing Costs and Risks for Midsize BusinessesIBM i for Midsize Businesses Minimizing Costs and Risks for Midsize Businesses
IBM i for Midsize Businesses Minimizing Costs and Risks for Midsize Businesses
IBM India Smarter Computing
 
Superior Cloud Economics with IBM Power Systems
Superior Cloud Economics with IBM Power SystemsSuperior Cloud Economics with IBM Power Systems
Superior Cloud Economics with IBM Power Systems
IBM Power Systems
 
White paper: IBM FlashSystems in VMware Environments
White paper: IBM FlashSystems in VMware EnvironmentsWhite paper: IBM FlashSystems in VMware Environments
White paper: IBM FlashSystems in VMware Environments
thinkASG
 
IBM BCFC White Paper - Why Choose IBM BladeCenter Foundation for Cloud
IBM BCFC White Paper - Why Choose IBM BladeCenter Foundation for CloudIBM BCFC White Paper - Why Choose IBM BladeCenter Foundation for Cloud
IBM BCFC White Paper - Why Choose IBM BladeCenter Foundation for Cloud
IBM India Smarter Computing
 
Choosing IBM Flex System for Your Private Cloud Infrastructure
Choosing IBM Flex System for Your Private Cloud InfrastructureChoosing IBM Flex System for Your Private Cloud Infrastructure
Choosing IBM Flex System for Your Private Cloud Infrastructure
IBM India Smarter Computing
 
Implementing hyperv
Implementing hypervImplementing hyperv
Implementing hyperv
Achmad Mahendra
 
Virtulaisation
VirtulaisationVirtulaisation
Virtulaisation
Srinivasa Rao
 
Exploring HCI
Exploring HCIExploring HCI
Exploring HCI
David Han
 
Top 5 reasons_to_choose_microsoft_hyper-v_r2_sp1_over_v_mware_v_sphere 5
Top 5 reasons_to_choose_microsoft_hyper-v_r2_sp1_over_v_mware_v_sphere 5Top 5 reasons_to_choose_microsoft_hyper-v_r2_sp1_over_v_mware_v_sphere 5
Top 5 reasons_to_choose_microsoft_hyper-v_r2_sp1_over_v_mware_v_sphere 5
Marcos Freccia
 
Top 5 reasons_to_choose_microsoft_hyper-v_r2_sp1_over_v_mware_v_sphere 5
Top 5 reasons_to_choose_microsoft_hyper-v_r2_sp1_over_v_mware_v_sphere 5Top 5 reasons_to_choose_microsoft_hyper-v_r2_sp1_over_v_mware_v_sphere 5
Top 5 reasons_to_choose_microsoft_hyper-v_r2_sp1_over_v_mware_v_sphere 5
Thiago Beier
 
Ibpstc30951 wdg ib_mbooklet
Ibpstc30951 wdg ib_mbookletIbpstc30951 wdg ib_mbooklet
Ibpstc30951 wdg ib_mbooklet
Bloombase
 
VMware on IBM Cloud Client Presentation
VMware on IBM Cloud Client PresentationVMware on IBM Cloud Client Presentation
VMware on IBM Cloud Client Presentation
Sumaya Erol
 
Ibm smarter data center at citi
Ibm smarter data center at citiIbm smarter data center at citi
Ibm smarter data center at citi
Friedel Jonker
 
CPU performance comparison of two cloud solutions: VMware vCloud Hybrid Servi...
CPU performance comparison of two cloud solutions: VMware vCloud Hybrid Servi...CPU performance comparison of two cloud solutions: VMware vCloud Hybrid Servi...
CPU performance comparison of two cloud solutions: VMware vCloud Hybrid Servi...
Principled Technologies
 

Similar to IBM PowerVM Virtualization Technology on IBM POWER7 Systems (20)

Virtualization Performance on the IBM PureFlex System
Virtualization Performance on the IBM PureFlex SystemVirtualization Performance on the IBM PureFlex System
Virtualization Performance on the IBM PureFlex System
 
Getting the MAX from your Virtualized Environment: Comprehensive Solutions fr...
Getting the MAX from your Virtualized Environment: Comprehensive Solutions fr...Getting the MAX from your Virtualized Environment: Comprehensive Solutions fr...
Getting the MAX from your Virtualized Environment: Comprehensive Solutions fr...
 
IBM-Power10-Brochure-Covenco.pdf
IBM-Power10-Brochure-Covenco.pdfIBM-Power10-Brochure-Covenco.pdf
IBM-Power10-Brochure-Covenco.pdf
 
Harnessing the Power of vSphere
Harnessing the Power of vSphereHarnessing the Power of vSphere
Harnessing the Power of vSphere
 
Virtualization meisen 042811
Virtualization meisen 042811Virtualization meisen 042811
Virtualization meisen 042811
 
It's time to optimize
It's time to optimizeIt's time to optimize
It's time to optimize
 
IBM i for Midsize Businesses Minimizing Costs and Risks for Midsize Businesses
IBM i for Midsize Businesses Minimizing Costs and Risks for Midsize BusinessesIBM i for Midsize Businesses Minimizing Costs and Risks for Midsize Businesses
IBM i for Midsize Businesses Minimizing Costs and Risks for Midsize Businesses
 
Superior Cloud Economics with IBM Power Systems
Superior Cloud Economics with IBM Power SystemsSuperior Cloud Economics with IBM Power Systems
Superior Cloud Economics with IBM Power Systems
 
White paper: IBM FlashSystems in VMware Environments
White paper: IBM FlashSystems in VMware EnvironmentsWhite paper: IBM FlashSystems in VMware Environments
White paper: IBM FlashSystems in VMware Environments
 
IBM BCFC White Paper - Why Choose IBM BladeCenter Foundation for Cloud
IBM BCFC White Paper - Why Choose IBM BladeCenter Foundation for CloudIBM BCFC White Paper - Why Choose IBM BladeCenter Foundation for Cloud
IBM BCFC White Paper - Why Choose IBM BladeCenter Foundation for Cloud
 
Choosing IBM Flex System for Your Private Cloud Infrastructure
Choosing IBM Flex System for Your Private Cloud InfrastructureChoosing IBM Flex System for Your Private Cloud Infrastructure
Choosing IBM Flex System for Your Private Cloud Infrastructure
 
Implementing hyperv
Implementing hypervImplementing hyperv
Implementing hyperv
 
Virtulaisation
VirtulaisationVirtulaisation
Virtulaisation
 
Exploring HCI
Exploring HCIExploring HCI
Exploring HCI
 
Top 5 reasons_to_choose_microsoft_hyper-v_r2_sp1_over_v_mware_v_sphere 5
Top 5 reasons_to_choose_microsoft_hyper-v_r2_sp1_over_v_mware_v_sphere 5Top 5 reasons_to_choose_microsoft_hyper-v_r2_sp1_over_v_mware_v_sphere 5
Top 5 reasons_to_choose_microsoft_hyper-v_r2_sp1_over_v_mware_v_sphere 5
 
Top 5 reasons_to_choose_microsoft_hyper-v_r2_sp1_over_v_mware_v_sphere 5
Top 5 reasons_to_choose_microsoft_hyper-v_r2_sp1_over_v_mware_v_sphere 5Top 5 reasons_to_choose_microsoft_hyper-v_r2_sp1_over_v_mware_v_sphere 5
Top 5 reasons_to_choose_microsoft_hyper-v_r2_sp1_over_v_mware_v_sphere 5
 
Ibpstc30951 wdg ib_mbooklet
Ibpstc30951 wdg ib_mbookletIbpstc30951 wdg ib_mbooklet
Ibpstc30951 wdg ib_mbooklet
 
VMware on IBM Cloud Client Presentation
VMware on IBM Cloud Client PresentationVMware on IBM Cloud Client Presentation
VMware on IBM Cloud Client Presentation
 
Ibm smarter data center at citi
Ibm smarter data center at citiIbm smarter data center at citi
Ibm smarter data center at citi
 
CPU performance comparison of two cloud solutions: VMware vCloud Hybrid Servi...
CPU performance comparison of two cloud solutions: VMware vCloud Hybrid Servi...CPU performance comparison of two cloud solutions: VMware vCloud Hybrid Servi...
CPU performance comparison of two cloud solutions: VMware vCloud Hybrid Servi...
 

More from IBM India Smarter Computing

Using the IBM XIV Storage System in OpenStack Cloud Environments
Using the IBM XIV Storage System in OpenStack Cloud Environments Using the IBM XIV Storage System in OpenStack Cloud Environments
Using the IBM XIV Storage System in OpenStack Cloud Environments
IBM India Smarter Computing
 
All-flash Needs End to End Storage Efficiency
All-flash Needs End to End Storage EfficiencyAll-flash Needs End to End Storage Efficiency
All-flash Needs End to End Storage Efficiency
IBM India Smarter Computing
 
TSL03104USEN Exploring VMware vSphere Storage API for Array Integration on th...
TSL03104USEN Exploring VMware vSphere Storage API for Array Integration on th...TSL03104USEN Exploring VMware vSphere Storage API for Array Integration on th...
TSL03104USEN Exploring VMware vSphere Storage API for Array Integration on th...
IBM India Smarter Computing
 
IBM FlashSystem 840 Product Guide
IBM FlashSystem 840 Product GuideIBM FlashSystem 840 Product Guide
IBM FlashSystem 840 Product Guide
IBM India Smarter Computing
 
IBM System x3250 M5
IBM System x3250 M5IBM System x3250 M5
IBM System x3250 M5
IBM India Smarter Computing
 
IBM NeXtScale nx360 M4
IBM NeXtScale nx360 M4IBM NeXtScale nx360 M4
IBM NeXtScale nx360 M4
IBM India Smarter Computing
 
IBM System x3650 M4 HD
IBM System x3650 M4 HDIBM System x3650 M4 HD
IBM System x3650 M4 HD
IBM India Smarter Computing
 
IBM System x3300 M4
IBM System x3300 M4IBM System x3300 M4
IBM System x3300 M4
IBM India Smarter Computing
 
IBM System x iDataPlex dx360 M4
IBM System x iDataPlex dx360 M4IBM System x iDataPlex dx360 M4
IBM System x iDataPlex dx360 M4
IBM India Smarter Computing
 
IBM System x3500 M4
IBM System x3500 M4IBM System x3500 M4
IBM System x3500 M4
IBM India Smarter Computing
 
IBM System x3550 M4
IBM System x3550 M4IBM System x3550 M4
IBM System x3550 M4
IBM India Smarter Computing
 
IBM System x3650 M4
IBM System x3650 M4IBM System x3650 M4
IBM System x3650 M4
IBM India Smarter Computing
 
IBM System x3500 M3
IBM System x3500 M3IBM System x3500 M3
IBM System x3500 M3
IBM India Smarter Computing
 
IBM System x3400 M3
IBM System x3400 M3IBM System x3400 M3
IBM System x3400 M3
IBM India Smarter Computing
 
IBM System x3250 M3
IBM System x3250 M3IBM System x3250 M3
IBM System x3250 M3
IBM India Smarter Computing
 
IBM System x3200 M3
IBM System x3200 M3IBM System x3200 M3
IBM System x3200 M3
IBM India Smarter Computing
 
IBM PowerVC Introduction and Configuration
IBM PowerVC Introduction and ConfigurationIBM PowerVC Introduction and Configuration
IBM PowerVC Introduction and Configuration
IBM India Smarter Computing
 
A Comparison of PowerVM and Vmware Virtualization Performance
A Comparison of PowerVM and Vmware Virtualization PerformanceA Comparison of PowerVM and Vmware Virtualization Performance
A Comparison of PowerVM and Vmware Virtualization Performance
IBM India Smarter Computing
 
IBM pureflex system and vmware vcloud enterprise suite reference architecture
IBM pureflex system and vmware vcloud enterprise suite reference architectureIBM pureflex system and vmware vcloud enterprise suite reference architecture
IBM pureflex system and vmware vcloud enterprise suite reference architecture
IBM India Smarter Computing
 
X6: The sixth generation of EXA Technology
X6: The sixth generation of EXA TechnologyX6: The sixth generation of EXA Technology
X6: The sixth generation of EXA Technology
IBM India Smarter Computing
 

More from IBM India Smarter Computing (20)

Using the IBM XIV Storage System in OpenStack Cloud Environments
Using the IBM XIV Storage System in OpenStack Cloud Environments Using the IBM XIV Storage System in OpenStack Cloud Environments
Using the IBM XIV Storage System in OpenStack Cloud Environments
 
All-flash Needs End to End Storage Efficiency
All-flash Needs End to End Storage EfficiencyAll-flash Needs End to End Storage Efficiency
All-flash Needs End to End Storage Efficiency
 
TSL03104USEN Exploring VMware vSphere Storage API for Array Integration on th...
TSL03104USEN Exploring VMware vSphere Storage API for Array Integration on th...TSL03104USEN Exploring VMware vSphere Storage API for Array Integration on th...
TSL03104USEN Exploring VMware vSphere Storage API for Array Integration on th...
 
IBM FlashSystem 840 Product Guide
IBM FlashSystem 840 Product GuideIBM FlashSystem 840 Product Guide
IBM FlashSystem 840 Product Guide
 
IBM System x3250 M5
IBM System x3250 M5IBM System x3250 M5
IBM System x3250 M5
 
IBM NeXtScale nx360 M4
IBM NeXtScale nx360 M4IBM NeXtScale nx360 M4
IBM NeXtScale nx360 M4
 
IBM System x3650 M4 HD
IBM System x3650 M4 HDIBM System x3650 M4 HD
IBM System x3650 M4 HD
 
IBM System x3300 M4
IBM System x3300 M4IBM System x3300 M4
IBM System x3300 M4
 
IBM System x iDataPlex dx360 M4
IBM System x iDataPlex dx360 M4IBM System x iDataPlex dx360 M4
IBM System x iDataPlex dx360 M4
 
IBM System x3500 M4
IBM System x3500 M4IBM System x3500 M4
IBM System x3500 M4
 
IBM System x3550 M4
IBM System x3550 M4IBM System x3550 M4
IBM System x3550 M4
 
IBM System x3650 M4
IBM System x3650 M4IBM System x3650 M4
IBM System x3650 M4
 
IBM System x3500 M3
IBM System x3500 M3IBM System x3500 M3
IBM System x3500 M3
 
IBM System x3400 M3
IBM System x3400 M3IBM System x3400 M3
IBM System x3400 M3
 
IBM System x3250 M3
IBM System x3250 M3IBM System x3250 M3
IBM System x3250 M3
 
IBM System x3200 M3
IBM System x3200 M3IBM System x3200 M3
IBM System x3200 M3
 
IBM PowerVC Introduction and Configuration
IBM PowerVC Introduction and ConfigurationIBM PowerVC Introduction and Configuration
IBM PowerVC Introduction and Configuration
 
A Comparison of PowerVM and Vmware Virtualization Performance
A Comparison of PowerVM and Vmware Virtualization PerformanceA Comparison of PowerVM and Vmware Virtualization Performance
A Comparison of PowerVM and Vmware Virtualization Performance
 
IBM pureflex system and vmware vcloud enterprise suite reference architecture
IBM pureflex system and vmware vcloud enterprise suite reference architectureIBM pureflex system and vmware vcloud enterprise suite reference architecture
IBM pureflex system and vmware vcloud enterprise suite reference architecture
 
X6: The sixth generation of EXA Technology
X6: The sixth generation of EXA TechnologyX6: The sixth generation of EXA Technology
X6: The sixth generation of EXA Technology
 

Recently uploaded

Main news related to the CCS TSI 2023 (2023/1695)
Main news related to the CCS TSI 2023 (2023/1695)Main news related to the CCS TSI 2023 (2023/1695)
Main news related to the CCS TSI 2023 (2023/1695)
Jakub Marek
 
Artificial Intelligence for XMLDevelopment
Artificial Intelligence for XMLDevelopmentArtificial Intelligence for XMLDevelopment
Artificial Intelligence for XMLDevelopment
Octavian Nadolu
 
Programming Foundation Models with DSPy - Meetup Slides
Programming Foundation Models with DSPy - Meetup SlidesProgramming Foundation Models with DSPy - Meetup Slides
Programming Foundation Models with DSPy - Meetup Slides
Zilliz
 
AI 101: An Introduction to the Basics and Impact of Artificial Intelligence
AI 101: An Introduction to the Basics and Impact of Artificial IntelligenceAI 101: An Introduction to the Basics and Impact of Artificial Intelligence
AI 101: An Introduction to the Basics and Impact of Artificial Intelligence
IndexBug
 
Your One-Stop Shop for Python Success: Top 10 US Python Development Providers
Your One-Stop Shop for Python Success: Top 10 US Python Development ProvidersYour One-Stop Shop for Python Success: Top 10 US Python Development Providers
Your One-Stop Shop for Python Success: Top 10 US Python Development Providers
akankshawande
 
WeTestAthens: Postman's AI & Automation Techniques
WeTestAthens: Postman's AI & Automation TechniquesWeTestAthens: Postman's AI & Automation Techniques
WeTestAthens: Postman's AI & Automation Techniques
Postman
 
Monitoring and Managing Anomaly Detection on OpenShift.pdf
Monitoring and Managing Anomaly Detection on OpenShift.pdfMonitoring and Managing Anomaly Detection on OpenShift.pdf
Monitoring and Managing Anomaly Detection on OpenShift.pdf
Tosin Akinosho
 
How to Get CNIC Information System with Paksim Ga.pptx
How to Get CNIC Information System with Paksim Ga.pptxHow to Get CNIC Information System with Paksim Ga.pptx
How to Get CNIC Information System with Paksim Ga.pptx
danishmna97
 
OpenID AuthZEN Interop Read Out - Authorization
OpenID AuthZEN Interop Read Out - AuthorizationOpenID AuthZEN Interop Read Out - Authorization
OpenID AuthZEN Interop Read Out - Authorization
David Brossard
 
Serial Arm Control in Real Time Presentation
Serial Arm Control in Real Time PresentationSerial Arm Control in Real Time Presentation
Serial Arm Control in Real Time Presentation
tolgahangng
 
Building Production Ready Search Pipelines with Spark and Milvus
Building Production Ready Search Pipelines with Spark and MilvusBuilding Production Ready Search Pipelines with Spark and Milvus
Building Production Ready Search Pipelines with Spark and Milvus
Zilliz
 
How to Interpret Trends in the Kalyan Rajdhani Mix Chart.pdf
How to Interpret Trends in the Kalyan Rajdhani Mix Chart.pdfHow to Interpret Trends in the Kalyan Rajdhani Mix Chart.pdf
How to Interpret Trends in the Kalyan Rajdhani Mix Chart.pdf
Chart Kalyan
 
20240609 QFM020 Irresponsible AI Reading List May 2024
20240609 QFM020 Irresponsible AI Reading List May 202420240609 QFM020 Irresponsible AI Reading List May 2024
20240609 QFM020 Irresponsible AI Reading List May 2024
Matthew Sinclair
 
みなさんこんにちはこれ何文字まで入るの?40文字以下不可とか本当に意味わからないけどこれ限界文字数書いてないからマジでやばい文字数いけるんじゃないの?えこ...
みなさんこんにちはこれ何文字まで入るの?40文字以下不可とか本当に意味わからないけどこれ限界文字数書いてないからマジでやばい文字数いけるんじゃないの?えこ...みなさんこんにちはこれ何文字まで入るの?40文字以下不可とか本当に意味わからないけどこれ限界文字数書いてないからマジでやばい文字数いけるんじゃないの?えこ...
みなさんこんにちはこれ何文字まで入るの?40文字以下不可とか本当に意味わからないけどこれ限界文字数書いてないからマジでやばい文字数いけるんじゃないの?えこ...
名前 です男
 
5th LF Energy Power Grid Model Meet-up Slides
5th LF Energy Power Grid Model Meet-up Slides5th LF Energy Power Grid Model Meet-up Slides
5th LF Energy Power Grid Model Meet-up Slides
DanBrown980551
 
Fueling AI with Great Data with Airbyte Webinar
Fueling AI with Great Data with Airbyte WebinarFueling AI with Great Data with Airbyte Webinar
Fueling AI with Great Data with Airbyte Webinar
Zilliz
 
UiPath Test Automation using UiPath Test Suite series, part 6
UiPath Test Automation using UiPath Test Suite series, part 6UiPath Test Automation using UiPath Test Suite series, part 6
UiPath Test Automation using UiPath Test Suite series, part 6
DianaGray10
 
Taking AI to the Next Level in Manufacturing.pdf
Taking AI to the Next Level in Manufacturing.pdfTaking AI to the Next Level in Manufacturing.pdf
Taking AI to the Next Level in Manufacturing.pdf
ssuserfac0301
 
UI5 Controls simplified - UI5con2024 presentation
UI5 Controls simplified - UI5con2024 presentationUI5 Controls simplified - UI5con2024 presentation
UI5 Controls simplified - UI5con2024 presentation
Wouter Lemaire
 
GraphRAG for Life Science to increase LLM accuracy
GraphRAG for Life Science to increase LLM accuracyGraphRAG for Life Science to increase LLM accuracy
GraphRAG for Life Science to increase LLM accuracy
Tomaz Bratanic
 

Recently uploaded (20)

Main news related to the CCS TSI 2023 (2023/1695)
Main news related to the CCS TSI 2023 (2023/1695)Main news related to the CCS TSI 2023 (2023/1695)
Main news related to the CCS TSI 2023 (2023/1695)
 
Artificial Intelligence for XMLDevelopment
Artificial Intelligence for XMLDevelopmentArtificial Intelligence for XMLDevelopment
Artificial Intelligence for XMLDevelopment
 
Programming Foundation Models with DSPy - Meetup Slides
Programming Foundation Models with DSPy - Meetup SlidesProgramming Foundation Models with DSPy - Meetup Slides
Programming Foundation Models with DSPy - Meetup Slides
 
AI 101: An Introduction to the Basics and Impact of Artificial Intelligence
AI 101: An Introduction to the Basics and Impact of Artificial IntelligenceAI 101: An Introduction to the Basics and Impact of Artificial Intelligence
AI 101: An Introduction to the Basics and Impact of Artificial Intelligence
 
Your One-Stop Shop for Python Success: Top 10 US Python Development Providers
Your One-Stop Shop for Python Success: Top 10 US Python Development ProvidersYour One-Stop Shop for Python Success: Top 10 US Python Development Providers
Your One-Stop Shop for Python Success: Top 10 US Python Development Providers
 
WeTestAthens: Postman's AI & Automation Techniques
WeTestAthens: Postman's AI & Automation TechniquesWeTestAthens: Postman's AI & Automation Techniques
WeTestAthens: Postman's AI & Automation Techniques
 
Monitoring and Managing Anomaly Detection on OpenShift.pdf
Monitoring and Managing Anomaly Detection on OpenShift.pdfMonitoring and Managing Anomaly Detection on OpenShift.pdf
Monitoring and Managing Anomaly Detection on OpenShift.pdf
 
How to Get CNIC Information System with Paksim Ga.pptx
How to Get CNIC Information System with Paksim Ga.pptxHow to Get CNIC Information System with Paksim Ga.pptx
How to Get CNIC Information System with Paksim Ga.pptx
 
OpenID AuthZEN Interop Read Out - Authorization
OpenID AuthZEN Interop Read Out - AuthorizationOpenID AuthZEN Interop Read Out - Authorization
OpenID AuthZEN Interop Read Out - Authorization
 
Serial Arm Control in Real Time Presentation
Serial Arm Control in Real Time PresentationSerial Arm Control in Real Time Presentation
Serial Arm Control in Real Time Presentation
 
Building Production Ready Search Pipelines with Spark and Milvus
Building Production Ready Search Pipelines with Spark and MilvusBuilding Production Ready Search Pipelines with Spark and Milvus
Building Production Ready Search Pipelines with Spark and Milvus
 
How to Interpret Trends in the Kalyan Rajdhani Mix Chart.pdf
How to Interpret Trends in the Kalyan Rajdhani Mix Chart.pdfHow to Interpret Trends in the Kalyan Rajdhani Mix Chart.pdf
How to Interpret Trends in the Kalyan Rajdhani Mix Chart.pdf
 
20240609 QFM020 Irresponsible AI Reading List May 2024
20240609 QFM020 Irresponsible AI Reading List May 202420240609 QFM020 Irresponsible AI Reading List May 2024
20240609 QFM020 Irresponsible AI Reading List May 2024
 
みなさんこんにちはこれ何文字まで入るの?40文字以下不可とか本当に意味わからないけどこれ限界文字数書いてないからマジでやばい文字数いけるんじゃないの?えこ...
みなさんこんにちはこれ何文字まで入るの?40文字以下不可とか本当に意味わからないけどこれ限界文字数書いてないからマジでやばい文字数いけるんじゃないの?えこ...みなさんこんにちはこれ何文字まで入るの?40文字以下不可とか本当に意味わからないけどこれ限界文字数書いてないからマジでやばい文字数いけるんじゃないの?えこ...
みなさんこんにちはこれ何文字まで入るの?40文字以下不可とか本当に意味わからないけどこれ限界文字数書いてないからマジでやばい文字数いけるんじゃないの?えこ...
 
5th LF Energy Power Grid Model Meet-up Slides
5th LF Energy Power Grid Model Meet-up Slides5th LF Energy Power Grid Model Meet-up Slides
5th LF Energy Power Grid Model Meet-up Slides
 
Fueling AI with Great Data with Airbyte Webinar
Fueling AI with Great Data with Airbyte WebinarFueling AI with Great Data with Airbyte Webinar
Fueling AI with Great Data with Airbyte Webinar
 
UiPath Test Automation using UiPath Test Suite series, part 6
UiPath Test Automation using UiPath Test Suite series, part 6UiPath Test Automation using UiPath Test Suite series, part 6
UiPath Test Automation using UiPath Test Suite series, part 6
 
Taking AI to the Next Level in Manufacturing.pdf
Taking AI to the Next Level in Manufacturing.pdfTaking AI to the Next Level in Manufacturing.pdf
Taking AI to the Next Level in Manufacturing.pdf
 
UI5 Controls simplified - UI5con2024 presentation
UI5 Controls simplified - UI5con2024 presentationUI5 Controls simplified - UI5con2024 presentation
UI5 Controls simplified - UI5con2024 presentation
 
GraphRAG for Life Science to increase LLM accuracy
GraphRAG for Life Science to increase LLM accuracyGraphRAG for Life Science to increase LLM accuracy
GraphRAG for Life Science to increase LLM accuracy
 

IBM PowerVM Virtualization Technology on IBM POWER7 Systems

  • 1. 89 Fifth Avenue, 7th Floor New York, NY 10003 www.TheEdison.com 212.367.7400 White Paper IBM PowerVM Virtualization Technology on IBM POWER7 Systems A Comparison of PowerVM and VMware vSphere (4.1 & 5.0) Virtualization Performance
  • 2. Printed in the United States of America Copyright  2011 Edison Group, Inc. New York. Edison Group offers no warranty either expressed or implied on the information contained herein and shall be held harmless for errors resulting from its use. All products are trademarks of their respective owners. First Publication: September 2011; Second Publication: January, 2012 Produced by: Craig Norris, Sr Analyst; Barry Cohen, Editor-in-Chief; Manny Frishberg, Editor This document was developed with IBM funding. Although the document may utilize publicly available material from various vendors, including IBM, it does not necessarily reflect the positions of such vendors on the issues addressed in this document.
  • 3. Table of Contents Executive Summary ..................................................................................................................... 1 Introduction .................................................................................................................................. 3 Objective .................................................................................................................................. 3 Audience.................................................................................................................................. 3 Contents of this Report.......................................................................................................... 3 The Business Value of Virtualization...................................................................................... 4 Benchmark Comparison Study: PowerVM vs. VMware...................................................... 6 AIM7 Benchmark.................................................................................................................... 6 TPoX Benchmark.................................................................................................................. 10 Summary of Results ............................................................................................................. 20 IBM’s Virtualization Infrastructure: POWER7 Systems .................................................... 21 PowerVM............................................................................................................................... 22 Processor Virtualization ...................................................................................................... 22 Memory Virtualization ........................................................................................................ 23 I/O Virtualization.................................................................................................................. 23 Partition Mobility ................................................................................................................. 23 Partition Hibernation........................................................................................................... 23 Workload Partitioning......................................................................................................... 24 Systems Management .......................................................................................................... 24 PowerVM Advantages......................................................................................................... 25 Conclusions................................................................................................................................. 28 Appendices.................................................................................................................................. 31 Appendix 1 — Benchmark Configuration Information ........................................................ 31 Appendix 2 — General Benchmark Descriptions .................................................................. 34 Addendum................................................................................................................................... 35
  • 4. Edison: IBM – Virtualization Performance White Paper Page 1 Executive Summary Today’s business organizations need to rein in IT costs without sacrificing performance, security, reliability, and flexibility. A new era has emerged in which it is now possible, through intelligent and strategic use of new and/or advanced technology, to achieve breakthrough economics, considerably reducing the cost of delivering the workloads central to a business’s operation. IBM has aggressively been making pioneering strides in IT infrastructure, harnessing trends and innovation to deliver top-notch functionality with great efficiency for considerable data center savings. IBM's Smarter Computing initiative has helped many forward-thinking organizations design, tune, and manage their IT infrastructures to make them designed for data, tuned to the task, and managed in the cloud. A cornerstone of this initiative is a move toward architectures optimized for specific purposes and built around deep domain knowledge. The goals here are to reduce deployment times for systems from months to days, improve performance with utilization rates of up to 90 percent, and to reduce floor space, power consumption, labor, and total cost per workload. The key technology advancement harnessed to achieve these goals is server consolidation through virtualization. Using virtualization to consolidate data center servers has become an integral component of how successful companies design their IT systems. However, the majority of businesses fall far short of realizing the full potential of server consolidation. On average, consolidation ratios are only around six virtual machines (VMs) per physical server. Even world-class organizations are only consolidating at a ratio of about 18 to 1 at best. Much higher VM densities are possible without degrading system performance, significantly reducing data center consolidation expenses and yielding a considerable economic advantage to organizations. Under the banner of “Power is performance redefined,” IBM has introduced an impressive profile of servers with the 2010 launch and 2011 release of Power Systems servers and blades. These products are based on the IBM POWER7 processor architecture, ranging from 2-socket to 32-socket with up to 256 cores. To evaluate what IBM’s virtualization technology can offer clients, Edison Group was engaged to help provide a clear understanding of the benefits that can be seen when organizations implement virtualization technology as part of their IT environment. IBM virtualization technologies support a server virtualization ratio of 1,000 to 1, outdoing competitors and providing for massive data center consolidation. Clients using
  • 5. Edison: IBM – Virtualization Performance White Paper Page 2 POWER7 systems and PowerVM virtualization technology achieve higher operational savings by using greater VM density. Many of the advantages stem from the fact that PowerVM technology is built directly into the firmware of all Power Systems servers. The widely-deployed VMware vSphere and other x86-based virtualization products are typically third-party software add-ons, sold and installed separately. This technical white paper presents benchmark results showing greater VM consolidation ratios than demonstrated in previous benchmarks and demonstrating the extent of the performance lead that PowerVM virtualization technologies deliver over x86-based add-on virtualization products. The tests, running two workload benchmarks of different consolidation ratios on POWER7 processor-based and comparable Intel- based systems, demonstrate the exceptional performance and scalability of PowerVM virtualization technologies compared to VMware vSphere1 on an x86-based platform. Key findings include the following:  PowerVM technology on an IBM Power 750 system performs up to 131 percent better than VMware vSphere in whole core configuration with a consolidation ratio of 32 to 1.  PowerVM on Power 750 outperforms VMware by up to 525 percent when running multiple VMs and workloads, despite the test Intel x86 system (Westmere-EX) containing a greater number of cores (40 versus 32).  PowerVM technology on a 4-socket IBM Power 750 system demonstrated linear scaling, with 50 percent more absolute throughput performance compared to VMware vSphere.  In terms of throughput performance, vSphere 5 demonstrated no improvement over vSphere 4.1 update 1; in fact, it demonstrated slightly lower performance overall. The benchmark results clearly reveal that PowerVM virtualization technology on POWER7 processor-based platforms offers greater performance than that offered by VMware vSphere on Intel x86 platforms. They enable high consolidation ratios, broader scalability, and increased flexibility for a far superior virtualization solution. PowerVM virtualization technology on POWER7 processor-based platforms not only uses system resources in shared processor mode more efficiently, but also delivers superior performance when resources are over-committed with a higher consolidation ratio. Together they establish PowerVM virtualization technology as the consolidation system of choice for organizations wishing to realize the full advantages of greater VM density. 1 For results of comparison benchmarks with VMware vSphere 5, see the Addendum to this study.
  • 6. Edison: IBM – Virtualization Performance White Paper Page 3 Introduction Objective The objective of this white paper is to compare the performance of PowerVM virtualization technologies on POWER7 processor-based server platforms against VMware vSphere on comparable Intel x86 platforms. It describes tests using industry- standard benchmarks to compare virtualization technologies. The results were reviewed, analyzed, and presented by Edison Group. Audience This paper is intended for anyone interested in the advantages of server consolidation through virtualization. IT managers, CIOs, system architects, and others will find valuable information that will help them further enhance and adopt virtualization technology within their IT environments. Contents of this Report This white paper contains the following major sections:  The Business Value of Virtualization — This section discusses the business value propositions underlying the benchmark evaluations presented in this paper.  Benchmark Comparison Study: PowerVM Virtualization Technology vs. VMware vSphere 4.1 update 1 — This section presents the comparative testing, describing the test bed setup, the benchmarks, the actual tests, and the results of the tests.  IBM’s Virtualization Infrastructure: POWER7 Processor-Based Systems — This section describes the Power Systems virtualization infrastructure, its components, and its advantages.  Appendices — The appendices contain configuration information and general descriptions for the benchmarks used in the tests discussed in this paper  Addendum — Benchmark Comparison Study: PowerVM Virtualization Technology vs. VMware vSphere 5 — This section presents the comparative results with VMware vSphere 5 on an HP ProLiant DL580 G7 E7-4870 server — which features the X5600-series Xeon (Westmere-EX) chip architecture.
  • 7. Edison: IBM – Virtualization Performance White Paper Page 4 The Business Value of Virtualization Inefficiencies have cropped up in data center operations as applications, workloads, and data have multiplied. These include: underutilization of server processor capacity, memory bottlenecks that restrict performance, server sprawl and its related difficulties in deployment and management, as well as higher energy bills from excessive power demands. Such inefficiencies increase costs, both through expenditures for equipment purchases and licensing, as well as through greater demands on administrative staff resources, etc. Virtualization technologies allow IT organizations to consolidate workloads running on multiple operating systems and software stacks, and to dynamically allocate platform resources to meet specific business and application requirements. Server virtualization, the foundation platform for today’s data center, is quickly reaching maturity. More than half of business server workloads are now deployed on virtual machines. According to IDC, 2 virtualization has become the default build for new server installations, driving down costs and establishing the foundation for more efficient and flexible configurations and technology platforms. The average size of virtualized workloads increased threefold between 2006 and 2009. The performance of virtualization is a critical factor to realize success of server pools and cloud computing (and is also a key component in IBM’s roadmap in its Smarter Computing initiative). Well-implemented virtualization solutions may be employed to:  Reduce hardware expenditures by consolidating multiple environments, including underutilized servers, and systems with varied and dynamic resource requirements.  Reduce costs for power and cooling, floor space, hardware maintenance, and software licensing.  Grow and shrink resources dynamically according to business needs.  Deploy new workloads through provisioning VMs or new systems rapidly to meet changing business demands.  Develop and test applications in secure, independent domains while allocating production to its own domain on the same system.  Transfer live workloads to support server migrations, balance system load, or avoid planned downtime that can otherwise adversely impact productivity.  Control server sprawl, reducing system management costs. 2 The Value of Memory-Dense Servers: IBM’s System x MAX5 for its eX5 Server Family, March 2010, IDC
  • 8. Edison: IBM – Virtualization Performance White Paper Page 5 Despite this, the majority of businesses fall far short of seizing upon the full potential of server consolidation. Their average consolidation ratio hovers around six VMs per server,3 yet economic advantages from data center consolidation increase significantly at much higher VM densities. By increasing the consolidation ratio per system, businesses can reduce capital expenditures and operational costs by reducing the number of systems in their data center or IT organization. IBM’s Smarter Computing systems, which allow for greater VM density without degrading system performance, can deliver considerable economic advantages to organizations using them. This study examines the performance and scaling aspects of PowerVM and VMware vSphere virtualization at high consolidation ratios (32:1 and 40:1) across two different commonly employed industry benchmarks (AIM7 and TpoX). The case of 40:1 consolidation ratio — “five virtual machines per core”— was mapped to achieve a higher amount of compression than the client deployment consolidation ratio surveyed in 2010.4 3 According to a recent Aberdeen Group report, Best-in-Class Practices for Virtualizing Microsoft Applications, August 2010, even the best-in-class organizations in the study consolidate at only an 18:1 ratio. 4 http://www.networkworld.com/news/2010/121510-vmware-server.html
  • 9. Edison: IBM – Virtualization Performance White Paper Page 6 Benchmark Comparison Study: PowerVM vs. VMware vSphere 4.1 update 1 AIM7 Benchmark AIM7 is a well-known open source benchmark. It is widely used by UNIX computer system vendors to compare system performance. It comprises three pre-defined tests suites (compute, multi-user, and database). Each suite is a mix of compute-, memory- and I/O-intensive atomic tests covering a wide range of operations. AIM7 also stresses the guest operating system’s kernel performance within virtualized environments. The testing described in this paper used the compute server test suite. Methodology For AIM7 scaling tests, all 32 available cores were used to scale from one to 32 virtual machines on both platforms. The Power Linux version used on PowerVM virtualization technology was SuSE 11 SP1, while SuSE 11 SP1 x86_64 version was used as guest OS on VMware vSphere 4.1 update 1. (Configuration details of the tests are in the appendices.) Results AIM7 was scaled in one, two, four, eight, 16, and 32 virtual machines (each virtual machine having one virtual processor). Scaling was close to linear on both the POWER7 processor-/PowerVM technology-based systems and the Intel/VMware vSphere 4.1 update 1 platforms. The tests were run at close to 100 percent utilization to measure the absolute performance of AIM7 in each VM configuration. POWER7 processor-/PowerVM technology-based systems demonstrated more than two times (110 percent) better performance than Intel/VMware vSphere 4.1 update 1 at one, two, four, eight, and 16 VM configurations, while at 32 VM, PowerVM technology demonstrated a 115 percent advantage (Figure 1). NOTE: The VM configuration and the test results can be found in the tables following the graphs for each test in this paper, starting with Figure 1. Table 1 shows the details on throughput and CPU utilization for each configuration. In this test, the VMs on both platforms were configured as close to identically as possible. In the case of PowerVM, each logical partitioning (LPAR) was given one core entitlement, one vCPU (virtual CPU), and 3 GB RAM; in the case of VMware vSphere 4.1
  • 10. Edison: IBM – Virtualization Performance White Paper Page 7 update 1, each VM was given one vCPU and 3 GB RAM, with the remainder left at default options. Figure 1. AIM7 Benchmark Virtual Machine Scaling Performance System Configuration for AIM7 Benchmark (1 to 32 VM Scaling) # of VMs Total Virtual CPUs % CPU Utilization Jobs / min IBM Power 750 3.5 GHz DPSM mode, 4 sockets, 512 GB RAM, SMT4 enabled, PowerVM and SLES11 SP1 (Power Linux) 1 1 94.6 19048.5 2 2 94.3 38120.5 4 4 97.8 76189.5 8 8 94.6 152249.8 16 16 98 303983.8 32 32 96.9 603085.1 HP ProLiant DL580 G7, 2.26 GHz, 8 cores / 24 MB cache (4 sockets Intel Xeon 7560 Processors, 512 GB system RAM, (HT and Turbo enabled in BIOS Intel VTx with EPT HW virtualization assist) VMware vSphere 4.1, SLES11 SP1 (GA x86_64) 1 1 100 9068.6 2 2 99.89 18137.2 4 4 94.15 36180.1 8 8 100 72398.3 16 16 92.5 144365.4 32 32 95.2 280726.8 Table 1. AIM7 Benchmark Multiple Virtual Machine Scaling Results
  • 11. Edison: IBM – Virtualization Performance White Paper Page 8 PowerVM and VMware vSphere technologies differ in the way they map a physical processor to a virtual processor. PowerVM virtualization technology maps all four threads of a core (SMT4, introduced with POWER7 processor-based systems) to a virtual processor. So, PowerVM technology leveraged POWER7 SMT4 technology with one vCPU configuration. VMware vSphere maps one of the two threads of a core (Intel’s HT technology) to a virtual processor. Therefore, VMware vSphere 4.1 update 1 was not able to leverage Intel’s HT technology with one vCPU configuration per VM. The tests on VMware vSphere 4.1 update 1 were thus repeated with two vCPU per VM configuration in order to observe performance with two threads running on a core. Because the VMware vSphere 4.1 update 1 VM was reconfigured to have two virtual processors, the test team wished to ensure that each VM was assigned a core to match with PowerVM technology. So, CPU affinity was used to assign two threads (the primary and secondary thread of a core) to two virtual processors of each VM.5 This set of tests was a fair comparison with PowerVM test results, since it allowed the workload to consume all the capacity of the system in a manner similar to POWER/PowerVM technology. The results of the second test are shown below (Figure 2). The second test results with two vCPU reveal that results for the Intel Xeon processor running VMware vSphere 4.1 update 1 had improved, but still lagged behind POWER/PowerVM results. In each of the tests, PowerVM technology still demonstrated up to 59 percent higher throughput performance than Intel 7560 /VMware vSphere 4.1 update 1, at close to 100 percent utilization. Power 750/PowerVM technology demonstrated higher AIM7 throughput performance than the HP system with Intel 7560 processor using VMware technologies. Many factors contributed to this superior performance, including: PowerVM technology efficiency, IBM POWER7 SMT4 technology, and IBM POWER7 processor core frequency (specifically, the fact that IBM POWER7 technology supports higher frequency with the same processor capacity than does Intel Xeon technology). 5 That is, one vCPU of a VM was assigned to an even number logical processor, and a second vCPU of a VM was assigned to an odd number logical processor. For example, the first vCPU of the first VM was assigned to logical cpu0, and the second vCPU of the first VM was assigned to logical cpu1, so that all the primary and secondary threads of cores were consumed by the workload running on that VM.
  • 12. Edison: IBM – Virtualization Performance White Paper Page 9 Figure 2. AIM7 Benchmark Multiple Virtual Machine Scaling with two vCPU for VMware vSphere 4.1 update 1 System Configuration for AIM7 Benchmark (1 to 32 VM Scaling) # of VMs Total Virtual CPUs % CPU Utilization Jobs / min IBM Power 750 3.5 GHz DPSM mode, 4 sockets, 512 GB RAM, SMT4 enabled, PowerVM and SLES11SP1 (Power Linux) 1 1 94.6 19048.5 2 2 94.3 38120.5 4 4 97.8 76189.5 8 8 94.6 152249.8 16 16 98 303983.8 32 32 96.9 603085.1 HP ProLiant DL580 G7, 2.26 GHz, 8 cores / 24 MB cache (4 sockets) Intel Xeon 7560 Processors, 512 GB system RAM, (HT and Turbo enabled in BIOS Intel VTx with EPT HW virtualization assist),VMware vSphere 4.1, SLES11 SP1 (GA x86_64) 1 2 95.19 12274.8 2 4 99.67 24351.7 4 8 95.75 48671.4 8 16 95.32 97531.6 16 32 99.8 190598.1 32 64 92.09 379976.1 Table 2. AIM7 Benchmark Multiple Virtual Machine Scaling with two vCPU for VMware vSphere 4.1 update 1
  • 13. Edison: IBM – Virtualization Performance White Paper Page 10 TPoX Benchmark TPoX (Transaction Processing over XML) is an application-level “XML database” benchmark based on a financial application scenario. It simulates an actual application that performs queries, inserts, updates, and deletes in a concurrent multi-user workload. It is an XML OLTP benchmark using data-oriented XML structures, very large numbers of relatively small XML documents (1 kb to 20 kb), short read/write transactions, and a high degree of concurrency. It models a security-trading scenario that uses a real-world XML Schema (FIXML). TPoX is an open-source benchmark developed by IBM in collaboration with Intel and others. It is available at: http://tpox.sourceforge.net/tpoxresults.htm 6 A database application, TPoX stresses CPU, memory, and storage I/O; however, in a multi-VM environment, this benchmark also stresses the virtualization infrastructure supporting these resources on both platforms. Methodology The next set of tests was conducted using the TPoX benchmark. These tests involve a higher degree of processor contention, using a VM-to-core ratio of 5:1. Because of this increased ratio, the shared pool configuration was reduced in these tests to eight cores on both platforms, in order to limit the maximum VMs to 40 on each platform. The TPoX benchmark is I/O-intensive and its performance is dependent on storage performance. Identical storage subsystems were used on both of the VM platforms. A logical array (12 spindles) with RAID5 was used to host four VMs on each in order to avoid I/O blender 7. Both the data and logs for the database are configured on the same set of disks in order to simplify the configuration for hosting 40 VMs. Each VM used a 1 GB database in order to match up with each VM’s CPU (0.2 core) and memory capacity (3 GB). A single-tier TPoX configuration was chosen for each VM where the client and the database reside in the same VM. The VM configuration has multiple options on both PowerVM and VMware vSphere technologies8 6 Reference: http://nativexmldatabase.com/2011/03/04/new-tpox-benchmark-results-available/ 7 http://www.networkworld.com/news/2010/102510-burning-questions-virtualization-storage.html 8 On PowerVM, each VM was configured with 0.2 core/one vCPU/uncapped mode/3 GB RAM with shared processor pool allocated with one, two, four and eight cores (up to one socket) for five-VM, 10-VM, 20- VM, and 40-VM, respectively. There were three dedicated LPARs configured to consume the other three sockets on Power 750 system. On VMware, two sets of configurations were used; the first set includes a configuration where each VM was given one vCPU/20 percent of a core — 452 MHz limit/4 GB RAM, and
  • 14. Edison: IBM – Virtualization Performance White Paper Page 11 Results The database for each VM on each of the platforms was populated with the same configuration set. The transaction rate for populating the database is shown in Table 3. Power 750/PowerVM HP DL580G7/ VMware vSphere 4.1 update 1 1vCPU Order (inserts per second) 1,591 746 Custacc (inserts per second) 684 271 Table 3. TPoX Database Populated Rate for First Configuration Set As these results indicate, the performance rate for populating the database is two to two- and-a-half times better for POWER/PowerVM technology than with Intel Xeon 7560 /VMware vSphere 4.1 update 1. Figure 3, below, presents results demonstrating that the transactions throughput performance on POWER/PowerVM technology is as much as three times better than Intel Xeon 7560 /VMware vSphere 4.1 update 1. 9 Figure 3. TPoX Benchmark Results in 40:1 Consolidation Ratio Table 4 presents detailed information on the total number of TPoX users used in each test, pool utilization, throughput, and VM configuration for each tests. advanced shared panel settings that included 1) hyperthread core sharing and, 2) scheduling affinity set to 0-15 (logical processors). The idea was to run five VMs on a single core; with five vCPUs the entire core should be utilized in hyperthreading mode. 9 Because processor utilization in the first VMware configuration set made it harder to report total percentage, in this case pool utilization was used. With a single virtual processor per VM, it would not be realistic to map to either a primary or secondary thread per VM. For example, in the five-VM test, where the goal was to use 20 percent of a core, binding a VM could be done either to a primary or to a secondary thread, in which case some VMs would be running on primary and others would running on secondary. Thus, the decision was made to use the pool to assign cpu0 to cpu15 for all the tests. At a lower number of VMs, VMware used around 20 percent from each of the cores in the pool; at 40 VMs the pool utilization matched with PowerVM as it is shown in Figure 3.
  • 15. Edison: IBM – Virtualization Performance White Paper Page 12 System Configuration for TPoX Benchmark (1 to 40 VM Scaling) # of VMs Total Virtual CPUs Total # of TPoX Users % Pool Utilization Transactions per second IBM Power 750 3.5 GHz DPSM mode, 4 sockets, 512 GB RAM, SMT4 enabled, PowerVM, AIX 7.1 is the host OS for each VM. VIOS is configured with 0.2 core/1 vCPU/ uncapped mode/ 4 GB RAM. Each LPAR is configured with 1 vCPU/ uncapped/3 GB RAM 3 LPARs have 0.2 cores and 2 LPARs have 0.1 core Shared pool has one core 5 5 50 12.5 612.2 8 LPARs are configured each with 0.2/1 vCPU/ uncapped/ 3 GB memory, 2 LPARs are configured with 0.1/1 vCPU/uncapped/3 GB memory, vios has 0.2/1 vCPU/uncapped/4 GB memory. Shared pool has two cores 10 10 100 24.5 1155 18 LPARs are configured each with 0.2/1 vCPU/ uncapped/ 3 GB memory, 2 LPARs are configured with 0.1/1 vCPU/uncapped/3 GB memory, vios has 0.2/1 vCPU/uncapped/4 GB memory. Shared pool has four cores 20 20 200 49 2137 38 LPARs configured with 0.2core/ 1vCPU/uncapped and 2 LPARs configured with 0.1core/1vCPU/ uncapped. Shared pool has eight cores 40 40 400 98 4169.8 HP ProLiant DL580 G7, 2.26 GHz, eight cores / 24 MB cache (4 sockets) Intel Xeon 7560 Processors, 512 GB system RAM (HT and Turbo enabled in BIOS Intel VTx with EPT HW virtualization assist) VMware vSphere 4.1 update1. Each VM has guest OS RHEL6 GA. Each VM is given 0.2 of a core/1 vCPU/3 GB memory. DB2 buffer pool for data is configured in each VM. Schedule affinity is set to cpu0 and cpu1. 5 5 50 21.8 203.18 Schedule affinity is set to cpu0 to cpu3 10 10 100 33.89 397.15 Schedule affinity is set to cpu0 to cpu7 20 20 200 56.62 760.52 Schedule affinity is set to cpu0 to cpu15 40 40 400 97.26 1571.27 Table 4. TPoX Benchmark Results
  • 16. Edison: IBM – Virtualization Performance White Paper Page 13 Figures 4A and 4B depict the response time for each transaction type — query, update, delete, and insert — for each test on both platforms. Figure 4A. TPoX Query and Update Response Time
  • 17. Edison: IBM – Virtualization Performance White Paper Page 14 Figure 4B. TPoX Delete and Insert Response Time As shown in Figure 4A and 4B (above), the response time on VMware vSphere 4.1 update 1 was two to six times higher, compared to PowerVM virtualization technology, as the number of VMs scaled from five to 40 VMs. The pool utilization was higher as well, while throughput was lower on VMware vSphere 4.1 update 1 than on PowerVM technology. Even though hyper threading (HT) technology was leveraged in this test, VMware vSphere 4.1 update 1 performance remained one-third of that demonstrated by PowerVM technology.
  • 18. Edison: IBM – Virtualization Performance White Paper Page 15 # of VMs Total Virtual CPUs Avg query rsp (sec) Avg update rsp (sec) Avg delete rsp (sec) Avg insert rsp (sec) IBM Power 750 3.5 GHz DPSM mode, four sockets, 512 GB RAM, SMT4 enabled, PowerVM, AIX 7.1 is the host OS for each VM. VIOS is configured with 0.2 core/1 vCPU/ uncapped mode/ 4 GB RAM. Each LPAR is configured with 1 vCPU/ uncapped/3 GB RAM 3 LPARs have 0.2 cores and 2 LPARs have 0.1 core. Shared pool has one core 5 5 0.09 0.08 0.03 0.05 8 LPARs are configured each with 0.2/1 vCPU/ uncapped/ 3 GB memory, two LPARs are configured with 0.1/1 vCPU/uncapped/3 GB memory, vios has 0.2/1 vCPU/uncapped/4 GB memory. Shared pool has two cores 10 10 0.09 0.08 0.04 0.06 18 LPARs are configured each with 0.2/1 vCPU/ uncapped/ 3 GB memory, two LPARs are configured with 0.1/1 vCPU/uncapped/3 GB memory, vios has 0.2/1 vCPU/uncapped/4 GB memory. Shared pool has four cores 20 20 0.1 0.1 0.06 0.07 38 LPARs configured with 0.2core/ one vCPU/uncapped and two LPARs configured with 0.1core/1 vCPU/ uncapped. Shared pool has eight cores 40 40 0.1 0.15 0.1 0.12 HP ProLiant DL580 G7, 2.26 GHz, eight cores / 24 MB cache (four sockets) Intel Xeon 7560 Processors, 512 GB system RAM (HT and Turbo enabled in BIOS Intel VTx with EPT HW virtualization assist) VMware vSphere 4.1 update1. Each VM has guest OS RHEL6 GA. Each VM is given 0.2 of a core/1 vCPU/3 GB memory. DB2 buffer pool for data is configured in each VM. Schedule affinity is set to cpu0 and cpu1. 5 5 0.22 0.33 0.205 0.26 Schedule affinity is set to cpu0 to cpu3 10 10 0.22 0.376 0.26 0.3 Schedule affinity is set to cpu0 to cpu7 20 20 0.22 0.39 0.275 0.315 Schedule affinity is set to cpu0 to cpu15 40 40 0.24 0.348 0.18 0.265 Table 5. TPoX Response Time for Each Transaction Type
  • 19. Edison: IBM – Virtualization Performance White Paper Page 16 Power 750/PowerVM HP DL580G7/ VMware vSphere 2vCPU Order (inserts per second) 1591 1176 Custacc (inserts per second) 684 333 Table 5A. TPoX Database Populated Rate for Second Set (2 vCPU) of Configuration A second configuration set on VMware vSphere 4.1 update 1 was added in order to restrict the VMs to run within the core, similar to the PowerVM virtualization configuration.10 Again, the database of each VM in this new configuration on VMware vSphere 4.1 update 1 was populated. The transaction rate for populating the database is shown in Table 5A. The results of this set of tests were compared with results for PowerVM technology, as shown in Figures 6, A and B. POWER/PowerVM still retained 2.3 times better performance than HP Intel/VMware vSphere 4.1 update 1 technologies, even with reconfiguration using CPU affinity (VMware Scheduling Affinity group) on VMware vSphere 4.1 update 1. CPU utilization on both platforms remained close to identical. Figure 5. TPoX Performances with VMware vSphere 4.1 update 1 Virtual Machine Reconfiguration 10 In this set each virtual machine was configured to have two vCPUs, using the CPU affinity feature in VMware; the first vCPU was bound to the primary thread while the second vCPU of a VM was bound to secondary thread of a core. For the five-VM test, all 10 vCPUs were bound to one core (both primary and the secondary thread); for the 10-VM test, all 20 vCPUs were bound to two cores; for the 20-VM test, all 40 vCPUs were bound to four cores; and for 40-VM test, all 80 vCPUs were bound to eight cores. In each case each VM was able to leverage both primary and secondary threads concurrently.
  • 20. Edison: IBM – Virtualization Performance White Paper Page 17 System Configuration for TPoX Benchmark (5 to 40 VM Scaling) # of VMs Total Virtual CPUs % CPU Utilization Transactions per second IBM Power 750 3.5 GHz DPSM mode, four sockets, 512 GB RAM, SMT4 enabled, PowerVM, AIX 7.1 is the host OS for each VM. VIOS is configured with 0.2 core/1 vCPU/ uncapped mode/ 4 GB RAM. Each LPAR is configured with 1 vCPU/ uncapped/3 GB RAM three LPARs have 0.2 cores and 2 LPARs have 0.1 core. Shared pool has one core 5 5 100 612.2 8 LPARs are configured each with 0.2/1 vCPU/ uncapped/ 3 GB memory, two LPARs are configured with 0.1/1 vCPU/uncapped/3 GB memory, vios has 0.2/1 vCPU/uncapped/4 GB memory. Shared pool has two cores 10 10 98 1155 18 LPARs are configured each with 0.2/1 vCPU/ uncapped/ 3 GB memory, two LPARs are configured with 0.1/1 vCPU/uncapped/3 GB memory, vios has 0.2/1 vCPU/uncapped/4 GB memory. Shared pool has four cores 20 20 98 2137 38 LPARs configured with 0.2core/ 1 vCPU/uncapped and two LPARs configured with 0.1 core/1 vCPU/ uncapped. Shared pool has eight cores 40 40 98 4169.8 HP ProLiant DL580 G7, 2.26 GHz, eight cores / 24 MB cache (4 sockets) Intel Xeon 7560 processors, 512 GB system RAM (HT and Turbo enabled in BIOS Intel VTx with EPT HW virtualization assist) VMware vSphere 4.1 update1. Each VM has guest OS RHEL6 GA. Each VM is given 2 vCPUs unlimited/3 GB memory. DB2 buffer pool for data is configured in each VM. Schedule affinity is set to cpu0 and cpu1. 5 10 100 259 Schedule affinity is set to cpu0 to cpu3 10 20 100 490.5 Schedule affinity is set to cpu0 to cpu7 20 40 100 997.9 Schedule affinity is set to cpu0 to cpu15 40 80 100 1906.4 Table 6 TPoX Performance with VMware vSphere 4.1 update 1 Virtual Machine Reconfiguration
  • 21. Edison: IBM – Virtualization Performance White Paper Page 18 Consider how the response time improved with CPU scheduling affinity on VMware vSphere 4.1 update 1. The query response time was reduced by approximately 30 percent. However, the impact on other transactions’ response time was negligible. The question arose as to how these results would compare to previously published TPoX benchmark results. No published results using virtualization technologies existed, so Edison Group compared these results with those of published results for testing non- virtualized systems on a comparable Intel Xeon 7560 system.11 Figure 6A. TPoX Query and Update Response Time Figure 6B. TPoX Delete and Insert Response Time 11 In March 2010, Intel had published TPoX benchmark results on an Intel Xeon 7560 system with 32 cores/256 GB RAM using a 1 TB database in a non-virtualized environment. Further results can be found at http://tpox.sourceforge.net/TPoX_Results_X7560.pdf
  • 22. Edison: IBM – Virtualization Performance White Paper Page 19 System Configuration for TPoX Benchmark (5 to 40 VM scaling) # of VMs Total Virtual CPUs Avg query rsp (sec) Avg update rsp (sec) Avg delete rsp (sec) Avg insert rsp (sec) IBM Power 750 3.5 GHz DPSM mode, four sockets, 512 GB RAM, SMT4 enabled, PowerVM, AIX 7.1 is the host OS for each VM. VIOS is configured with 0.2 core/1 vCPU/ uncapped mode/ 4 GB RAM. Each LPAR is configured with 1 vCPU/ uncapped/3 GB RAM 3 LPARs have 0.2 cores and two LPARs have 0.1 core Shared pool has one core 5 5 0.09 0.08 0.03 0.05 8 LPARs are configured each with 0.2/1 vCPU/ uncapped/ 3 GB memory, two LPARs are configured with 0.1/ 1 vCPU/uncapped/3 GB memory, vios has 0.2/1 vCPU/uncapped/4 GB memory. Shared pool has two cores 10 10 0.09 0.08 0.04 0.06 18 LPARs are configured each with 0.2/1 vCPU/ uncapped/ 3 GB memory, two LPARs are configured with 0.1/1 vCPU/uncapped/3 GB memory, vios has 0.2/1 vCPU/uncapped/4 GB memory. Shared pool has four cores 20 20 0.1 0.1 0.06 0.07 38 LPARs are configured with 0.2core/ 1 vCPU/uncapped and 2 LPARs configured with 0.1core/1 vCPU/ uncapped. Shared pool has eight cores 40 40 0.1 0.15 0.1 0.12 HP ProLiant DL580 G7, 2.26 GHz, eight cores / 24 MB cache (four sockets) Intel Xeon 7560 Processors, 512 GB system RAM (HT and Turbo enabled in BIOS Intel VTx with EPT HW virtualization assist) VMware vSphere 4.1 update1. Each VM has guest OS RHEL6 GA. Each VM is given two vCPU unlimited/3 GB memory. DB2 buffer pool for data is configured in each VM. Schedule affinity is set to cpu0 and cpu1. 5 10 0.145 0.3 0.245 0.26 Schedule affinity is set to cpu0 to cpu3 10 20 0.17 0.36 0.285 0.33 Schedule affinity is set to cpu0 to cpu7 20 40 0.16 0.39 0.25 0.275 Schedule affinity is set to cpu0 to cpu15 40 80 0.17 0.345 0.25 0.28 Table 7 TPoX Response Time with VMware vSphere 4.1 update 1 Reconfiguration
  • 23. Edison: IBM – Virtualization Performance White Paper Page 20 These previously-published results were better than what was achieved in tests using the HP Intel Xeon 7560 system described here. The difference in these results could be attributed to differences in storage subsystem, database size, execution of a large number of software images such as guest OS, database middleware, etc. Most significant, however, is that the tests described here were conducted in a virtualized environment using VMware vSphere, which adds overhead in comparison to a non- virtualized environment. Summary of Results Overall, PowerVM virtualization technology demonstrated superior performance over VMware vSphere 4.1 update 1 in two different configurations, each configuration covering two different virtual machine densities featuring high resource contention. As demonstrated using the AIM7 and TPoX benchmarks, the difference in throughput performance was quite considerable throughout, ranging from 50 percent better to as much as 200 percent better on PowerVM technology.
  • 24. Edison: IBM – Virtualization Performance White Paper Page 21 IBM’s Virtualization Infrastructure: POWER7 Processor-Based Systems The currently available POWER7 processor-based systems combine excellent performance, scalability, and modularity. IBM’s clients realize a high return on their investments with flexible, responsive infrastructures that easily adapt and grow based on business needs. A virtualization hypervisor is built into Power Systems to provide superior performance over competitive systems which rely on third-party virtualization software such as the widely-deployed VMware vSphere. POWER7 processor-based systems offer balanced systems designs that automatically optimize workload performance and capacity at either a system or a virtual machine level. Features include:  TurboCore workload-optimizing mode for maximum per-core performance for databases.  MaxCore for parallelization and maximum capacity throughput.  Intelligent threading technology to utilize more threads when it benefits workloads.  Intelligent Cache technology to optimize cache utilization, flowing from core to core.  Intelligent Energy that maximizes performance dynamically when thermal conditions allow.  Active Memory Expansion 12 that dynamically provides more memory on an as- needed basis.  Active Memory Sharing that allows for logical over-commitment of physical memory and deduplication. IBM PowerVM technology — the virtualization software built into the POWER7 processor-based systems — offers an unprecedented level of platform support, scalability, efficient resource utilization, flexibility, and heterogeneous server management. IBM PowerVM virtualization offers autonomic resource affinity, resulting in higher workload performance in a virtualized environment. IBM POWER7 Systems, and PowerVM technology with its efficient virtualization, are an excellent foundation for cloud computing environments. 12 Supported on AIX operating systems only.
  • 25. Edison: IBM – Virtualization Performance White Paper Page 22 PowerVM Virtualization Technology With IBM POWER processor-based systems and IBM PowerVM virtualization technologies, an organization can consolidate applications and servers using partitioning and virtualized system resources to achieve a more flexible and dynamic IT infrastructure. PowerVM delivers robust virtualization for IBM i, IBM AIX, and Linux environments on IBM POWER processor-based systems. The POWER Hypervisor is integrated as part of the system firmware and supports multiple operating environments on a single system. PowerVM virtualization technology offers the flexibility of combining dedicated and shared resources in the same partition. IBM Power Systems servers and PowerVM technology are designed to deliver a dynamic infrastructure that can help reduce costs, manage risk, and improve service levels. Processor Virtualization PowerVM technology’s advanced dynamic logical partitioning (LPAR) capabilities allow a single partition to act as a completely separate AIX, IBM i, or Linux operating environment. Partitions can be assigned either dedicated or shared processor resources. With shared resources, PowerVM virtualization technology can automatically adjust pooled processor resources across multiple operating systems, borrowing processing power from idle partitions to handle high transaction volumes in other partitions. PowerVM technology’s Micro-Partitioning supports up to 10 dynamic logical partitions per processor core. Depending upon the Power server, up to 1,000 independent virtualized servers can be run on a single physical Power server — each virtualized server with its own fractional processor share, memory, and I/O resources. These partitions can be assigned at a granularity of 1/100th of a core. Consolidating systems with PowerVM technology can reduce operational costs, improve availability, ease management, and improve service levels, while allowing businesses to deploy applications quickly. Shared processor pools increase throughput by allowing for the automatic non- disruptive balancing of processing power between partitions assigned to shared pools. It also provides for the ability to reduce processor-based software licensing costs by capping the processor core resources used by a group of partitions. Shared dedicated capacity allows for the “donation” of spare CPU cycles, from dedicated processor partitions to a shared processor pool. The dedicated partition maintains absolute priority for dedicated CPU cycles. Enabling this feature can help to increase system utilization without compromising the computing power for critical workloads in a dedicated processor.
  • 26. Edison: IBM – Virtualization Performance White Paper Page 23 Memory Virtualization PowerVM technology features Active Memory Sharing, a technology that intelligently and dynamically reallocates memory from one partition to another for increased utilization, flexibility, and performance. Active Memory Sharing enables the sharing of a pool of physical memory among logical partitions on a single server. This helps reduce the need for reserve memory resource capacity in a consolidated environment by increasing the efficiency of memory utilization, driving down system costs. The memory is dynamically allocated among the partitions as needed, to optimize the usage of physical memory in the pool. Along with shared memory, PowerVM technology also supports dedicated memory allocation, which enables partitions having shared memory to coexist in the same system as partitions having dedicated memory. I/O Virtualization The Virtual I/O Server (VIOS) is an integral part of PowerVM technology. A special- purpose partition, VIOS eliminates the need for dedicated network adapters, disk adapters and disk drives, and tape adapters and tape drives in the guest partitions running as VMs. It can reduce costs by virtualizing I/O resources to those partitions. VIOS owns the resources that are shared with clients; a physical adapter assigned to the VIOS partition can be shared by one or more other partitions. With VIOS, guest partitions can easily be created for test, development, or production purposes. PowerVM technology also supports dedicated I/O along with VIOS on the same system. Therefore, a single system can have I/O hosted by VIOS for some partitions and other partitions with dedicated I/O devices. An organization can thus reserve a dedicated VM of a given capacity that can be relied upon for high-priority and/or mission-critical workloads, while assigning other VMs to a general resource pool. Partition Mobility Live Partition Mobility facilitates the migration of a running AIX or Linux partition from one physical server to another without requiring application downtime for planned system maintenance, migrations, provisioning, and workload management. Partition Hibernation IBM POWER7 systems support Partition Hibernation, where a partition can be suspended and resumed at a later time. In a suspended state, a partition’s resources can be used by other partitions while the suspended partition’s state is stored in a paging
  • 27. Edison: IBM – Virtualization Performance White Paper Page 24 space on a persistent storage device. Partition Hibernation can be used for resource balancing and for planned CEC outages for maintenance or upgrades. Workload Partitioning PowerVM technology also supports a software partitioning technology provided by the AIX operating system, a mode of virtualization capability called Workload Partitions (WPARs). Introduced with AIX Version 6, WPAR is independent of hardware features. It enables consolidation of workloads on a single AIX operating system by providing isolation between workloads running in different WPARs. From an application perspective, each workload is running in its own operating system environment. A key feature of WPAR is mobility, a running WPAR can be relocated from one VM to another on the same operating system platform. This enables applications to be migrated to another system during planned maintenance operations, to balance workloads, to provision rapidly to meet growth dynamically, and to improve energy efficiency by further consolidating on the fly during low load periods. Systems Management IBM Systems Director (Express, Standard, and Enterprise Editions) for Power servers supports the PowerVM environment. It is IBM’s tool for heterogeneous platform management of Power Systems, IBM System x, IBM System z, and IBM System Storage systems. IBM Systems Director Editions support advanced management functions such as system discovery, workload lifecycle management, health monitoring, system updates, and topology mappings. It also provides the ability to take action on defined event thresholds of monitored system components. IBM Systems Director VMControl transforms Systems Director from managing virtualization to using virtualization in order to better manage an entire IT infrastructure. It is offered as a plug-in option included with the Systems Director Standard and Enterprise Editions. Together, IBM Systems Director and VMControl help reduce the total cost of ownership in a virtual environment by increasing asset utilization and reducing the time and effort required to deploy workloads. Using them, administrators can maintain high levels of availability through proactive monitoring and collaborative troubleshooting, reducing costs further. VMControl is available in three editions, to suit the varying levels of virtualization deployment at client sites:  VMControl Express Edition provides basic VM lifecycle management.
  • 28. Edison: IBM – Virtualization Performance White Paper Page 25  VMControl Standard Edition adds virtual appliance lifecycle management to capture information from active systems and store it in a repository as reusable system images (called virtual appliances).  VMControl Enterprise Edition adds system pool lifecycle management. It allows users to create and manage system pools – or groups of virtual appliances deployed across multiple physical servers – as easily as managing a single entity. The advanced virtualization management capabilities of VMControl provide a pathway for organizations to build sophisticated cloud computing environments. PowerVM Virtualization Technology Advantages PowerVM virtualization technology offers a secure virtualization environment built on the advanced RAS features and excellent performance of the Power Systems platform. PowerVM technology delivers numerous advantages, including:  High resource utilization — PowerVM technology makes the most efficient utilization of IT investments by virtualizing resources that include processors, memory, and I/O across multiple virtual machines.  Flexibility — PowerVM technology runs on all Power Systems servers, from blades to high-end servers. It provides the greatest flexibility by supporting both dedicated and shared resource models. Unlike VMware vSphere on the x86 platform, PowerVM virtualization technology allows virtual machines to have all dedicated resources (CPU, memory and I/O) , or all shared resources (virtual processors, virtual memory, virtual I/O), or a mix of dedicated and shared resources in the same LPAR.  Quality of Service — PowerVM technology ensures that workloads achieve high quality of service even when LPARs share processors from a shared pool.  Scalability — PowerVM technology can reduce server purchases by supporting partitions as small as 1/10 of a processor. POWER7 processor-based high-end systems support up to 256 physical processors in a single LPAR and up to 1,000 partitions in a system.  Availability — Live Partition Mobility (LPM) helps eliminate planned downtime by allowing partitions to be moved to another server while running, freeing hardware for upgrades or maintenance without interrupting productive operations. In a system pool, LPM enables autonomic load balancing across multiple systems.  Resource pools — IBM PowerVM technology has enhanced CPU and memory affinity to improve performance of resource-intensive workloads, such as database workloads, across multiple virtual machines sharing resources in a system. IBM VMControl enhancements make it easier to deploy and manage large numbers of
  • 29. Edison: IBM – Virtualization Performance White Paper Page 26 these virtual machines in a shared resource pool spanning one or more physical systems. Integrated Virtualization Because of its level of sophistication and maturity, PowerVM technology is commonly employed with enterprise-class applications and workloads. Power Systems servers implement virtualization architecture with components embedded in the hardware, firmware, and operating system software, all while running with significantly less overhead. The capabilities of this integrated virtualization architecture are significantly different and, in many areas, more advanced than VMware vSphere and other third- party software, which must be installed on x86 hardware that leverages hardware-assist virtualization optimizations. Power Systems servers and PowerVM virtualization technology capabilities are more granular and more closely integrated than are those of VMware vSphere or Microsoft Hyper-V (or equivalent x86-based virtualization tools), or Oracle VM for SPARC. The Power Systems platform also benefits from numerous industry-leading availability optimization features. These distinctive capabilities have led to widespread adoption of Power Systems servers to support the significantly more demanding performance and uptime requirements of transaction- and database-intensive systems. Greater Partition Isolation By enabling “firmware-based” partitions, PowerVM technology provides greater partition isolation than software-based virtualization technologies. Firmware-based logical partitions (or virtual machines) reduce the potential for performance bottlenecks and contribute to higher levels of availability and security than does software-based virtualization. They also contribute to increased linear scalability. Partitioning and Workload Management Integration The importance of workload management cannot be overstated. Partitioning creates the potential to utilize capacity very efficiently. The extent that this potential is realized in practice depends on the mechanisms that allocate system resources, monitor, and control workload execution across partitions. If these mechanisms are ineffective, a high proportion of system capacity may remain idle at any given time. Close integration of partitioning and workload management capabilities help prevent surges in workloads running in individual partitions from impacting performance and availability. POWER7 processor-based systems have a large number of cores per socket,
  • 30. Edison: IBM – Virtualization Performance White Paper Page 27 abundant memory, and a great deal of I/O bandwidth per core. They also support a high number of threads per core with simultaneous multithreading (SMT). Different workloads can benefit from different processor core thread settings; processor-intensive workloads might benefit from using one thread (SMT1) while workloads that are I/O- intensive can benefit from using several. POWER7 processor-based systems support up to an SMT4 setting. Thus, POWER7 processor-based systems consolidate an unprecedented number of partitions and can handle workload surges more effectively, for demonstrably higher performance. Accommodating Greater Consolidation Density PowerVM technology is optimized to handle business-critical systems and complex multi-partition production environments. IBM Power Systems and PowerVM technologies allow a high consolidation ratio and thus greater levels of efficiency in utilization.
  • 31. Edison: IBM – Virtualization Performance White Paper Page 28 Conclusions Virtualization has become a pervasive means of consolidating workloads on fewer systems, controlling server sprawl and minimizing costs. With IBM Power Systems and PowerVM virtualization technologies, organizations can achieve virtualization with outstanding performance. For every benchmark and every scenario covered in this paper, IBM Power Systems with PowerVM technology demonstrated superior performance and greater efficiency in using system capacity at higher utilization, as well as at higher resource contention (over-commit levels), and superior scaling with higher throughput performance. In summary, this study has shown that IBM POWER7 systems and PowerVM technology have demonstrated:  Higher throughput performance for both AIM7 and TPoX benchmarks, ranging from 50 percent better to as much as 200 percent better.  Higher efficiency in resource over-commit mode (higher consolidation ratio), with the response time on PowerVM virtualization technology two to six times shorter, compared to response time for VMware vSphere 4.1 update 1, as the number of VMs scaled from five to 40 VMs.  Higher processor affinity by default (40 VMs sharing eight cores), retaining 2.3 times better performance than HP Intel/VMware vSphere 4.1 update 1 technologies, even with reconfiguration using CPU affinity (VMware Scheduling Affinity group) on VMware vSphere 4.1 update 1.  Efficient leveraging of maximum configured processor capacity.  Accurate accounting of resource usage within a VM.  Tighter integration across system, hypervisor, and guest OS.  Better performance overall than Intel Xeon 7560 /VMware vSphere 4.1 update 1. The charts that follow summarize the results of the tests described in this paper. The first — the AIM7 performance benchmark 32-core VM scaling (scale-up) results— shows that PowerVM on POWER7 delivers superior scale-up efficiency that outperforms VMware vSphere 4.1 update 1 by up to 115 percent while running the same Linux workloads and virtualized resources.
  • 32. Edison: IBM – Virtualization Performance White Paper Page 29 0 100000 200000 300000 400000 500000 600000 700000 Jobs/min 1VM 2VM 4VM 8VM 16VM 32VM Number of Virtual Machines AIM7 Performance Benchmark 32 VM Scale-out on 32 cores VMware vSphere 4.1 on HP DL580(1vcpu) VMware vSphere 4.1 on HP DL580(2vcpu) PowerVM on Power 750(1vcpu) In fact, PowerVM on POWER7 retains its superiority even configured with an additional virtual CPU per VM. The second chart — the TPOX performance benchmark 5 VM per core (scale-out) — shows that PowerVM on POWER7 delivers robust scale-out efficiency that outperforms VMware vSphere 4.1 update 1 by up to 201 percent while running the same workloads and virtualized resources.
  • 33. Edison: IBM – Virtualization Performance White Paper Page 30 0 1000 2000 3000 4000 5000 Jobs/min 5VM 10VM 20VM 40VM Number of Virtual Machines TPOX Performance Benchmark 40 VM Scale-out on 8 cores 5 VMs per core VMware vSphere 4.1 on HP DL580(1vcpu) VMware vSphere 4.1 on HP DL580(2vcpu) PowerVM on Power 750(1vcpu) PowerVM maximizes workload performance and system resources while running multiple virtual machines on a core better than does VMware vSphere 4.1 update 1. IBM Power Systems — with the superior performance of PowerVM virtualization technology and with features such as reliability, security, high availability, and resiliency — are well positioned for cloud computing and smarter planet solutions today and in the future.
  • 34. Edison: IBM – Virtualization Performance White Paper Page 31 Appendices Appendix 1 — Benchmark Configuration Information IBM started competitive research on PowerVM virtualization in 2009 and published two papers 13 comparing IBM POWER processor-based systems and PowerVM virtualization technologies to Microsoft Hyper-V and VMware vSphere 4.0 update 1 running on an HP ProLiant DL 370 G6/ Intel Xeon 5570 processors. Both these studies, which show the superior performance of POWER processors and PowerVM technology, took a simplified approach to answering the two most commonly expressed considerations in deploying virtualization technologies: 1. How efficient is the technology? 2. How well does the technology scale? The current study builds upon those simple premises to include two additional considerations: 1. How efficient is the technology when resources are in high contention? 2. How well does it scale as virtual machine density increases? Test Bed Setup The servers employed for this study were chosen for their equivalencies from the standpoint of core and socket count. IBM POWER7 Processor-Based Server The IBM POWER7 processor-based IBM Power 750 Express system was used in this study to demonstrate the capabilities of IBM’s PowerVM virtualization technology. The system was configured with four sockets, 3.5 GHz, 32 cores (eight per socket) supporting up to four threads (SMT4) per core, and 512 GB of RAM. 13 A Comparison of PowerVM and x86-Based Virtualization Performance, Oct 2009 http://www-03.IBM.com/support/techdocs/atsmastr.nsf/WebIndex/WP101574 A Comparison of PowerVM and VMware Virtualization Performance, April 2010 http://www.spectrumconsulting.co.nz/aix/wp-content/uploads/PowerVM_VMware.pdf
  • 35. Edison: IBM – Virtualization Performance White Paper Page 32 HP ProLiant DL580 G7 Intel Xeon X7560 (2.26GHz/8-core/24MB/130W) Processor HP ProLiant DL580 G7 is a rack-mounted, high-performance Intel Xeon 7560-based server; this system was selected to demonstrate the capabilities of VMware vSphere 4.1 update 1 virtualization technologies. The system was configured with four sockets, with eight cores each, supporting up to two threads per core (HT mode). The system was also enabled for Turbo Mode, Intel VTx with EPT HW Virtualization assist. Infrastructure Configuration System Configuration Storage Configuration IBM Power 750, 3.5 GHz, eight cores per socket POWER7 Processors, 128 GB RAM per socket. IBM DS4800 (4 GB cache), one 4 Gb Fiber Channel adapter. Each array has 12 (32 GB) disks using RAID5. Each array is shared by four virtual machines, each getting 40 GB virtual disk space. HP ProLiant DL 580 G7, 2.26 GHz, eight cores / 24 MB (four sockets) Intel Xeon 7560 Processors, 512 GB system RAM. IBM DS4800 (4 GB cache), one 4 Gb Fiber Channel adapter. Each array has 12 (32 GB) disks using RAID5. Each array is shared by four virtual machines, each getting 40 GB virtual disk space. Software Used Category PowerVM Technology VMware vSphere Hypervisor Power Hypervisor (IBM Power 750 in-built hypervisor) VMware vSphere 4.1 Update 1 Guest OS SuSE 11, SP1 AIX 7.1 SuSE 11, SP1 GA x86_64 RHEL6 GAx86_64 Middleware IBM DB2 v9.7 IBM DB2 v9.7
  • 36. Edison: IBM – Virtualization Performance White Paper Page 33 VMware vSphere 4.1 update 1 Virtual Machine Technical Configuration Details 1. VMware Virtual Machine was created using Virtual Machine version 7, which is compatible with vSphere 4.0 hosts and greater, and provided greater virtual machine functionality than earlier versions. 2. A Virtual Disk LSI Logic Parallel adapter was used. It was noted (in vSphere Help) that the LSI Logic Parallel adapter and the LSI Logic SAS adapter offer equivalent performance. 3. The VMware vSphere 4.1 update 1 system was updated to the latest VMware Tools. 4. Scheduling affinity group was used to bind cores to virtual machines. 5. Memory affinity was enabled. 6. vSpheretop –ab and vmstat were collected from the virtual machine.
  • 37. Edison: IBM – Virtualization Performance White Paper Page 34 Appendix 2 — General Benchmark Descriptions The performance tests described here characterized hypervisor efficiency and scalability. Both benchmarks stress the entire stack of application, middleware, OS, and hypervisors. Neither benchmark requires external clients to drive the load. The following tests were conducted: 1. Demonstrate the effect that adding virtual processors incrementally has on throughput performance in a single VM. Where direct performance comparisons were to be made, the testing team limited the number of virtual processors to the lesser of the maximum supported across the two virtualization platforms. Note: While consolidation deployments by definition entail multiple VMs, understanding how each technology deals with processor scaling in the simplest possible configuration within a single VM provides insights into hypervisor efficiency. 2. Demonstrate the effect that adding VMs has on throughput performance. Throughput is monitored as the number of VMs is scaled from 1 to n. Throughput in each VM was also evaluated using varying numbers of virtual processors and load. Note: This will show the effect of multiple VMs running on a system in a non- over-commit as well as an over-commit resource environment. Each of these tests (1 and 2) was run on different workloads. The tests included running the same workloads (homogeneous) or a mix of workloads (heterogeneous) across multiple VMs concurrently. This revealed how each class of workload is affected by the respective types of resource scaling in each test. To ensure fair comparison across platforms and to remove variability across each set of tests, the following actions were taken:  Similar VM configurations were deployed in terms of virtual processors and memory allocated per VM.  The same set of “benchmark parameters” was used across platforms.  Tuning was performed based on best practices of respective platforms (VMware vSphere 4.1 update 1, RHEL 6.0, AIX 7.1, DB2 tuning).
  • 38. Edison: IBM – Virtualization Performance White Paper Page 35 Addendum: Benchmarks Comparing PowerVM on Power 750 with vSphere 5 on Intel Westmere EX-Based System At the time that the systems were tested for this white paper, VMware vSphere 4.1 update 1 was most current version available from VMware. Subsequently, VMware announced a significant new release: version 5, which includes nearly 200 new or enhanced features and capabilities such areas as deployment, storage, management, availability, and security. The central improvement to virtualization and consolidation capacity (and thus to this white paper) in version 5 is that vSphere VMs can now be configured with up to 1 terabyte of memory and 32 virtual CPUs. VMware is touting this version (“supporting VMs that are up to four times more powerful than previous versions”) as the way to accelerate a data center’s move to a more efficient cloud infrastructure. Edison sought to assess whether a commensurate improvement in throughput performance accompanied vSphere’s greater vCPU capacity. It also wanted to investigate whether PowerVM retains the considerable advantage over vSphere in performance and hardware utilization that it demonstrated in the original edition of the white paper. Summary Edison wished to evaluate a comparison of PowerVM performance against the latest solutions that the x86-based VMware platform has to offer on a similar class of server hardware. Therefore, on the vSphere side, the tests described in this addendum were run on an HP ProLiant DL580 G7 E7-4870 server, which features the X5600-series Xeon chip architecture (Westmere-EX) and contains 40 cores (10 cores per chip). As in the previously published edition of this white paper, PowerVM was run on an IBM Power 750 system, based on the POWER7 processor. Edison reviewed and analyzed the results of the open source AIM7 benchmark testing applied to the three virtualization solutions — VMware vSphere 4.1 update 1, VMware vSphere 5, and PowerVM — in a scale-up scenario of 32 vCPUs within a single VM. A second test — a vCPU scale-out scenario of 32 vCPUs using eight VMs — was evaluated that compares vSphere 5 with PowerVM.
  • 39. Edison: IBM – Virtualization Performance White Paper Page 36 The key findings, summarized, are as follows:  In terms of throughput performance, vSphere 5 demonstrated no improvement over vSphere 4.1 update 1; in fact, it demonstrated slightly lower performance overall.  PowerVM on Power 750 outperforms vSphere 5 on the Intel-based system by up to 131 percent, running the same workloads across virtualized resources.  PowerVM on Power 750 outperforms VMware vSphere 5 by up to 525 percent when running multiple VMs and workloads, despite the test Intel x86 system (Westmere- EX) containing a greater number of cores (40 versus 32). The benchmark results reveal that PowerVM virtualization technology on POWER7 processor-based platforms retains as great a performance advantage over VMware vSphere 5 on Intel x86 platforms as it does over VMware vSphere 4.1 update 1. Therefore, PowerVM virtualization technology remains the consolidation system of choice for organizations wishing to realize the full advantages of greater VM density, as was demonstrated in the earlier edition of the white paper. The Benchmarks To obtain the results presented in this addendum, the AIM7 benchmark (described on Page 7 of this white paper) was employed in two different scenarios. Once again, the Power Linux version used on PowerVM virtualization technology was SuSE 11 SP1. SuSE 11 SP1 x86_64 was used as guest OS on VMware vSphere 4.1 update 1. Scale-Up Benchmark This scenario tested three platforms: VMware vSphere 4.1 update 1 and VMware vSphere 5, each running on an HP ProLiant DL580 G7 E7-4870 server; and PowerVM running on an IBM Power 750 system. AIM7 was scaled in one, two, four, eight, 16, and 32 vCPUs within a single VM. Scaling was near linear on both the POWER7 processor/PowerVM technology-based systems and both of the Intel/VMware vSphere platforms. Running the same workloads across virtualized resources, the POWER7 processor/PowerVM system demonstrated superior performance well over twice the percentage of either Intel/VMware vSphere 4.1 or Intel/VMware vSphere 5 at one, two, four, and eight vCPU configurations. At the top end for vSphere 4.1 update 1 (8 vCPUs), PowerVM technology demonstrated a 103 percent advantage; while at the top end for vSphere 5 , PowerVM technology demonstrated a substantial 131 percent advantage (Figure 1).
  • 40. Edison: IBM – Virtualization Performance White Paper Page 37 NOTE: The VM and vCPU configurations and the numeric test result data points can be found in the tables following the graphs for both tests in this addendum. 0 100000 200000 300000 400000 500000 600000 Jobs/min 1 2 4 8 16 32 # of vcpus AIM7 SingleVM Scale-up PowerVM vSphere5 vSphere4.1 Figure 1. AIM7 Single VM Scale-Up Table 1 shows the details on throughput and CPU utilization for each configuration. As in the tests conducted for the original study, the VMs on all three platforms were configured as close to identically as possible. In the case of PowerVM, each logical partition (LPAR) was given 3 GB RAM, 1, 2, 4, 8, 16 and 32 virtual processors. In the case of VMware vSphere, each VM was given 3 GB RAM, 1, 2, 4, 8, 16 and 32 virtual processors with the remainder left at default options.
  • 41. Edison: IBM – Virtualization Performance White Paper Page 38 System Configuration for AIM7 Benchmark (1 to 32 VM Scaling) Cores in the System Virtual CPUs Jobs/Min % CPU Utilization IBM Power 750 3.6 GHz, 4 sockets, 384 GB RAM, SMT4-enabled, PowerVM and SLES11 SP1 (Power Linux) One core one vCPU 32 1 19027 3.09% Two cores two vCPUs 32 2 37751 6.19% Four cores four vCPUs 32 4 74624 12.38% Eight cores four vCPUs 32 8 144680 25.00% 16 cores 16 vCPUs 32 16 287559 50.00% 32 cores 32 vCPUs 32 32 540666 98.00% HP ProLiant DL580 G7, Intel Xeon E7 4870 2.4 GHz, 640 GB RAM, 4 sockets, VMware vSphere 4.1 update 1 and SLES11 SP1 (x86_64) One vCPU 40 1 9173 2.90% Two vCPUs 40 2 18287 5.48% Four vCPUs 40 4 36231 10.49% Eight vCPUs 40 8 71239 20.42% HP ProLiant DL580 G7, Intel Xeon E7 4870 2.4 GHz, 640 GB RAM, 4 sockets, VMware vSphere 5 and SLES11 SP1 (x86_64) One socket one vCPU 40 1 9018 4.42% One socket two vCPUs 40 2 17898.7 6.85% One socket four vCPUs 40 4 35379 11.79% One socket eight vCPUs 40 8 69077 21.62% One socket 16 vCPUs 40 16 130770 41.24% One socket 32 vCPUs 40 32 233684 80.34% Table 1. AIM7 Benchmark Single Virtual Machine Scale-Up An interesting revelation can be seen more clearly in the table than the graph, where the former top limit of eight vCPUs for vSphere has been highlighted in each version. Not only is vSphere 5 no better than vSphere 4.1 update 1 in terms of scale-up efficiency as reflected in throughput performance, it is actually slightly less efficient.
  • 42. Edison: IBM – Virtualization Performance White Paper Page 39 As explained on Page 10 of this white paper, many factors contribute to this superior performance, including: PowerVM technology efficiency, IBM POWER7 SMT4 technology, IBM POWER7 core efficiency and IBM POWER7 higher core frequency. Furthermore, PowerVM on Power 750 systems can leverage all system resources in order to maximize workload performance. Scale-Out Benchmark This scenario tested VMware vSphere 5 running on an HP ProLiant DL580 G7 E7-4870 server against PowerVM running on an IBM Power 750 system. AIM7 was scaled to eight VMs using 32 vCPUs per VM, configuring a total of 256 vCPUs. Running the same workloads across virtualized resources, the POWER7 processor/PowerVM -based system demonstrated a very substantial 525 percent advantage over Intel/VMware vSphere 5. 0 100000 200000 300000 400000 500000 600000 Jobs/Min 8 VM AIM7 Multiple VM scale-out (32 vcpus per VM) PowerVM vSphere5 Figure 2. AIM7 Multiple VM Scale-Out It is important to note that the difference in efficient use of hardware resources between the two systems. The server used to run the vSphere workloads contains more cores (40) than does the Power 750 hardware. Yet it is unable to leverage the greater hardware capacity to achieve superior or even comparable throughput performance. Table 2, below, shows that the workload on each platform consumed all the capacity in the system (i.e., 100 percent CPU utilization).
  • 43. Edison: IBM – Virtualization Performance White Paper Page 40 System Configuration for AIM7 Benchmark (1 to 32 VM Scaling) Cores in the System # of VMs Virtual CPUs Jobs/Min % CPU Utilization IBM Power 750 3.6 Ghz, 4 sockets, 384 GB RAM, SMT4- enabled, Power VM and SLES11 SP1 (Power Linux) Eight VM - each VM has four cores / 32 vCPUs 32 8 256 500,721.10 100% HP Proliant DL580 G7, Intel Xeon E7 4870 2.4 Ghz, 640 GB RAM, 4 sockets, VMware vSphere 5, SLES11 SP1 (x84 64) Eight VM - each VM has 1 socket / 32 vCPUs 40 8 256 79,626.10 100% Table 2. AIM7 Benchmark Multiple Virtual Machine Scale-Out Conclusion As shown in this addendum, IBM PowerVM on POWER 7-based systems demonstrate the same distinct and considerable advantages over VMware vSphere 5 in workload throughput performance on x86 Intel-based platforms as over vSphere 4.1 update 1. The edge that POWER7/PowerVM has over Intel/vSphere remains linearly substantial as VMs and vCPUs are scaled, becoming ever more significant as workloads increase. A data center scaling up to a cloud-supporting infrastructure or large-scale enterprise applications would have to purchase, deploy, provision, and maintain a good deal more hardware and software to achieve the same workload productivity possible with PowerVM on POWER7. This dilutes the multiple cost advantages delivered via consolidation, and can increase total cost of ownership in the form of a more complex infrastructure to manage and more time devoted to systems maintenance. POL03090-USEN-02