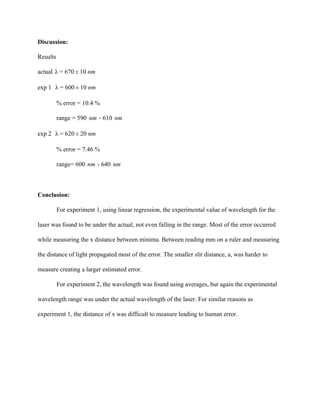
Interference and Diffraction 
February 4, 2016 
Section 002 
Gary Schultz and Rachel Weyand 
 
Abstract:  
The purpose of this lab was to calculate the wavelength of light intensity for single and 
double slits. When the light passes through single slits, the result is interference and diffraction. 
For purposes of this lab, the interference wave was used by experimentally measuring between 
the first minima on either side of the centroid for values of a. Intensity was found through 
where I​m​ is the maximum intensity and  is given by  Here, a is(sinα/α)I = Im
2
α πasinθ/λ). α = (  
the width of each slit, already measured, and   is the wavelength. The slope of the best fit curveλ  
of sin( vs 1/a was used to find wavelength. The manufacturer’s   is 670  nm and the)θ λ 0 ± 1  
experimental   is 600  10 nm. This yielded a 10.4% error. For both experiments, the method ofλ ±  
measuring the distance between the minima created a significant amount of error which is 
discussed in the conclusion. 
Experiment two of the lab used a double slit instead and the diffraction wave was used by 
measuring the distance between the first four minima on either side of the central maximum 
using the same laser. For intensity of a double slit, the equation is  , where(cosβ) (sinα/α)I = Im
2 2
 
 is the same as the first experiment and  is given by  . The distance between theα β πdsinθ/λ)β = (  
slits is given by d and is provided. 620  20 nm was the experimental wavelength calculated±  
using averages. The percent error for experiment 2 was 7.46%.  
Data:  
Table 1: ​The table below shows the measured lengths of the central maximum created by single 
slits of various lengths. ​ ​Here,  x is the measured distance between minima. 
Data number   width of slit (a) 
(mm) 
x​1​ (mm)  x​2​ (mm)  average x (mm) 
1  0.02  62.0  .05± 0   59.9  0.05±   60.95  0.7±  
2  0.04  34.0  0.03±   29.8  0.03±   31.9  1.0±  
3  0.08  15.3  0.01±   15.1  0.01±   15.2  0.07±  
4  0.16  7.9  0.01±   8.3  0.01±   8.1  0.1±  
 
*Uncertainty for a is assumed to be zero because the value was provided on the slits.  
*Uncertainties for x​1 ​and x​2​ for ​Tables 1 and 2​ were estimated based on the error from 
measuring the distance between the minima. 
 
Table 2:  ​The table below shows the distances measured between the first four minima sets, x 
and the average of the two recordings.  
Data number  x​1  0.01(mm)±   x​2  0.01 (mm)±   x average (mm) 
1  2.3     2.6   2.45  0.1±  
2  7.9     7.8     7.85  0.04±  
3  12.2     12.6     12.4  0.1±  
4  16.8   16.9   16.85  0.04±  
 
Sample Calculation for average distance between minima, x (used for tables 1 and 2) 
x​ave​=(x​1​+x​2​)/2 
x​ave​=(62.0+59.9)/2 
x​ave​=60.95mm 
 
Calculation of standard deviation for average x (used for tables 1 and 2) 
/2((x ) x ) )σxave = 1 1 − xave
2
+ ( 2 − xave
2 1/2
 
=½((62.0­60.95)​2​
+(59.9­60. 95)​2​
)​1/2
σxave
 
=0.74246mmσxave  


Analysis: 
Calculation for sin ᵰ 
sin ᵰ = 0.5x/(L​2​
+0.25x​2​
)​½​
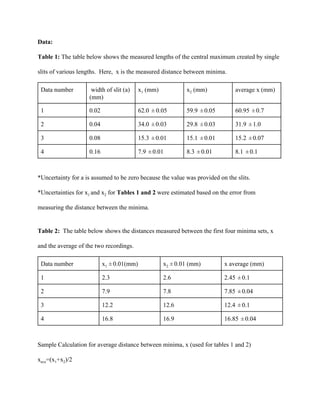
 where x is the distance measured between the minima and L is the 
distance from the slit to the screen.  
sin ᵰ = 0.5(60.95mm)(1000mm​2​
+0.25(60.95mm)​2​
)​½
 
sin ᵰ = 0.030461 
 
Propagation of uncertainty for sin ᵰ 
sinθ {d/dt(sin(arctan(xave/1000)))} ]Δ = [ 2 1/2
 
sinθ {1000cos(arctan(xave/1000))/(xave 000000)} ]Δ = [ 2 + 1 2 1/2
 
sinθ {1000cos(arctan(60.95/1000))/(60.95 000000)} ]Δ = [ 2
+ 1 2 1/2
 
0.0001sinθΔ =  
 
Table 3: ​The table below shows the calculated values of sin ᵰ  and  sin ᵰ.Δ    
 
Data number  a (mm)  1/a (1/mm)  sin ᵰ   sin ᵰΔ    
1  0.02  50  0.030461     0.0001±  
2  0.04  25  0.015948  0.0001±  
3  0.08  12.5  0.0076  0.0001±  
4  0.16  6.25  0.00405  0.0001±  
 
*Uncertainty for a and 1/a are assumed to be zero because the values were provided on the slits.  


Figure 1: ​The figure shows the graph of sin ᵰ vs. 1/a.  


Figure 2: ​The figure below shows the linear regression analysis from the excel output of the data 
from ​Figure 1.   
   Coefficients  Standard Error 
Intercept  0.000296129  0.000356282 
X Variable 1  0.000606657  1.23661E­05 
 
To calculate the wavelength, take the slope of ​Figure 1​.  
 
Calculated wavelength​:​ 607   12 nm±    
Percent error: 
  ​% error = ( ​exp ​­ ​known​) / ( ​known ​) *100λ λ λ λ  
(600­670)/(670)*100= 10.4%   
Calculations below are for ​Table 4 
Calculation for   where d is given on the double slit and is constant for all values of m.λ   
sinθL /(m .5)λ = d 2
+ 0  
0.25)(0.001225)(1000 )/(0 .5)λ = ( 2
+ 0  
612.50 nmλ =  
 
Calculation propagation of uncertainty  Δ λ 
λ 000(0.25 000 os(arctan(xave/1000)) sinθ/(xave 000)(m .5)))Δ = 1 * 1 * c * Δ 2 + 1 + 0  
λ 000(0.25 000 os(arctan(2.45/1000)) 0.0001)/(2.45 000)(0 .5)))Δ = 1 * 1 * c * ( 2
+ 1 + 0  
0.5 nmλΔ =  
Calculations for sin( and  sin( are the same as the previous experiment.)θ Δ )θ   
 
Table 4 ​The table below shows sin( ) compared to wavelength calculated from the orderθ  
integer.  
Order 
integer, M 
sin( )θ   sin(Δ )θ   wavelength, λ
(nm) 
(nm)  Δ λ  
0  0.001225  0.0001±   612.50  0.5±  
1  0.003925  0.0001±   654.16  0.2±  
2  0.0062  0.0001±   619.99  0.1±  
3  0.008425  0.0001±   601.76  0.07±  


Average wavelength:  
(612.5+654.16+619.99+601.76)/4 = 622.10 nm 
 
Standard deviation of wavelength:  
/2((λ ) λ ) )σλave = 1 1 − λave
2
+ ( 2 − λave
2 1/2
 
=½((612.5­622.10)​2​
+(654.16­622.10)​2​
+(619.99­622.10)​2 ​
+(601.76 ­ 622.10)​2​
)​1/2
σλave
  
= 19.609 nmσλave   
 
Calculated wavelength: 622 20 nm±    
Percent error 
% error = ( ​exp ​­ ​known​) / ( ​known ​) *100λ λ λ λ  
(620­670)/(670)*100= 7.46% 


Discussion: 
Results  
actual  70 0 nmλ = 6 ± 1  
exp 1   00 0 nmλ = 6 ± 1  
% error = 10.4 % 
range = 590   ­ 610 mn mn  
exp 2   20 0 nmλ = 6 ± 2  
% error = 7.46 % 
range= 600   ­ 640 mn mn  
 
Conclusion: 
For experiment 1, using linear regression, the experimental value of wavelength for the 
laser was found to be under the actual, not even falling in the range. Most of the error occurred 
while measuring the x distance between minima. Between reading mm on a ruler and measuring 
the distance of light propagated most of the error. The smaller slit distance, a, was harder to 
measure creating a larger estimated error.  
For experiment 2, the wavelength was found using averages, but again the experimental 
wavelength range was under the actual wavelength of the laser. For similar reasons as 
experiment 1, the distance of x was difficult to measure leading to human error.  


Post lab Questions: 
  
1. Single Slit: Using that ƛ = 650 nm and single slit width a=0.04 mm, plot the intensity (relative 
to the max I​m​) from α = 0 to 4π. Find the maximum value of the intensity for α between π and 2π.  
Givens:  
  ƛ = 650 nm,  a=0.04 mm, α = 0 to 4π   
Solution: 
Using the equation  , intensity vs alpha is plotted below from values ranging  m((sin α) /α))I = I 2
 
from 0 to 4π.   


According to the graph, the maximum value for the intensity between π and 2π is about 0.0472 I​m 
at 1.43π.   
2. Double Slit: Using the ƛ= 650 nm, single slit width of a=0.04 mm and the double slit distance 
d= 0.25 mm, calculate the intensity of the first through tenth maxima. 
Givens: 
ƛ= 650 nm, a=0.04 mm, d= 0.25 mm   
Solution: 
sinθ mλ d =    
First, solve for theta. 
rcsin(λm/d)θ = a  
rcsin((650 0 m)/(.25 0 ))θ = a × 1 −9
× 1 −3
 
Now plug the above expression into the  equation.β   
d sinθ/λ β = π  
(.25 0 )(650 0 )((m 650 0 ))/(.25 0 ))β = π × 1 −3
× 1 −9
× ( × 1 −9
× 1 −3
  
The .25*10​­3​
 and 650*10​­9​
 terms cancel which leaves 
mβ = π  
Now solve for alpha using the known numbers given in the problem in the following equation. 
a sinθ /λ  α = π  
(.04 0 )(650 0 )m/(.25 0 )(650 0 )α = π × 1 −3
× 1 −9
× 1 −3
× 1 −9
 
(.04 0 )m/(.25 0 ) 16πmα = π × 1 −3
× 1 −3
= .  
Finally, plug the derived expressions for alpha and beta into the intensity equation. 
m(cosβ) (sinα/α)I = I 2  2
 
m(cos (πm))(sin(.16πm)/.16πm)I = I 2 2
 
The cos​2 ​
( ) term goes to 1 for all values of m, which leaves.mπ  
m(sin(.16πm)/(.16πm))I = I 2


Table 5:​ The table below shows the calculated I values for the first ten maxima.  
 
m  I in terms of I​m  
1  0.918646 
2  0.705638 
3  0.43846 
4  0.202921 
5  0.054944 
6  0.001771 
7  0.010859 
8  0.036628 
9  0.047153 
10  0.035895 
 

Physics Lab Report