This document is from a physics textbook and covers several key concepts in physics:
- It introduces the scientific method and how physics uses models, hypotheses, and controlled experiments.
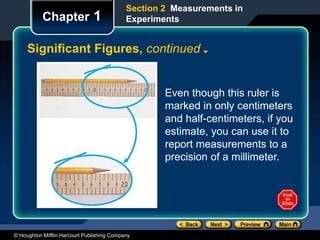
- Measurements in physics must use standard SI units and account for accuracy, precision, and significant figures.
- Physics relies on mathematical relationships between variables that are represented through tables, graphs, and equations. These tools help analyze experimental data and make predictions.