Download as PDF, PPTX
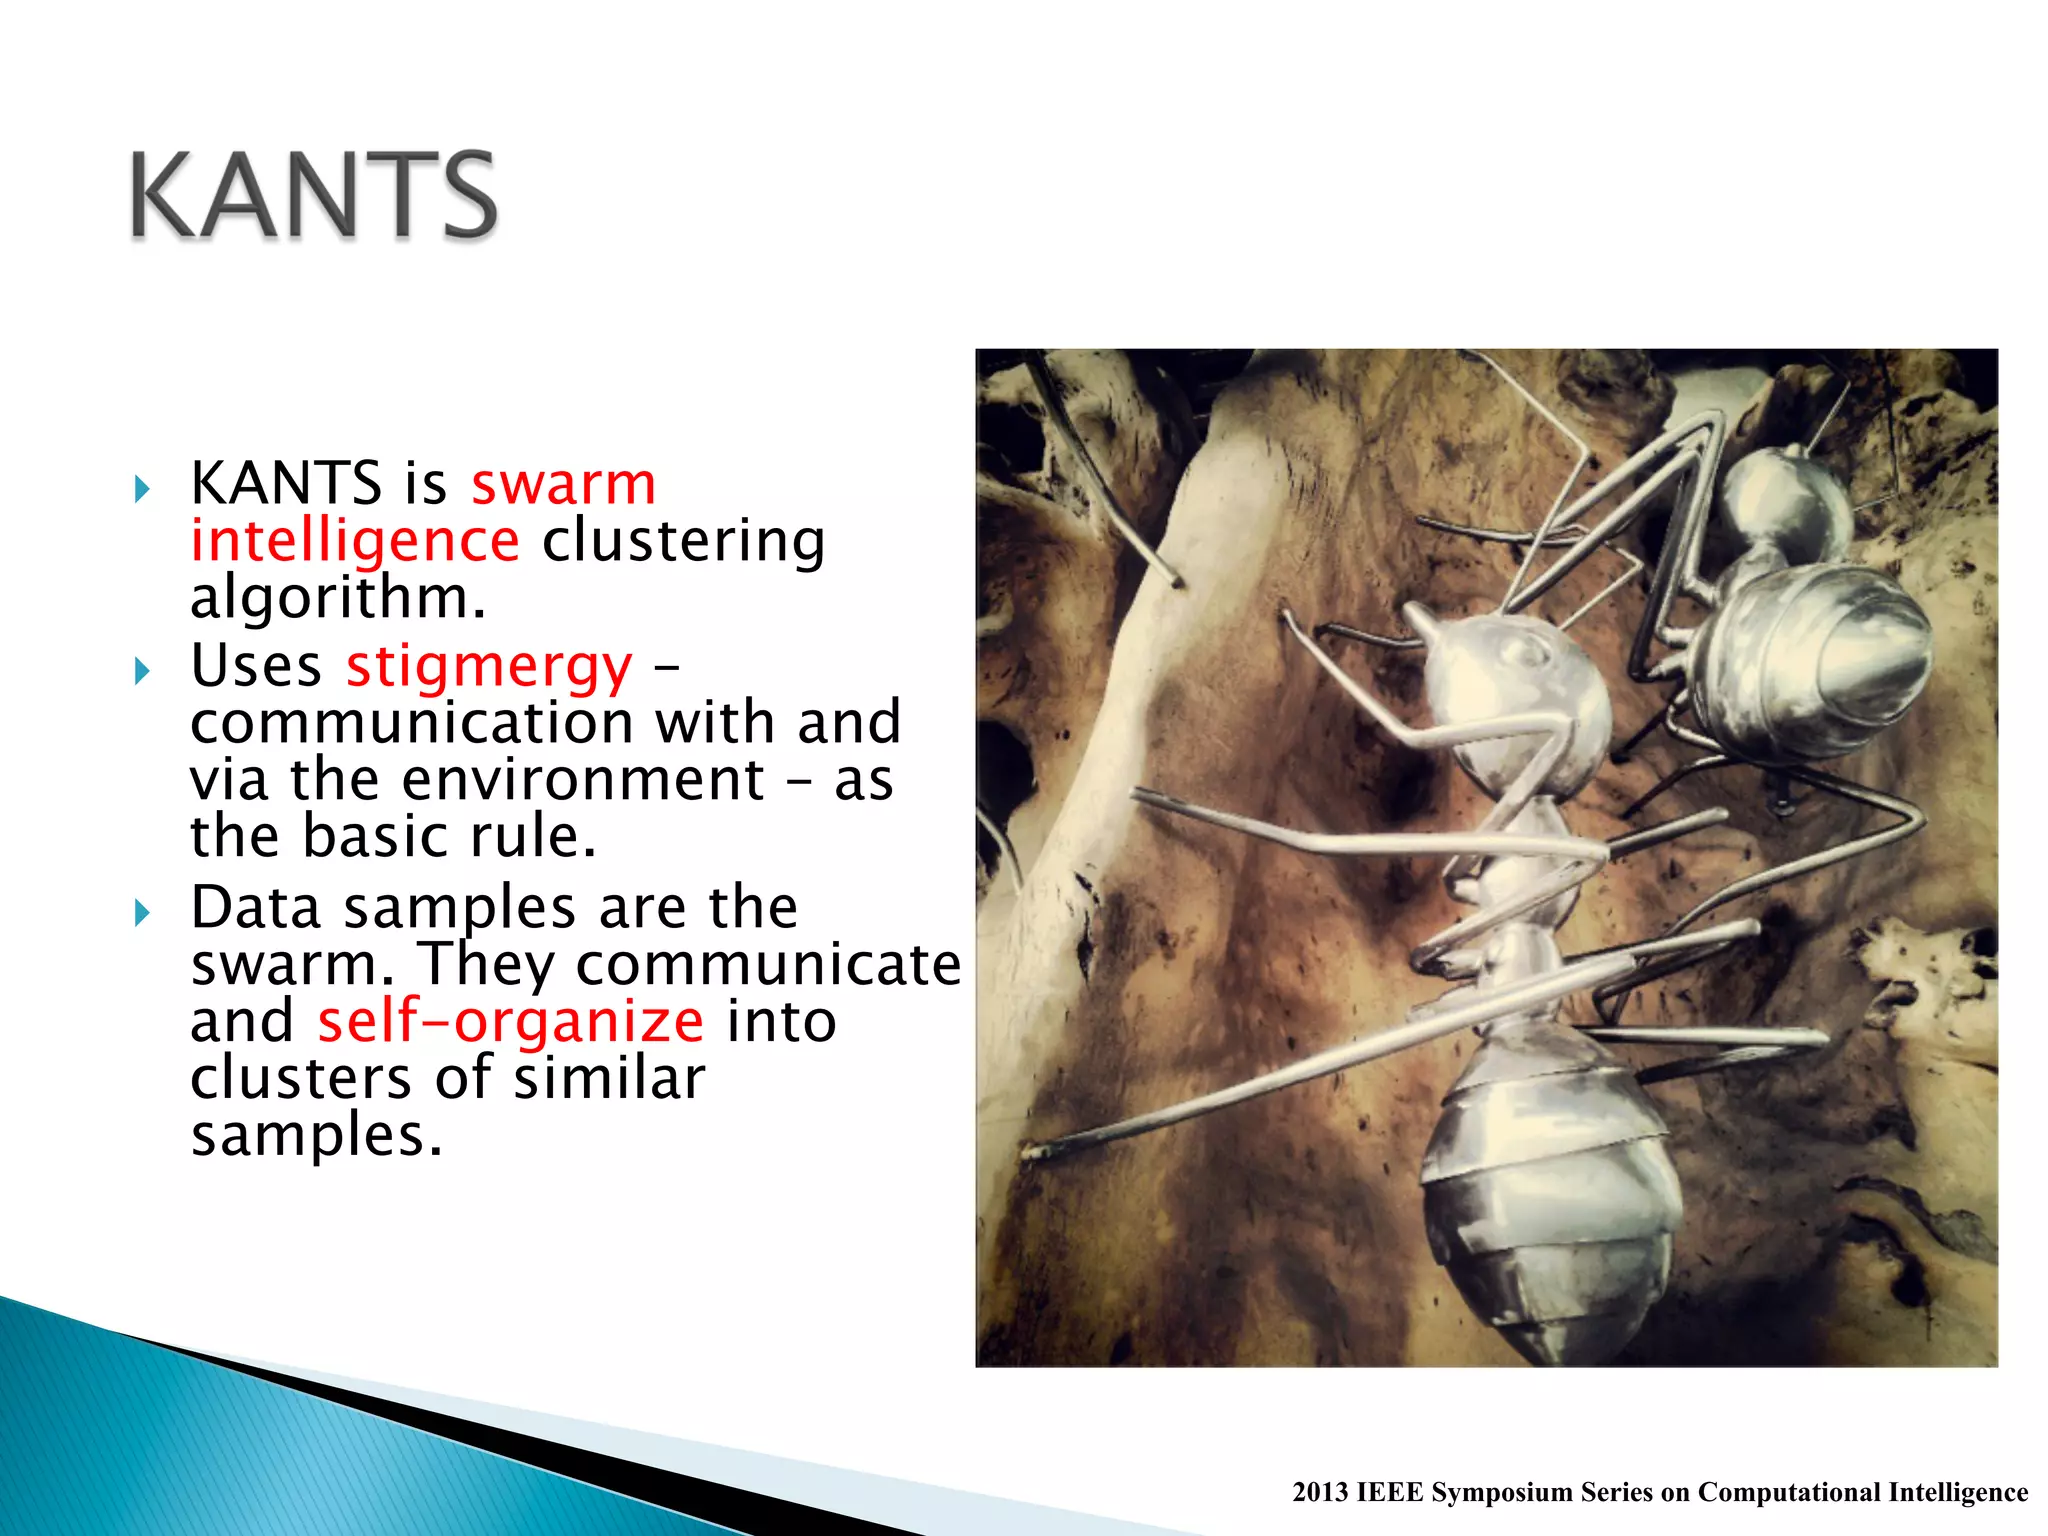
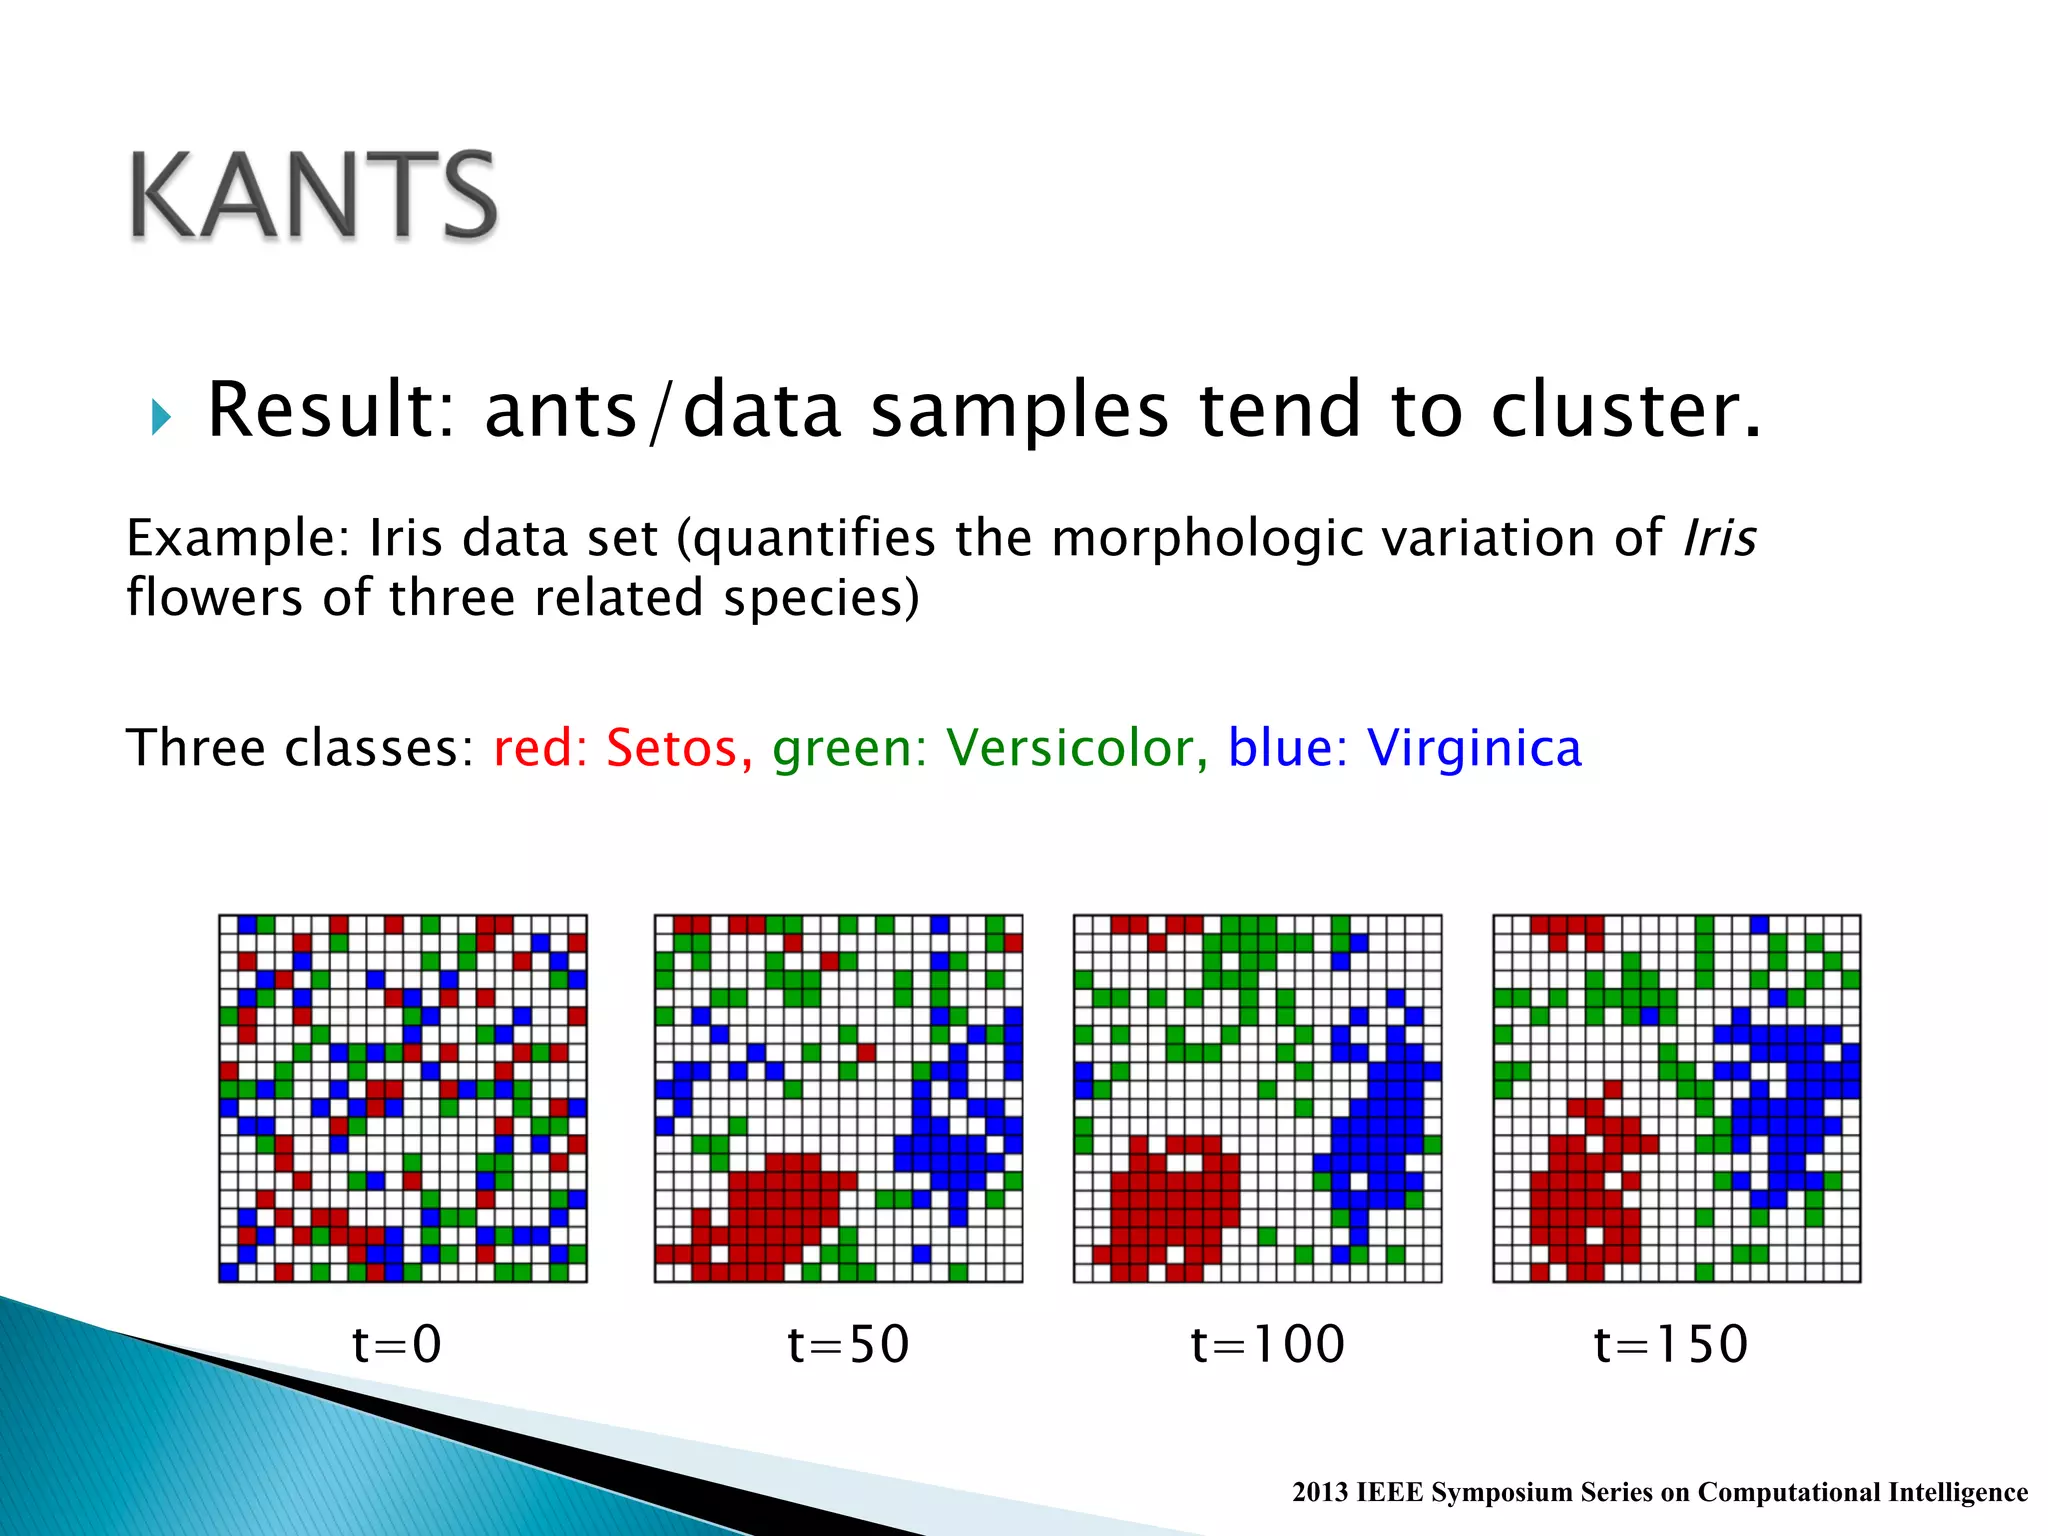
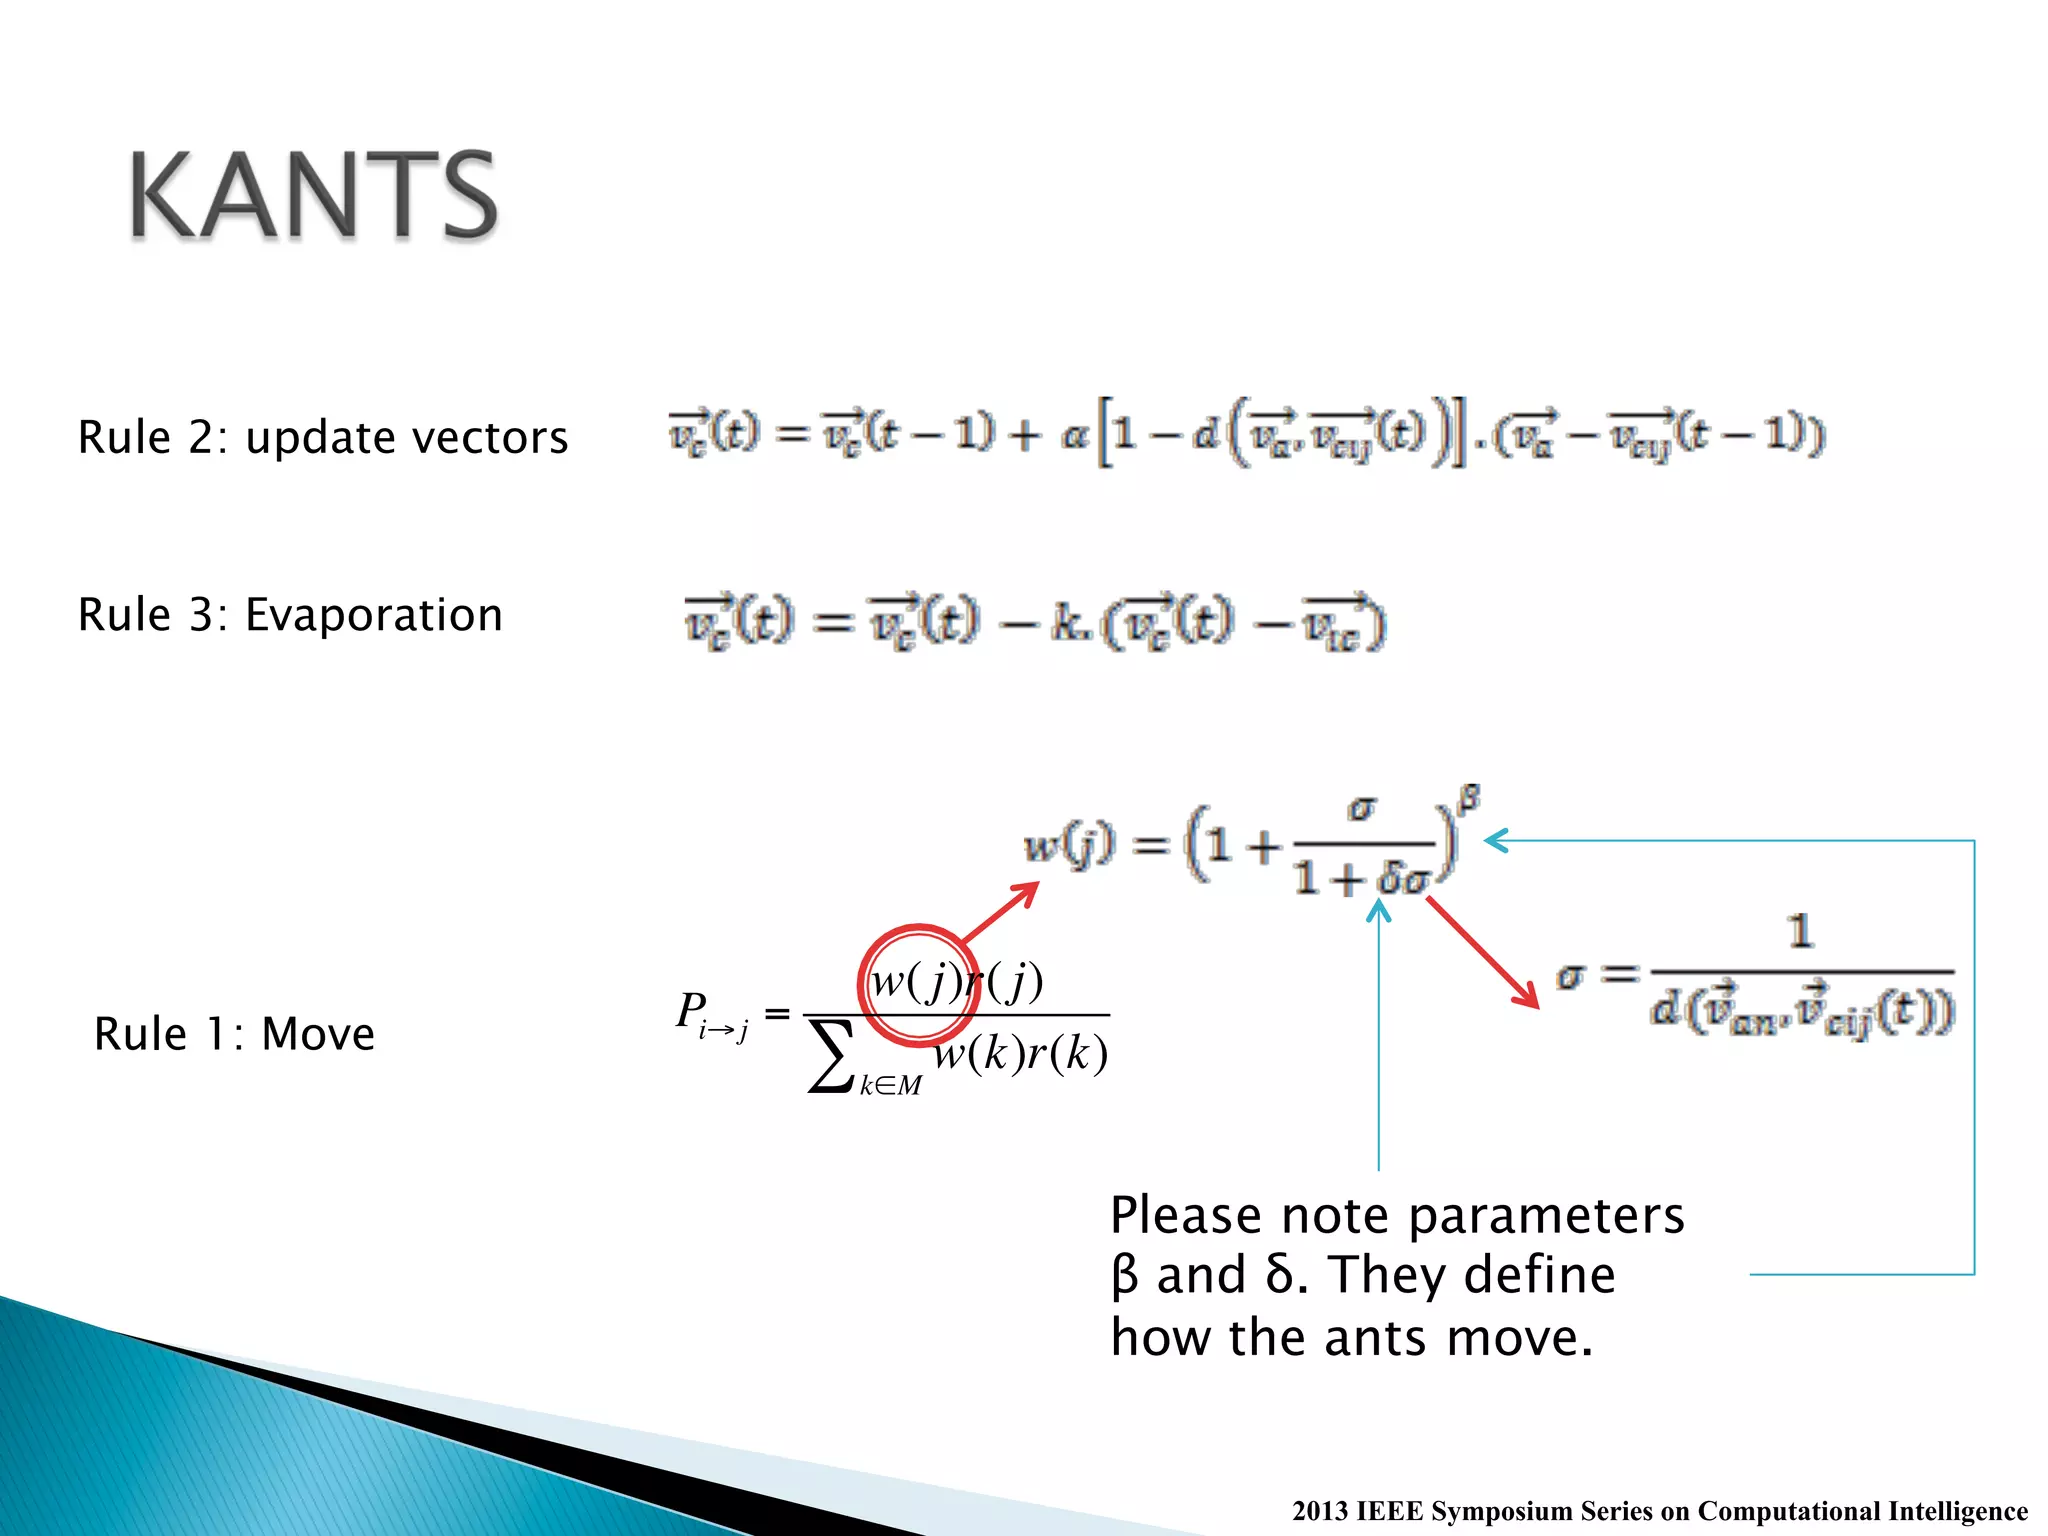
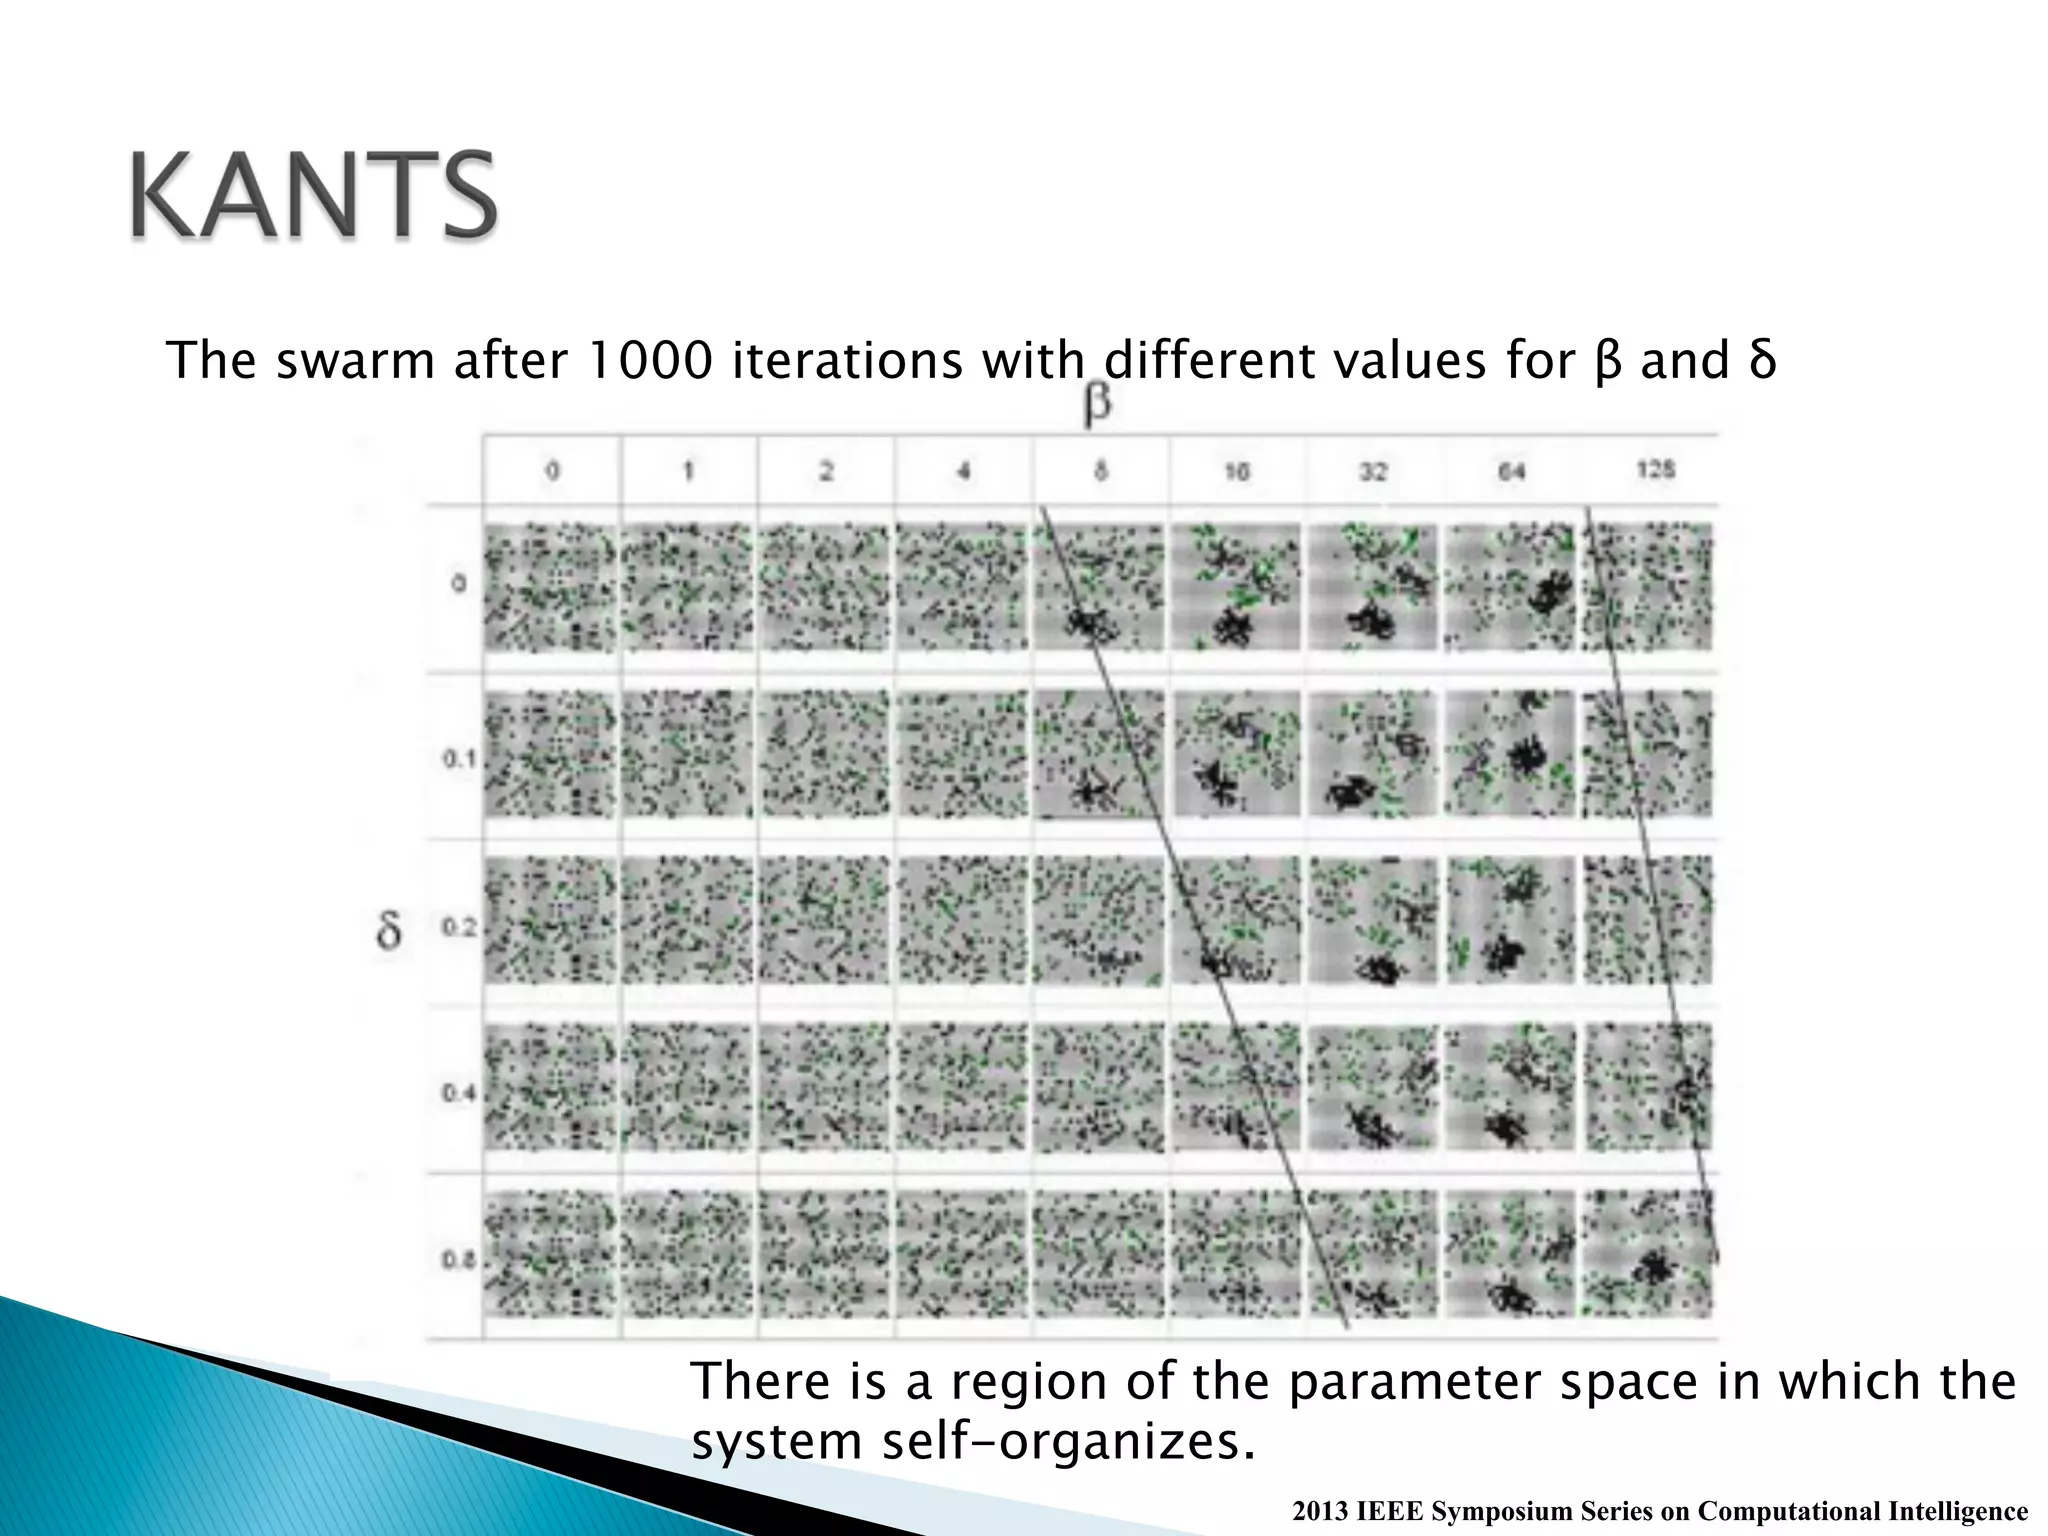
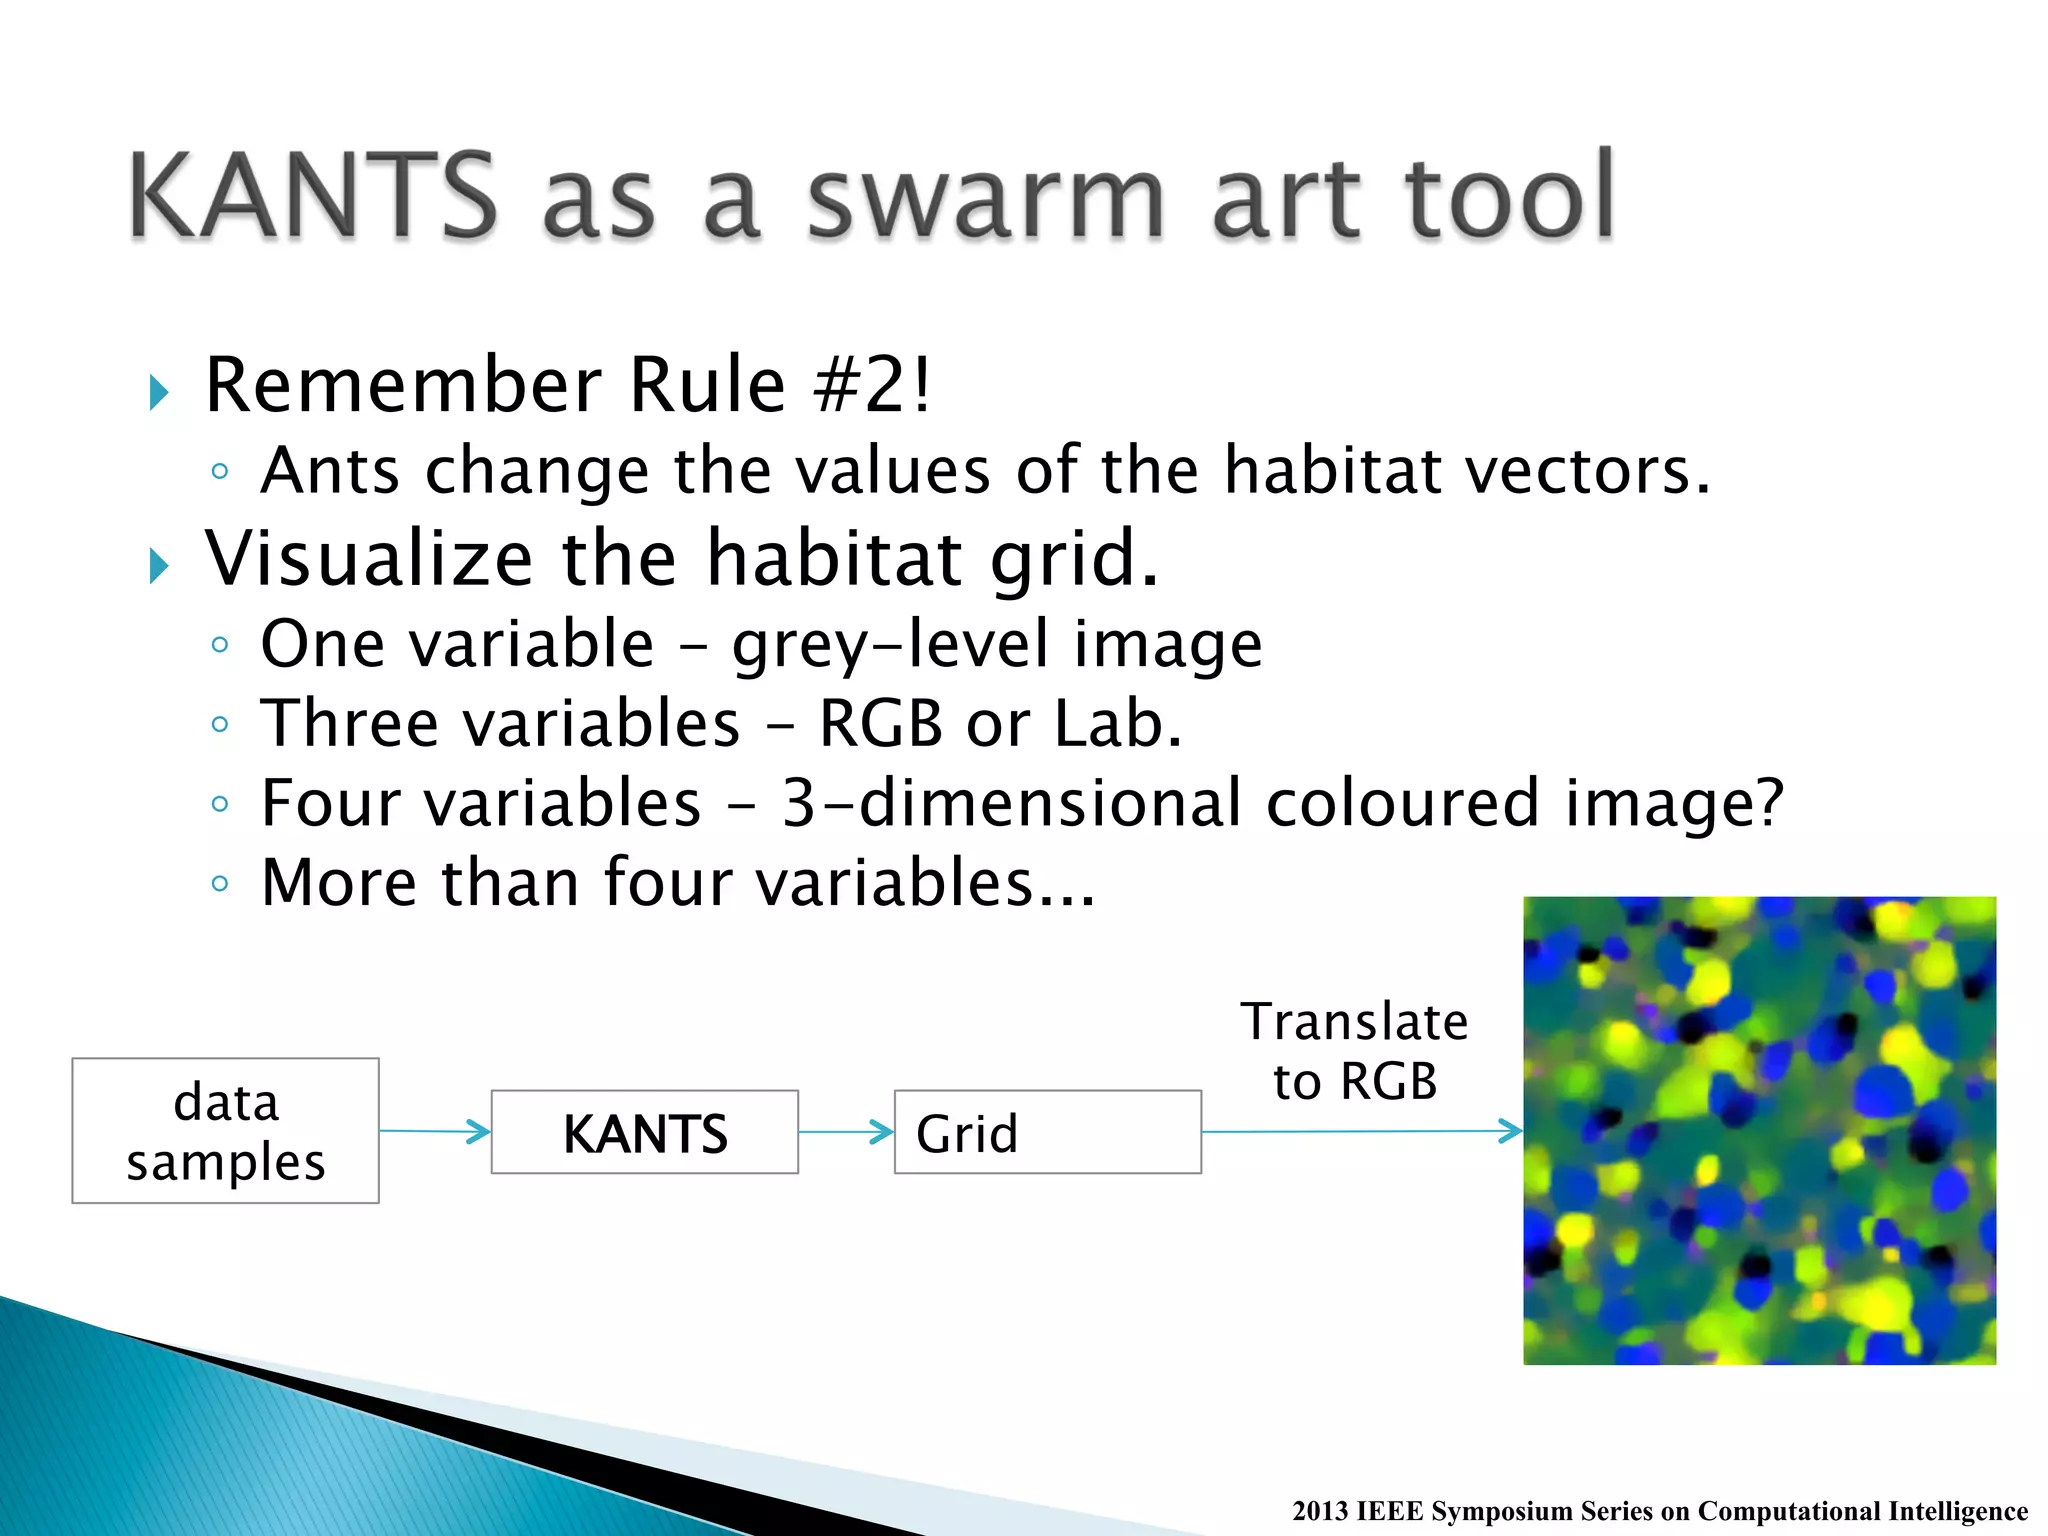
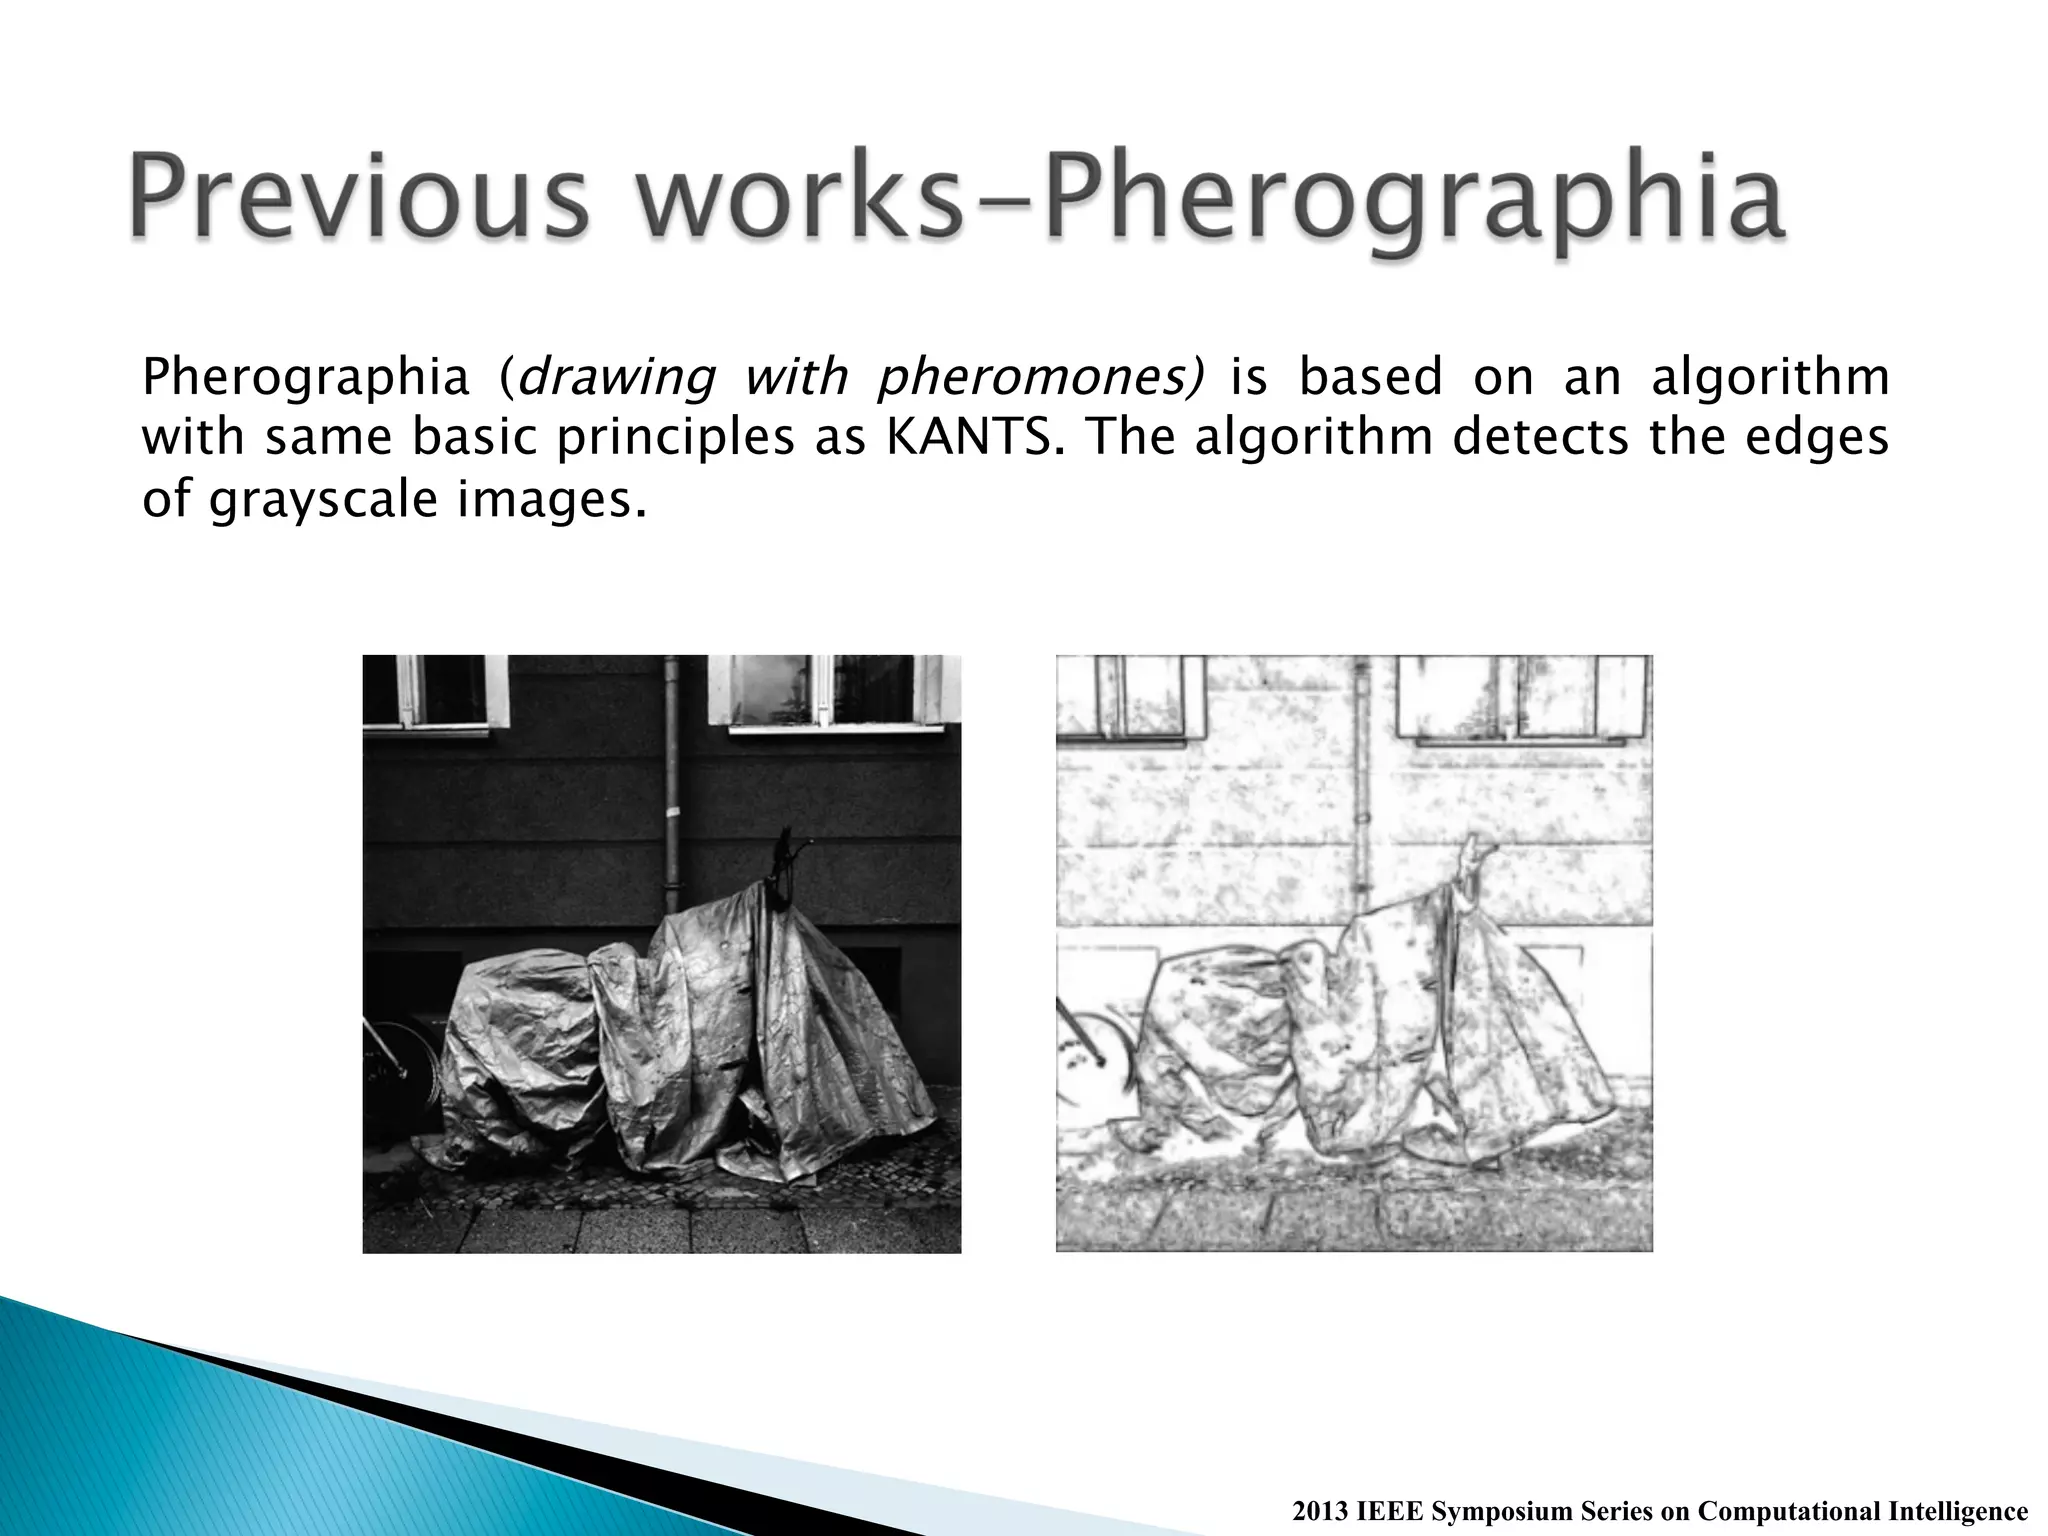
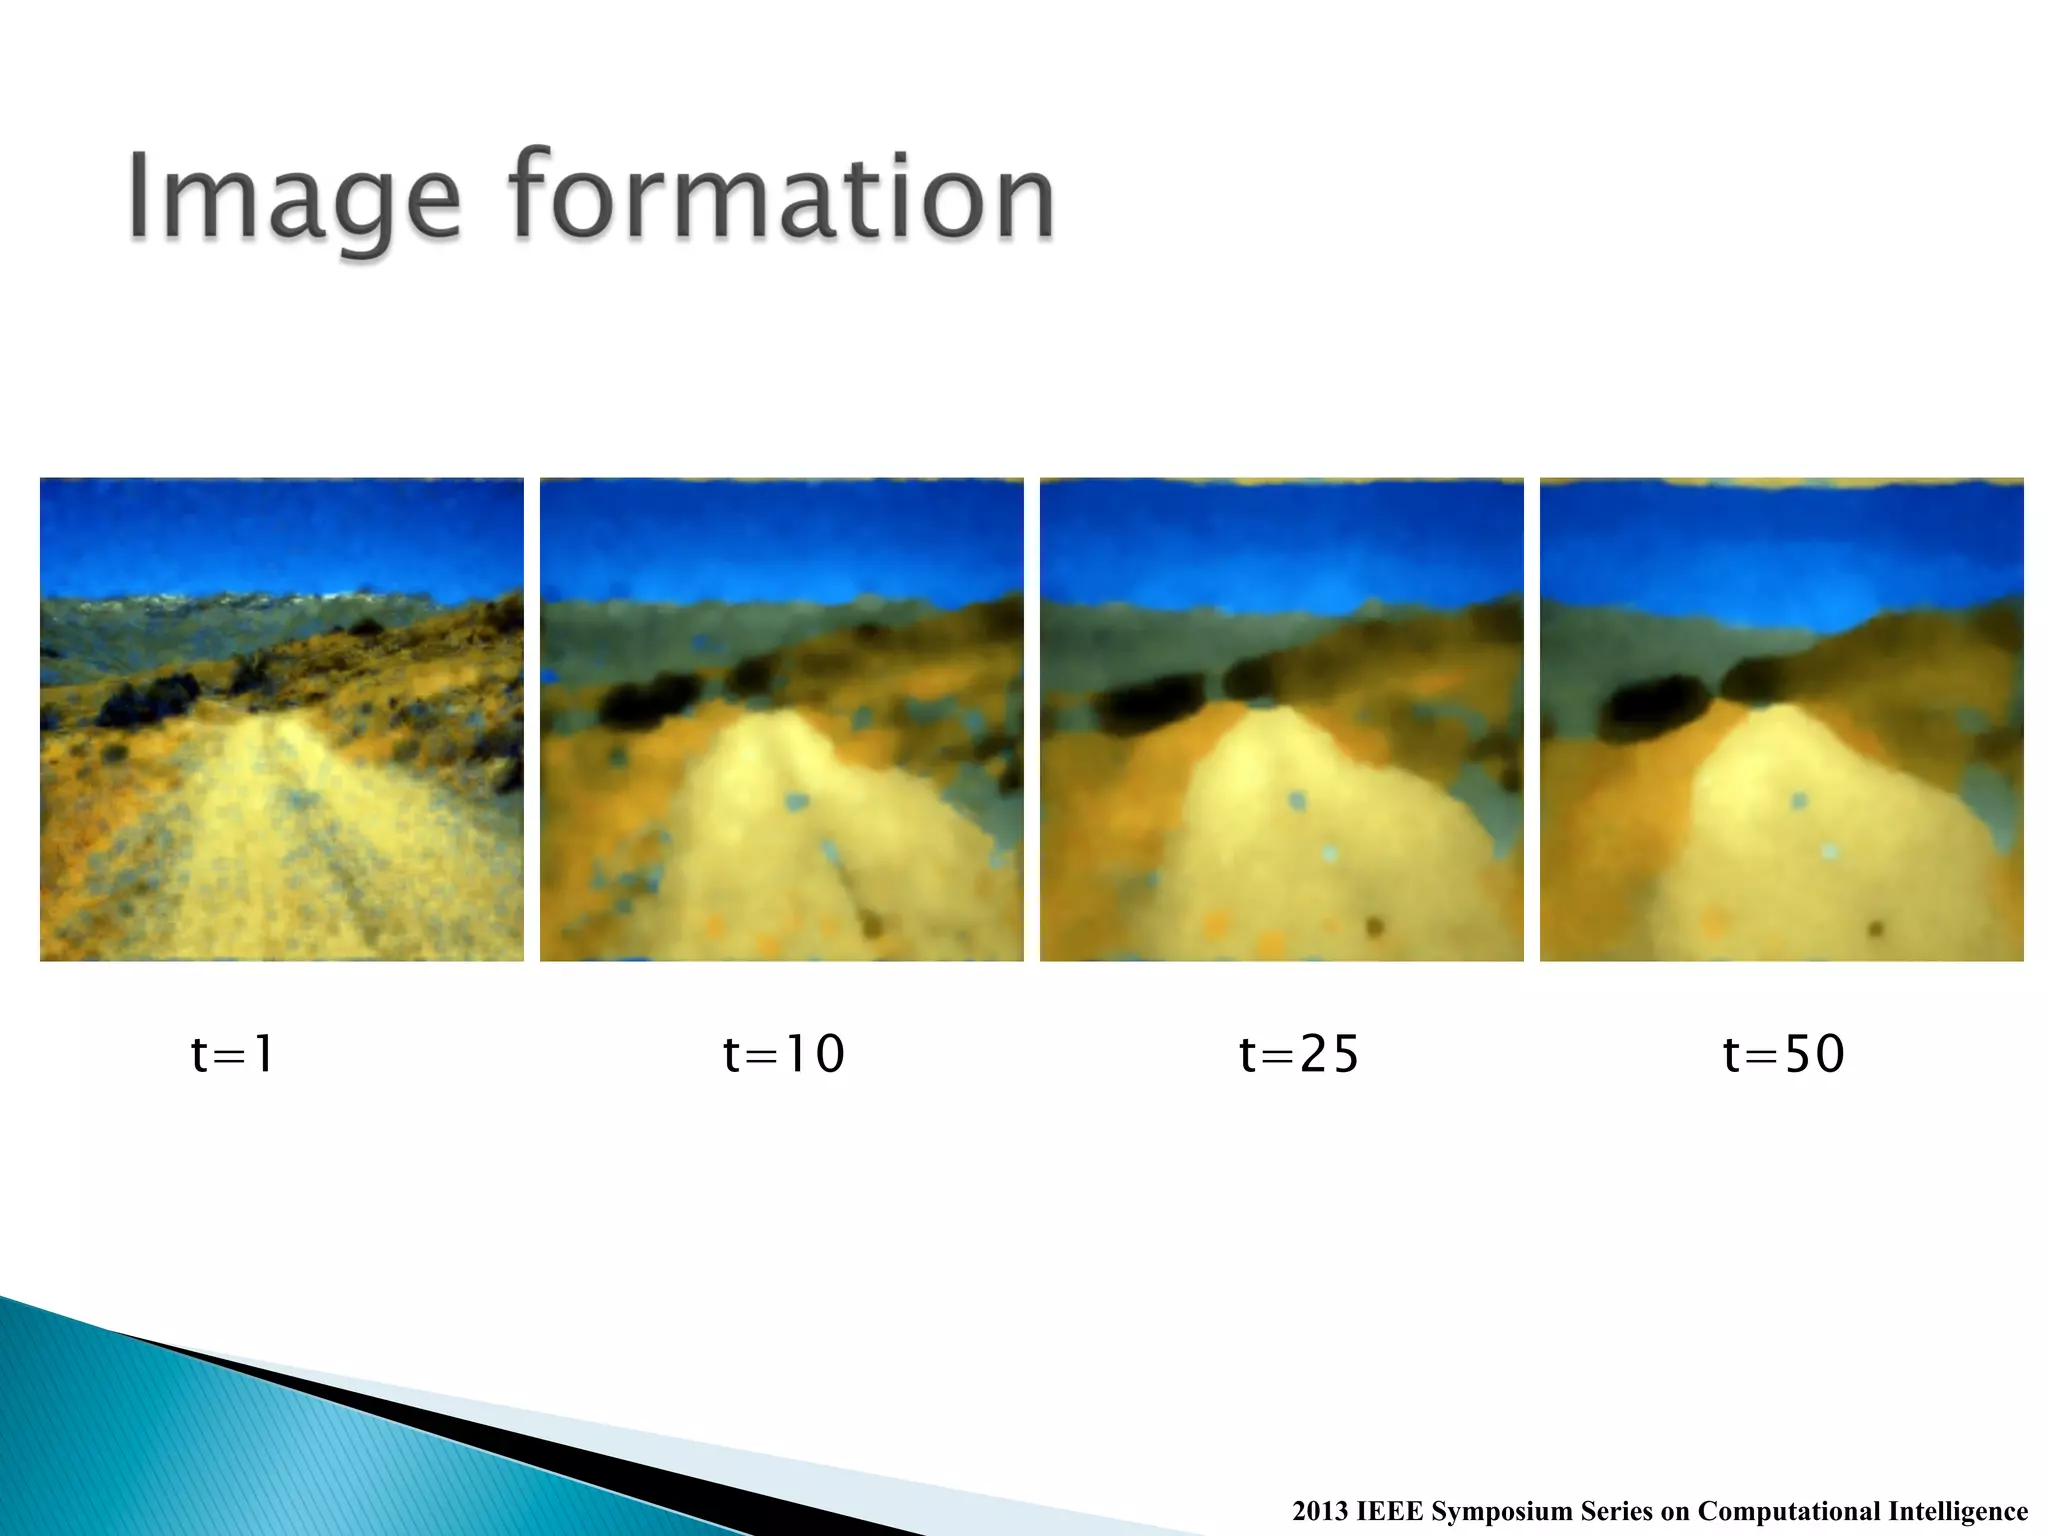
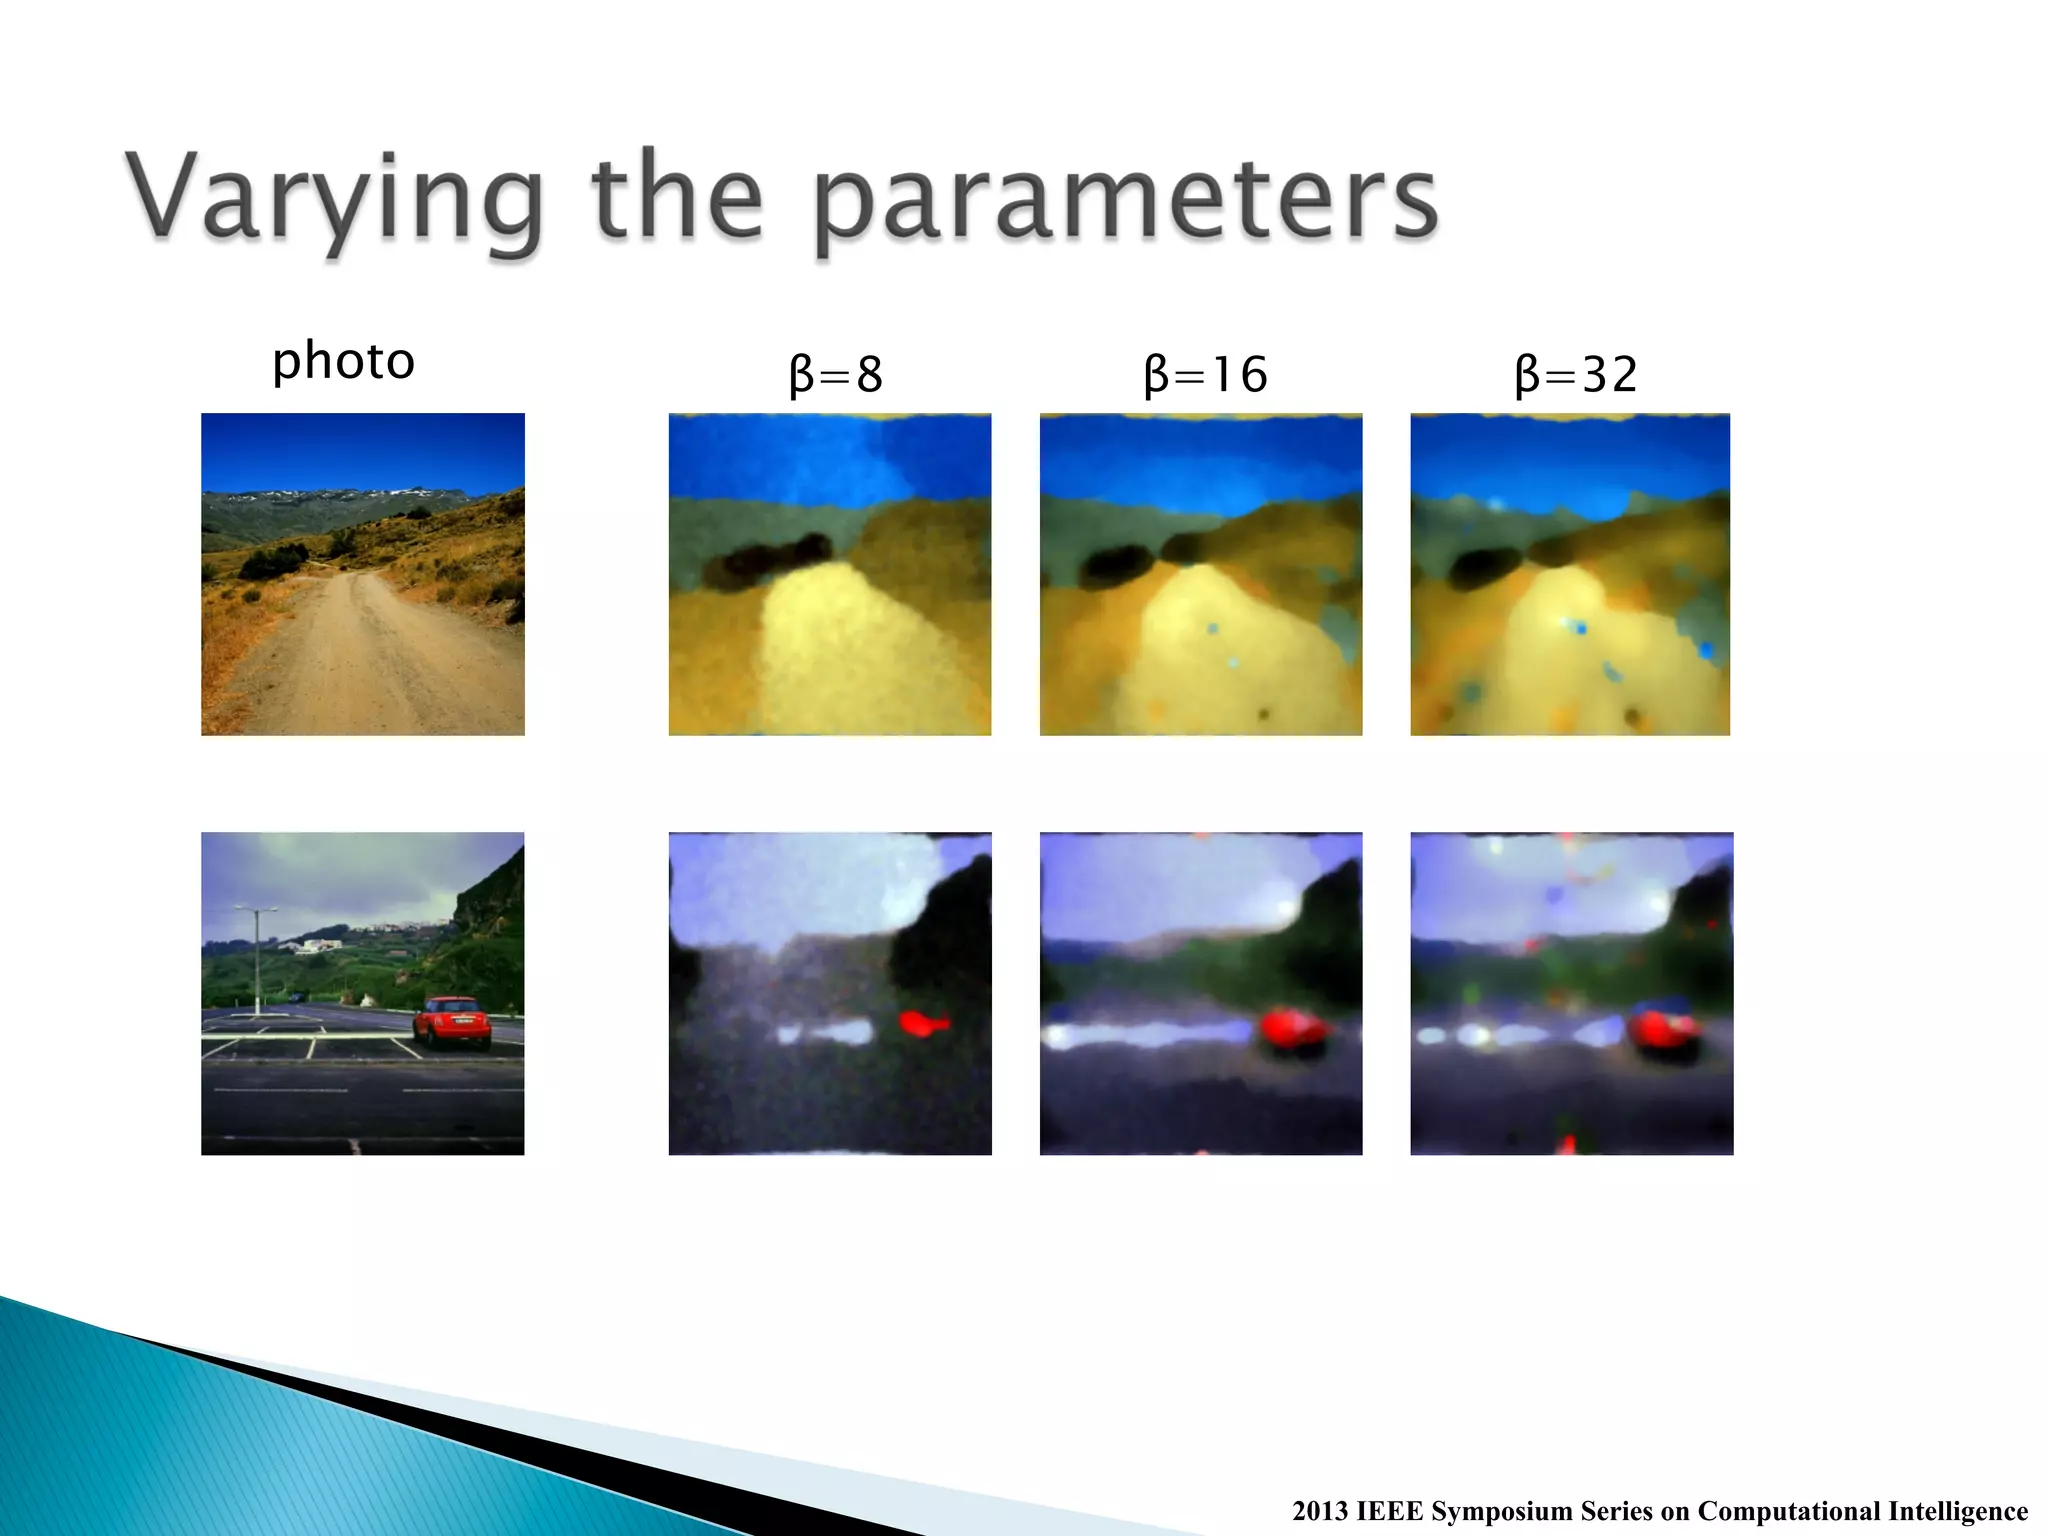
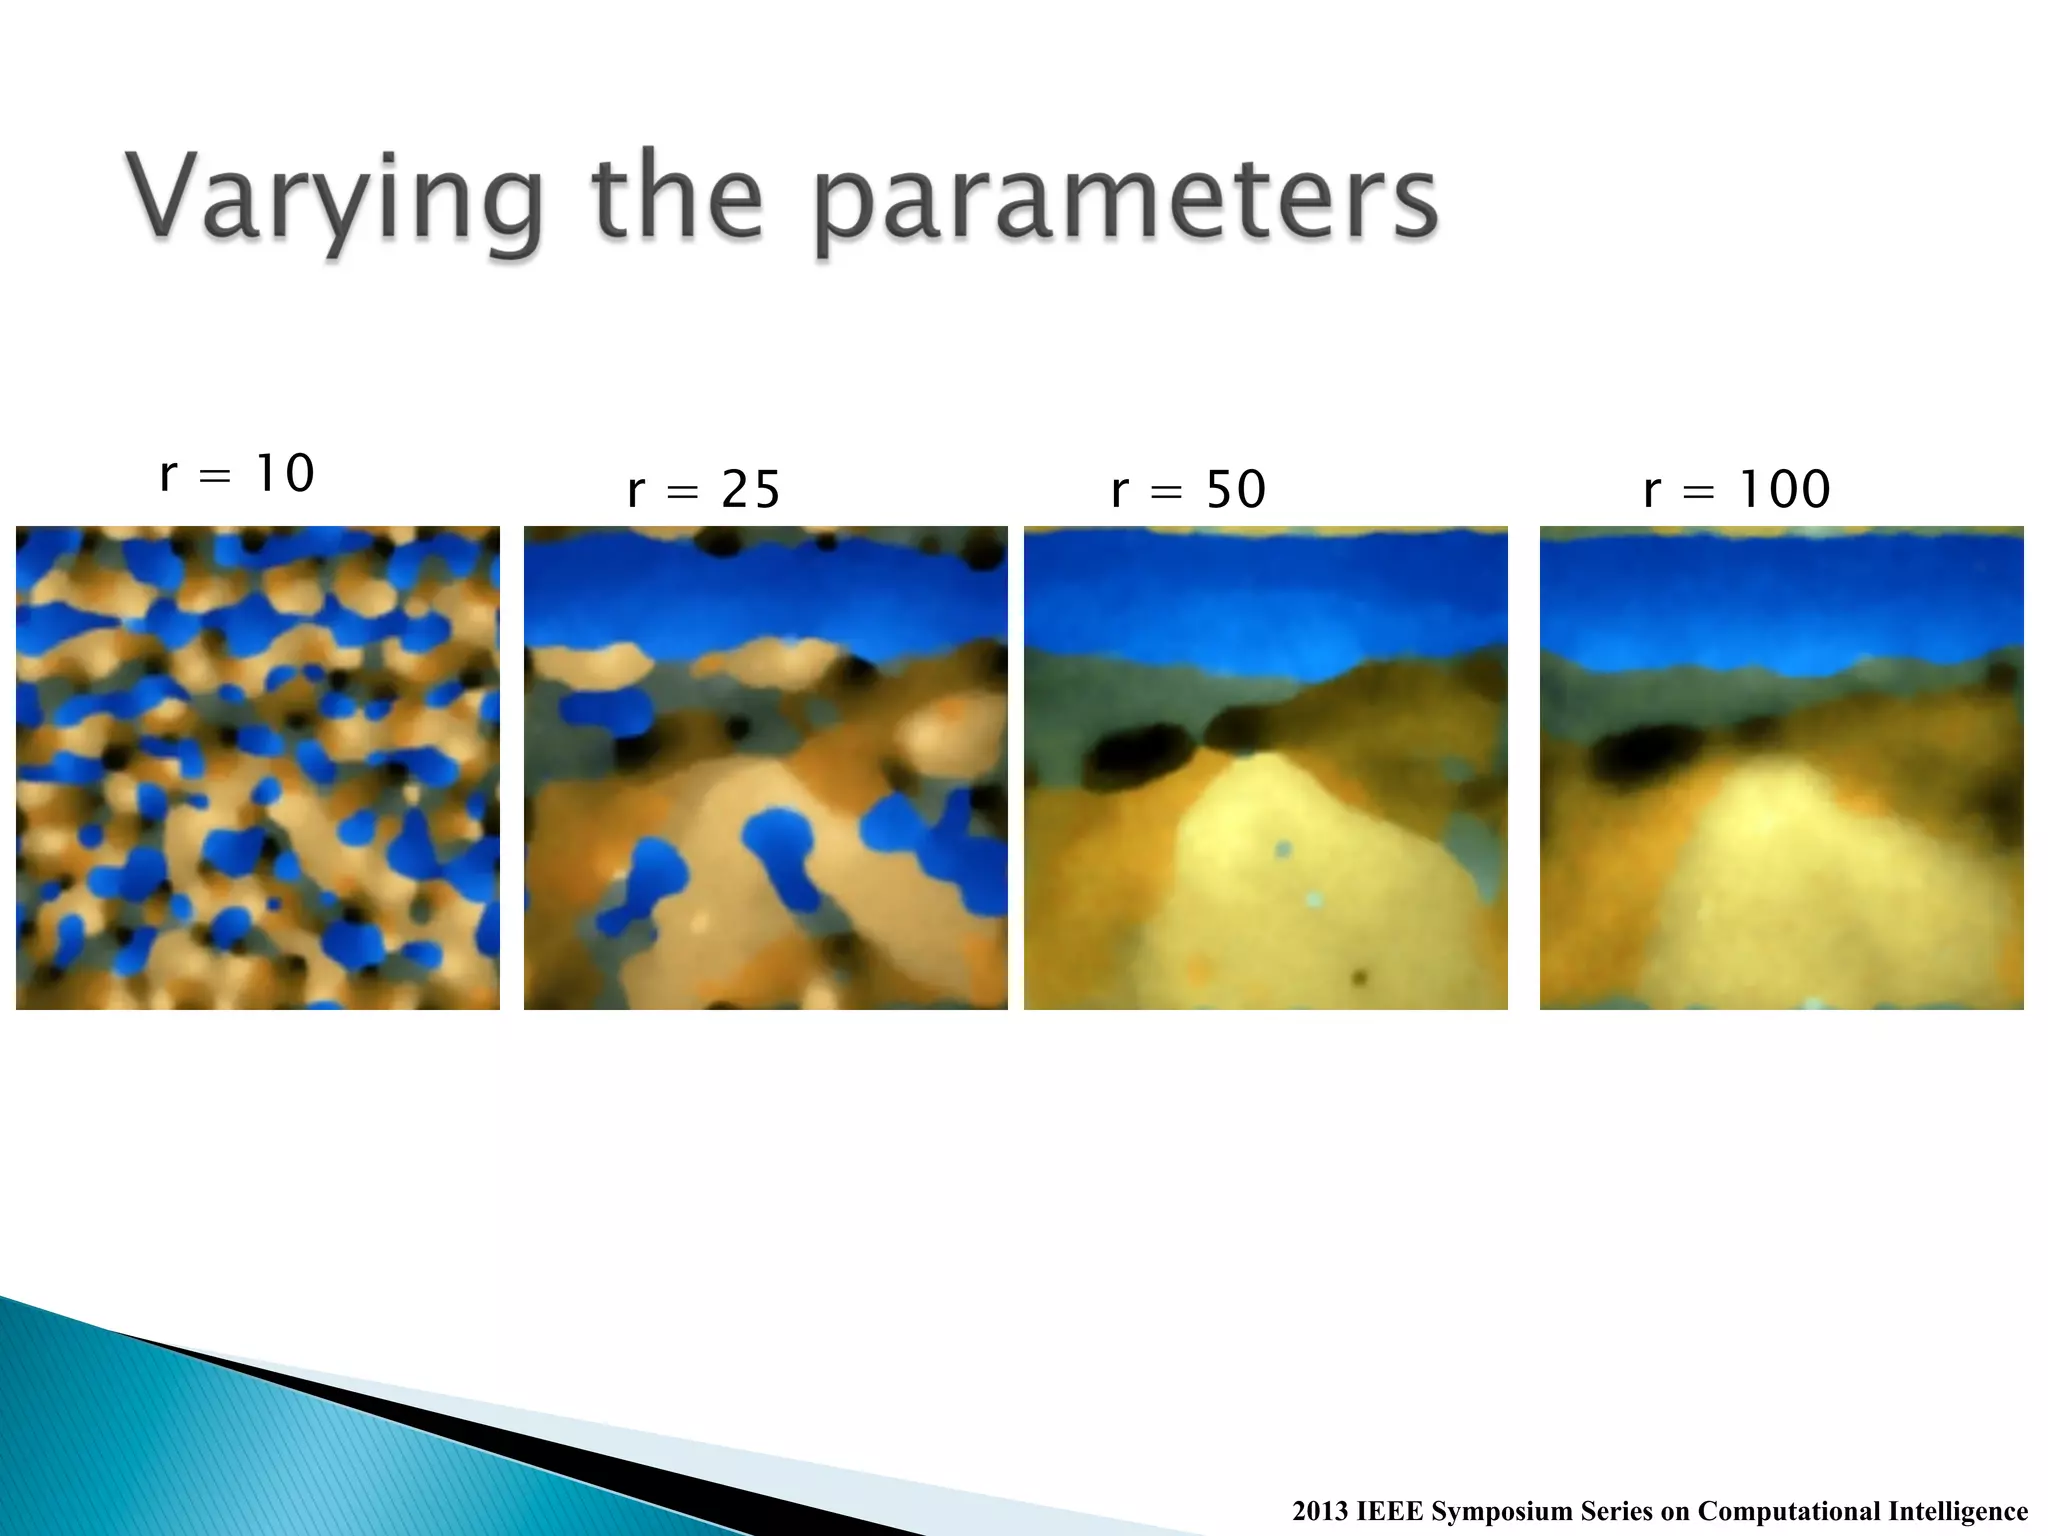

The document discusses the KANTS swarm intelligence clustering algorithm, which utilizes stigmergy for self-organization of data samples into clusters based on their similarity. It highlights the algorithm's parameters and the experimental results using the iris dataset, demonstrating how data samples cluster over iterations. Additionally, the document mentions applications of the algorithm in visualizing sleep data and generating unique representations through color transformations.


![Vibe Coding vs. Spec-Driven Development [Free Meetup]](https://cdn.slidesharecdn.com/ss_thumbnails/vibecodingvsspecdrivendevelopment-251209105622-43f455e7-thumbnail.jpg?width=640&height=640&fit=bounds)


