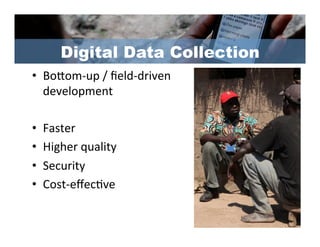
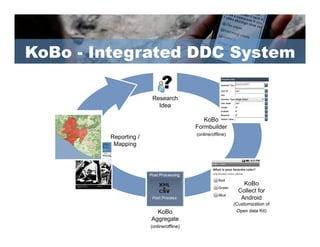
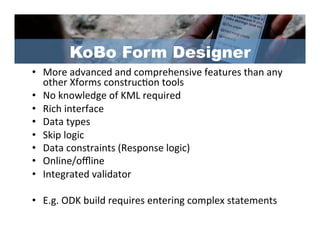
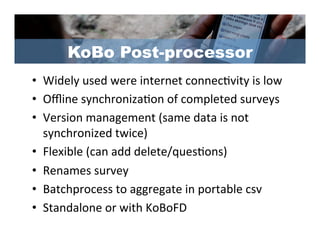
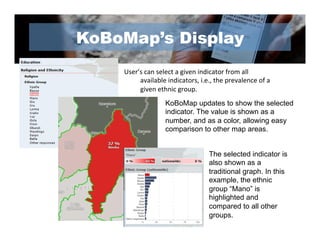
www.kobotoolbox.org/
                                Phuong	
  Pham,	
  Ph.D.	
  
                 Director	
  of	
  Evalua/on	
  and	
  Implementa/on	
  Science	
  	
  
                              Harvard	
  Humanitarian	
  Ini/a/ve	
  
Dept.	
  of	
  Global	
  Health and Population, Harvard	
  School	
  of	
  Public	
  Health	
  
Vulnerable Populations Program
 •  Digital	
  Data	
  Collec/on	
  
 •  Conflict/Post-­‐Conflict	
  
   	
  complex	
  environment	
  
 •  Large	
  scale	
  surveys	
  on	
  violence	
  
   	
  and	
  reconstruc/on	
  
 •  >25,000	
  total	
  interviews	
  
 •  Android-­‐based,	
  open-­‐source	
  
Research
•    Relevance	
  
•    Timing	
  
•    Language	
  
•    Communica/on	
  /	
  Release	
  
     –  Academic	
  journal	
  vs.	
  public	
  report	
  
•  Results	
  as	
  Policy	
  Choices	
  
Research Cycle
                                                                                        Consultation
                                                                                 Civil Society and Others
                               Impact of results                                       - Existing Work
                        Information (data with a purpose)                          - Data Gap / Needs
                                    Advocacy
                                  Policy-Making
                            Evidence-based Decision                                                                          Participation
                                                                                                                 Participatory Design of Instruments,
                                                                                   1.                                        Methodology
                                                                           Problem Statement
                                                                              Understand
                                                                                 Identify


                                                       Ne
                                                           N e R e se
    Capacity Building                                                             Refine


                                                             w
                                                              w
  Research Development


                                                                Ide arch
 Research Implementation


                                                                    a
Data Analysis and Reporting
        Advocacy
     Decision-making                                                                                                   2.
                                                  4.
                                                                                                                 Plan, Design
                                               Release
                                                                              RESEARCH                               Who
                                                Report
                                                                                CYCLE                                How
                                              Workshop
                                                                                                                    Where
                                              Discussion
                                                                                                                     What


                                                                                   3.
                                                                            Implementation


                                                                                                                                            Figure by P. Vinck
                                                                              Field Work

                        Participation
                  Interpretation of Results                                                      Collaboration / Contract
                   Joint recommendations                                                              Data Collection
Digital Data Collection
•  BoPom-­‐up	
  /	
  field-­‐driven	
  
   development	
  

•    Faster	
  
•    Higher	
  quality	
  
•    Security	
  
•    Cost-­‐effec/ve	
  
KoBo - Integrated DDC System

                       Research
                         Idea

                                            KoBo
                                         Formbuilder
                                         (online/offline)
        Reporting /
         Mapping


                                                                KoBo
                                                              Collect for
                                                               Android
                                                            (Customization of
                        KoBo                                 Open data Kit)
                      Aggregate
                      (online/offline)
KoBo Form Designer
•  More	
  advanced	
  and	
  comprehensive	
  features	
  than	
  any	
  
   other	
  Xforms	
  construc/on	
  tools	
  
•  No	
  knowledge	
  of	
  KML	
  required	
  
•  Rich	
  interface	
  
•  Data	
  types	
  
•  Skip	
  logic	
  
•  Data	
  constraints	
  (Response	
  logic)	
  
•  Online/offline	
  
•  Integrated	
  validator	
  

•  E.g.	
  ODK	
  build	
  requires	
  entering	
  complex	
  statements	
  
KoBo Collect
•  Administra/ve	
  /	
  Field	
  interviewer	
  interfaces	
  
KoBo Post-processor
•  Widely	
  used	
  were	
  internet	
  connec/vity	
  is	
  low	
  
•  Offline	
  synchroniza/on	
  of	
  completed	
  surveys	
  
•  Version	
  management	
  (same	
  data	
  is	
  not	
  
   synchronized	
  twice)	
  
•  Flexible	
  (can	
  add	
  delete/ques/ons)	
  
•  Renames	
  survey	
  
•  Batchprocess	
  to	
  aggregate	
  in	
  portable	
  csv	
  
•  Standalone	
  or	
  with	
  KoBoFD	
  
Rapid indicator Mapping
•  Easily	
  create	
  and	
  share	
  hundreds	
  of	
  maps	
  
   from	
  single	
  survey	
  (geographic	
  distribu/on	
  of	
  
   characteris/cs)	
  
KoBoMap	
  allows	
  you	
  to	
  display	
  the	
  results	
  of	
  your	
  
research	
  on	
  a	
  map	
  with	
  user	
  selectable	
  indicators.  	


KoBoMap’s Display
    User’s	
  can	
  select	
  a	
  given	
  indicator	
  from	
  all	
  
         available	
  indicators,	
  i.e.,	
  the	
  prevalence	
  of	
  a	
  
         given	
  ethnic	
  group.	
  	
  
                        KoBoMap updates to show the selected
                        indicator. The value is shown as a
                        number, and as a color, allowing easy
                        comparison to other map areas.


                                              The selected indicator is
                                              also shown as a
                                              traditional graph. In this
                                              example, the ethnic
                                              group “Mano” is
                                              highlighted and
                                              compared to all other
                                              groups.
www.peacebuildingdata.org/liberia/map

KoBo Toolbox

  • 1.
    www.kobotoolbox.org/ Phuong  Pham,  Ph.D.   Director  of  Evalua/on  and  Implementa/on  Science     Harvard  Humanitarian  Ini/a/ve   Dept.  of  Global  Health and Population, Harvard  School  of  Public  Health  
  • 2.
    Vulnerable Populations Program •  Digital  Data  Collec/on   •  Conflict/Post-­‐Conflict    complex  environment   •  Large  scale  surveys  on  violence    and  reconstruc/on   •  >25,000  total  interviews   •  Android-­‐based,  open-­‐source  
  • 3.
    Research •  Relevance   •  Timing   •  Language   •  Communica/on  /  Release   –  Academic  journal  vs.  public  report   •  Results  as  Policy  Choices  
  • 4.
    Research Cycle Consultation Civil Society and Others Impact of results - Existing Work Information (data with a purpose) - Data Gap / Needs Advocacy Policy-Making Evidence-based Decision Participation Participatory Design of Instruments, 1. Methodology Problem Statement Understand Identify Ne N e R e se Capacity Building Refine w w Research Development Ide arch Research Implementation a Data Analysis and Reporting Advocacy Decision-making 2. 4. Plan, Design Release RESEARCH Who Report CYCLE How Workshop Where Discussion What 3. Implementation Figure by P. Vinck Field Work Participation Interpretation of Results Collaboration / Contract Joint recommendations Data Collection
  • 6.
    Digital Data Collection • BoPom-­‐up  /  field-­‐driven   development   •  Faster   •  Higher  quality   •  Security   •  Cost-­‐effec/ve  
  • 7.
    KoBo - IntegratedDDC System Research Idea KoBo Formbuilder (online/offline) Reporting / Mapping KoBo Collect for Android (Customization of KoBo Open data Kit) Aggregate (online/offline)
  • 8.
    KoBo Form Designer • More  advanced  and  comprehensive  features  than  any   other  Xforms  construc/on  tools   •  No  knowledge  of  KML  required   •  Rich  interface   •  Data  types   •  Skip  logic   •  Data  constraints  (Response  logic)   •  Online/offline   •  Integrated  validator   •  E.g.  ODK  build  requires  entering  complex  statements  
  • 9.
    KoBo Collect •  Administra/ve  /  Field  interviewer  interfaces  
  • 10.
    KoBo Post-processor •  Widely  used  were  internet  connec/vity  is  low   •  Offline  synchroniza/on  of  completed  surveys   •  Version  management  (same  data  is  not   synchronized  twice)   •  Flexible  (can  add  delete/ques/ons)   •  Renames  survey   •  Batchprocess  to  aggregate  in  portable  csv   •  Standalone  or  with  KoBoFD  
  • 11.
    Rapid indicator Mapping • Easily  create  and  share  hundreds  of  maps   from  single  survey  (geographic  distribu/on  of   characteris/cs)  
  • 12.
    KoBoMap  allows  you  to  display  the  results  of  your   research  on  a  map  with  user  selectable  indicators.    
  • 13.
    KoBoMap’s Display User’s  can  select  a  given  indicator  from  all   available  indicators,  i.e.,  the  prevalence  of  a   given  ethnic  group.     KoBoMap updates to show the selected indicator. The value is shown as a number, and as a color, allowing easy comparison to other map areas. The selected indicator is also shown as a traditional graph. In this example, the ethnic group “Mano” is highlighted and compared to all other groups.
  • 14.