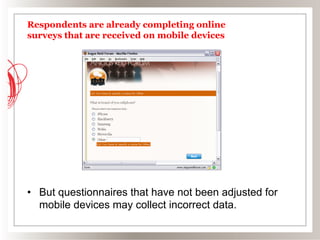
Best Practices in Mobile Data Collection


      Manuel Zahariev, Chris Ferneyhough, Chris Ryan, Sonia Bishop
                              October 2009
BACKGROUND
The Mobile Internet is Outpacing Desktop
Internet Adoption
Respondents are already receiving online surveys
that are on their mobile devices

•  The mobile screening study sent to three Vision
   Critical national panels, August 2009


 National Panel                 USA     UK          Canada
 Did you receive the
 invitation to this survey on
 your phone?
     YES                         1.9%        1.2%     3.8%
Respondents are already completing online
  surveys that are received on mobile devices


•  But questionnaires that have not been adjusted for mobile devices
   are difficult to complete.
Respondents are already completing online
surveys that are received on mobile devices


•  But questionnaires that have not been adjusted for
   mobile devices may collect incorrect data.
Online content goes mobile
Big idea

•  Mobile data collection should be optimized for the
   devices it is targeted to.

•  ...but how to do that?
Wide variety of smartphones


  •  from GSMArena.com
Wide variety of smartphones by country


  National Panel        USA      UK      Canada
 TOTAL included         94%     96%       92%
 Apple iPhone           2%       2%       13%
 BlackBerry (RIM)       5%       3%       31%
 LG                     20%      6%       11%
 Motorola               25%      8%       12%
 Nokia                  12%     36%       6%
 Samsung                20%     18%       14%
 Sony Ericsson          2%      18%       3%
 Other                  7%       5%       2%
Different phones have different capabilities

•     Other-specify is usually implemented by survey
     vendors using client-side scripting
     –  client-side scripting is disabled by default on a number
        of phones (e.g. Blackberry)
     –  the data your survey collected may be wrong
•  Colors and fonts are implemented differently by
   different phones... or not implemented at all
     –  a certain color or emphasis may render your some of
        your stimuli unreadable
Different respondents have different
constraints
•  Many respondents are not familiar with the use of the
   web browser or the alphanumeric entry mode on their
   phone
   –  Don t make assumptions about the ability of
      respondents to fill in questionnaires on their mobile
      phone


•  Many respondents are concerned about data costs
   –  some have unlimited downloads phone plans
   –  others have pay-as-you go plans
•  Many respondents have low data connection speeds
   –  minimize the use of images and other media in your
      questionnaires
RESEARCH PROJECT
Methodology

•  All respondents are smartphone users.
•  All indicate a willingness to complete questionnaires
   on their smartphone
   –  Canada | n=500 On Mobile Device
   –  Canada | n=500 Using traditional (desktop/ laptop)
      Internet
      •  Both samples were balanced on gender and age and
         results were weighted with the same weighting scheme
         (by gender and age).
   –  US | n=118 On Mobile Device
   –  UK | n=107 On Mobile Device
      •  Incidence of smartphone users willing to complete
         questionnaire on smartphone was too low in US/ UK.
Traditional online experience vs. mobile
device experience
Results

•  Chose a topical subject: the economy.
•  The data revealed remarkable similarities.
•  The single choice questions on the Canadian
   economy and personal finances were almost
   identical.
•  The multi-choice responses were also very similar
   with no statistically significant differences.
Current Economic Conditions

                                 Poor                                     Good


                    48%                              CDN Online (n=500)          49%


                     46%                             CDN Mobile (n=500)          51%


      80%                                                 US (n=118)       20%


      80%                                                 UK (n=107)       20%


Base: All respondents
M1. How would you rate the current economic conditions in ….today?
State of Personal Finances

                                  Poor                                     Good


                           31%                        CDN Online (n=500)                      68%


                           32%                        CDN Mobile (n=500)                      67%


                     46%                                   US (n=118)                   54%


                56%                                        UK (n=107)             42%


Base: All respondents
M2. How would you rate the state of your own personal finances today?
Measures Taken


                                                    CDN Online           CDN Mobile                US                   UK
                                                     (n=500)              (n=500)                (n=118)              (n=107)

         Cut my spending                                 62%                  60%                  72%                     70%

         Paid down debt                                  41%                  41%                  43%                     21%

         Taken on another job                            9%                   8%                   14%                     9%

         Refinanced my mortgage                          9%                   8%                   10%                     5%
         Tapped into my retirement funds
                                                         8%                   7%                   10%                     7%
         to help make ends meet
         Sold investments                                7%                   7%                   9%                      6%

         None of the above                               23%                  22%                  13%                     18%


Base: All respondents
M3. Which of the following measures have you taken, if any, to deal with the current economic situation in your country?
Likelihood to Participate in Future Surveys

                                                            More Likely


                               CDN Mobile (n=500)                       38%


                                         US (n=118)                                 66%


                                         UK (n=107)                           53%


Base: All respondents
M13. If I had the option of completing surveys via my phone, I would be …
Likelihood to Participate in Future Surveys

                                                            More Likely


                                          BlackBerry (n=294)                  34%


                                               iPhone (n=167)                       47%


                                                  Other (n=39)              23%


Base: All respondents
M13. If I had the option of completing surveys via my phone, I would be …
CONCLUSIONS
Back-end mobile research best practices

•  Minimize the survey skin to maximize the screen size/
   space
•  Profile your panel for Smartphones
       •    Brand and model of device
       •    Business or personal phone
       •    Email address for Smartphone
       •    Interest/willingness to do surveys via phone
•  Identify devices and models supported in your data
   collection software
   –  Major brands are BlackBerry, iPhone, Nokia, Motorola,
      Samsung
   –  But there are many more and many models
•  Manage deployment process
   –  Process for occasions when email address for mobile
      surveys is different from main panel email address
Mobile questionnaire design best practices

1.  Design the questionnaire based on the question
    types supported (single choice, multi-choice, open
    ends)
Mobile questionnaire design best practices

2.  Design the questionnaire differently (shorter, more
    concise). Have less text in the questions and answer
    categories.
Mobile questionnaire design best practices

3.  Limit survey length to 15 questions (although in
    theory higher incentives can be used for longer
    surveys).
4.  Keep it simple:
  –  use only single-choice, multi-choice and verbatim
     questions
  –  use alternatives for other/specify
  –  avoid the use of color
  –  don t use grids
  –  don t use images

Best Practices in Mobile Data Collection

  • 1.
    Best Practices inMobile Data Collection Manuel Zahariev, Chris Ferneyhough, Chris Ryan, Sonia Bishop October 2009
  • 2.
  • 3.
    The Mobile Internetis Outpacing Desktop Internet Adoption
  • 4.
    Respondents are alreadyreceiving online surveys that are on their mobile devices •  The mobile screening study sent to three Vision Critical national panels, August 2009 National Panel USA UK Canada Did you receive the invitation to this survey on your phone? YES 1.9% 1.2% 3.8%
  • 5.
    Respondents are alreadycompleting online surveys that are received on mobile devices •  But questionnaires that have not been adjusted for mobile devices are difficult to complete.
  • 6.
    Respondents are alreadycompleting online surveys that are received on mobile devices •  But questionnaires that have not been adjusted for mobile devices may collect incorrect data.
  • 7.
  • 8.
  • 9.
    Big idea •  Mobiledata collection should be optimized for the devices it is targeted to. •  ...but how to do that?
  • 10.
    Wide variety ofsmartphones •  from GSMArena.com
  • 11.
    Wide variety ofsmartphones by country National Panel USA UK Canada TOTAL included 94% 96% 92% Apple iPhone 2% 2% 13% BlackBerry (RIM) 5% 3% 31% LG 20% 6% 11% Motorola 25% 8% 12% Nokia 12% 36% 6% Samsung 20% 18% 14% Sony Ericsson 2% 18% 3% Other 7% 5% 2%
  • 12.
    Different phones havedifferent capabilities •  Other-specify is usually implemented by survey vendors using client-side scripting –  client-side scripting is disabled by default on a number of phones (e.g. Blackberry) –  the data your survey collected may be wrong •  Colors and fonts are implemented differently by different phones... or not implemented at all –  a certain color or emphasis may render your some of your stimuli unreadable
  • 13.
    Different respondents havedifferent constraints •  Many respondents are not familiar with the use of the web browser or the alphanumeric entry mode on their phone –  Don t make assumptions about the ability of respondents to fill in questionnaires on their mobile phone •  Many respondents are concerned about data costs –  some have unlimited downloads phone plans –  others have pay-as-you go plans •  Many respondents have low data connection speeds –  minimize the use of images and other media in your questionnaires
  • 14.
  • 15.
    Methodology •  All respondentsare smartphone users. •  All indicate a willingness to complete questionnaires on their smartphone –  Canada | n=500 On Mobile Device –  Canada | n=500 Using traditional (desktop/ laptop) Internet •  Both samples were balanced on gender and age and results were weighted with the same weighting scheme (by gender and age). –  US | n=118 On Mobile Device –  UK | n=107 On Mobile Device •  Incidence of smartphone users willing to complete questionnaire on smartphone was too low in US/ UK.
  • 16.
    Traditional online experiencevs. mobile device experience
  • 17.
    Results •  Chose atopical subject: the economy. •  The data revealed remarkable similarities. •  The single choice questions on the Canadian economy and personal finances were almost identical. •  The multi-choice responses were also very similar with no statistically significant differences.
  • 18.
    Current Economic Conditions Poor Good 48% CDN Online (n=500) 49% 46% CDN Mobile (n=500) 51% 80% US (n=118) 20% 80% UK (n=107) 20% Base: All respondents M1. How would you rate the current economic conditions in ….today?
  • 19.
    State of PersonalFinances Poor Good 31% CDN Online (n=500) 68% 32% CDN Mobile (n=500) 67% 46% US (n=118) 54% 56% UK (n=107) 42% Base: All respondents M2. How would you rate the state of your own personal finances today?
  • 20.
    Measures Taken CDN Online CDN Mobile US UK (n=500) (n=500) (n=118) (n=107) Cut my spending 62% 60% 72% 70% Paid down debt 41% 41% 43% 21% Taken on another job 9% 8% 14% 9% Refinanced my mortgage 9% 8% 10% 5% Tapped into my retirement funds 8% 7% 10% 7% to help make ends meet Sold investments 7% 7% 9% 6% None of the above 23% 22% 13% 18% Base: All respondents M3. Which of the following measures have you taken, if any, to deal with the current economic situation in your country?
  • 21.
    Likelihood to Participatein Future Surveys More Likely CDN Mobile (n=500) 38% US (n=118) 66% UK (n=107) 53% Base: All respondents M13. If I had the option of completing surveys via my phone, I would be …
  • 22.
    Likelihood to Participatein Future Surveys More Likely BlackBerry (n=294) 34% iPhone (n=167) 47% Other (n=39) 23% Base: All respondents M13. If I had the option of completing surveys via my phone, I would be …
  • 23.
  • 24.
    Back-end mobile researchbest practices •  Minimize the survey skin to maximize the screen size/ space •  Profile your panel for Smartphones •  Brand and model of device •  Business or personal phone •  Email address for Smartphone •  Interest/willingness to do surveys via phone •  Identify devices and models supported in your data collection software –  Major brands are BlackBerry, iPhone, Nokia, Motorola, Samsung –  But there are many more and many models •  Manage deployment process –  Process for occasions when email address for mobile surveys is different from main panel email address
  • 25.
    Mobile questionnaire designbest practices 1.  Design the questionnaire based on the question types supported (single choice, multi-choice, open ends)
  • 26.
    Mobile questionnaire designbest practices 2.  Design the questionnaire differently (shorter, more concise). Have less text in the questions and answer categories.
  • 27.
    Mobile questionnaire designbest practices 3.  Limit survey length to 15 questions (although in theory higher incentives can be used for longer surveys). 4.  Keep it simple: –  use only single-choice, multi-choice and verbatim questions –  use alternatives for other/specify –  avoid the use of color –  don t use grids –  don t use images