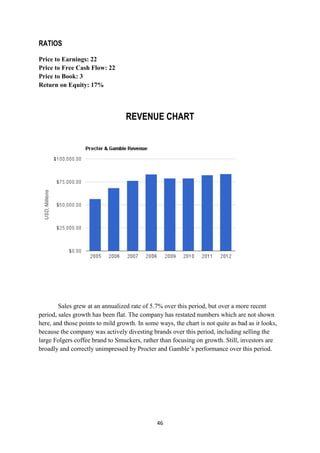
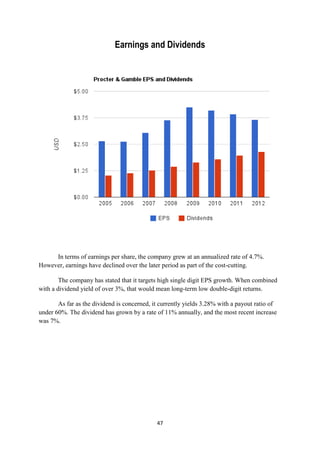
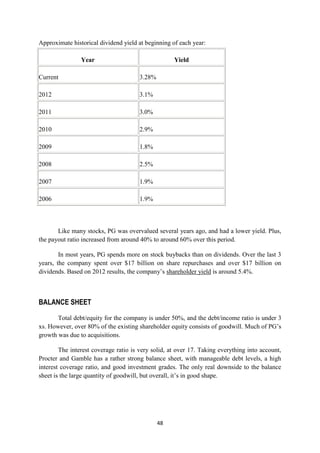
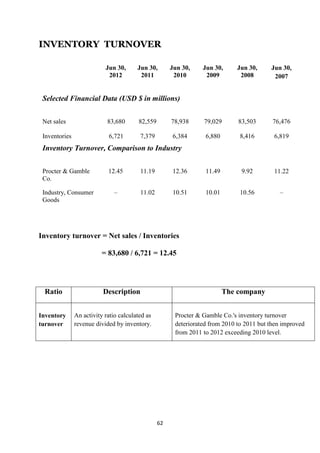
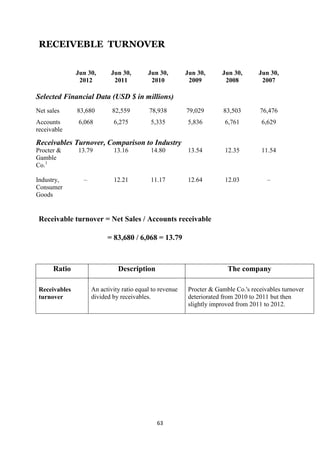
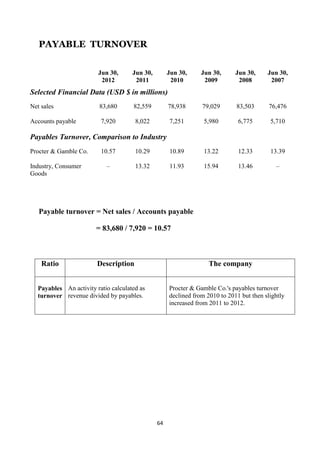
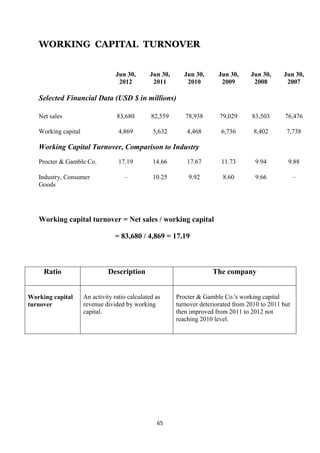
This document discusses a dissertation submitted by five students to Seethalakshmi Ramaswami College in partial fulfillment of the requirements for the award of the degree of Master of Commerce in Corporate Finance. The dissertation focuses on analyzing the growth and expansion of Fast Moving Consumer Goods (FMCG) sector in India with special reference to Procter & Gamble. It includes chapters on the company profile of P&G, an analysis of P&G on various parameters, sustainability practices of P&G, and recommendations.
Marketing Management of P&G India by AKSHAY GAUTAMAkshay Gautam
I have made this ppt for my marketing management project. Do share it only for reference. Show some hard work and make one(better than this) on your own. Good Luck!!!
A PPT on Godrej Family talking about the inception of the company and it's progress ever since then. This PPT also comprises it's SWOT analysis along with Porter's Five Forces Model
The presentation contains Marketing Strategies of Hindustan Lever Limited(HUL) which helped it in becoming India's number 1 in FMCG. It is made as an assignment report in first semester of MBA.
In this project i have done a business analysis of India's well renowned company naming Dabur. now first of all i have given basic info, of company then applied PESTEL analysis, life cycle analysis of one product, marketing mix strategy, company's KPI and CSF, porter five forces and finally conclusion.
February 2020 Entrepreneur India Monthly Magazine
Entrepreneur India, a monthly magazine published by NPCS, is aimed at simplifying the process of choosing the suitable project for investment. It makes business decisions easier and trouble-free by providing a list of right projects for investment. Unique among project investment magazines, ‘Entrepreneur India’ is dedicated to the business of identifying sound investment projects. Every issue consists of a new list of projects which are meticulously selected by the NPCS team after being screened on various investment factors. NPCS team, before labeling a project as ‘Right investment’
Studies various aspects of investment like product demand, market potential, raw material availability, suitable location, payback period, costs involved and breakeven point.
The importance of project identification is known to less and many a times, entrepreneurs spend substantial time and resources on project planning, execution and control, while little attention is paid to project assessment and selection. Such times lead to disastrous business decisions and often a project is declared a ‘dead investment’. Most entrepreneurs, these days, have the capital but not the expertise to shortlist a suitable project to park their money. And ‘Entrepreneur India’ helps remove such hurdles for a businessman to ensure successful ventures and expansions.
See more
https://www.entrepreneurindia.co/entrepreneur
New Enterprise Setup Project Profiles for Micro & Small Enterprises Ajjay Kumar Gupta
New Enterprise Setup Project Profiles for Micro & Small Enterprises (NPCS Newsletter Issues - 032017)
The only way to determine if your ideas can potentially be profitable as a business and is worth pursuing further is to conduct feasibility studies. The purpose each entrepreneur should conduct a detailed feasibility assessment or study is to test if that business idea makes: Personal Sense, Business Sense, Market Sense, and Financial Sense. Without looking at the personal aspect, business concept, the market, and the financials, as well as analyzing the data and information, an entrepreneur is likely not to be successful or not as successful as s/he would like to be. A business plan is an essential roadmap for business success. A business plan provides direction, keeps you on track and is usually a requirement when you seek finance. A business plan is a formal grid map of all of your business goals, and plans on how to achieve them. Entrepreneurial skills assist Small scale industries generate growth and development of new ventures in developing economies. At the entrepreneurship development level, a key role of the programme is to develop tools and programmes that deal with the long term effects of entrepreneurial culture.
NIIR PROJECT CONSULTANCY SERVICES
AN ISO 9001 : 2008 CERTIFIED COMPANY
106-E, Kamla Nagar, Near Spark Mall,
Delhi – 110 007 (India)
Tel: 91-11-23843955, 23845886, 23845654, +918800733955
Mobile: +919811043595
Fax: 91-11-23845886
E-mail: npcs.india@gmail.com; info@niir.org
Website: www.niir.org
www.entrepreneurindia.co
Tags
a.a.c. blocks from silica sand & lime stone powder, bottling of country liquor (automatic plant, corrugated cardboard boxes, cotton seed delinting/crushing and refining, dairy farming & dairy products (pasteurised milk &, e-waste recycling plant, engineering college (aeronautical), hollow glassware, instant noodles, lemon and oranges, manufacturing unit with printing, pan masala, paracetamol, pcc electric poles, pectin from citrus, precipitated silica from rice husk ash, super speciality hospital, tundish insulated powder (radex), warehouse, wood plastic composite (wpc), Industrial Project Report, Project consultant, Project consultancy, NPCS, Niir, Process technology books, Business consultancy, Business consultant, Project identification and selection, Preparation of Project Profiles, Startup, Business guidance, Business guidance to clients, Startup Project, Startup ideas, Project for startups, Startup project plan, Business start-up, Business Plan for a Startup Business, Great Opportunity for Startup, Small Start-up Business Project, Project report for bank loan, Project report for bank finance, Project report format for bank loan in excel, Excel Format of Project Report and CMA Data, Project Report Bank Loan Excel
1. GROWTH AND EXPANSION OF FMCG WITH SPECIAL REFERENCE TO
PROCTOR AND GAMBLE
Dissertation submitted to
SEETHALAKSHMI RAMASWAMI COLLEGE
(AUTONOMOUS AND ACCREDITED BY NAAC)
Affiliated to BHARATHIDASAN UNIVERSITY in partial
Fulfilment of the requirements for the
Award of the degree of
MASTER OF COMMERCE
(CORPORATE FINANCE)
Submitted by
K.KASTHURI 12 PCO 007
B.NIVEDHA 12 PCO 013
M.NIVEDHA 12 PCO 014
K.SUDHA 12 PCO 017
R.SURYA 12 PCO 018
Under the guidance of
DR.R.LALITHA, M.Com.,M.Phil.,PGDCA.,Ph.D.,M.A(YHE)
DR.R.VIJAYALAKSHMI, M.Com.,M.Phil.,Ph.D
DEPARTMENT OF COMMERCE
SEETHALAKSHMI RAMASWAMI COLLEGE
(AUTONOMOUS AND ACCREDITED BY NAAC)
TIRUCHIRAPALLI-620 002
MARCH 2013
1
3. ACKNOWLEDGEMENT
We express our deep sense of gratitude and sincere thanks to all who
motivated us in various ways in the preparation of this project.
It is our honour to convey our heartfelt thanks to SEETHALAKSHMI
RAMASWAMI COLLEGE (AUTONOMOUS) for having introduced project work
in the syllabus which helped to acquire wide experience and knowledge. We express
our grateful thanks to
DR.(MS) KANAKA BHASHYAM, M.A., M.Phil., PGDJ., Ph.D., the
principal of Seethalakshmi Ramaswami College (Autonomous).
We take this opportunity to express our gratitude to MRS. M.GUNAVATHI,
M.Com., M.Phil., DLL., Ph.D., Head of the Department of Commerce for having
encouraged us to complete this project successfully.
We wish to acknowledge our indebtedness and deep sense of gratitude to
DR.R.LALITHA,M.Com.,M.Phil.,PGDCA.,Ph.D.,M.A(YHE) and
DR.R.VIJAYALAKSHMI, M.Com.,M.Phil.,Ph.D for her valuable guidance &
suggestions at each and every step of this dissertation’s.
We extend our thanks to our parents, friends and all the teaching faculties for
their co-operation and support.
We could be failing our duty if we do not thank GOD, the ALMIGHTY who is
the author of all our inspiration and enthusiasm to complete our study successfully.
3
5. CONTENT
CHAPTER PARTICULARS PAGE NO.
I. INTRODUCTION 6
II. COMPANY PROFILE 17
III. ANALYSIS OF P& G ON 35
VARIOUS HEADS
IV. SUSTAINABILITY 96
V. RECOMMENDATION AND 102
SUGGESTION
5
7. Meaning of FMCG
FMCG stands for Fast Moving Consumer Goods. It is also referred to on occasion
as CPG, an abbreviation of Consumer Packaged Goods.
They are described as being reasonably low cost items that are supplied and sold in a
very short time period - often these types of products have a short shelf life, hence having a
short sale time. FMCG's are often bought in bulk to take advantages of economies of scale -
due to their low price, profit margins are often small so the sale of large quantities over a
short period of time is vital to make worthwhile.
FMCG's can be split into highly perishable and non-highly perishable goods. Highly
perishable goods include meats, vegetables, fruit, and bakery items - anything that has a
reasonably short shelf life. In contrast, products such as wine, beer and spirits, canned foods
and toiletries have a longer shelf life and do not perish quickly. Nonetheless, these products
are in high demand and as a result product turnover is high; they do not spend long on the
supermarket shelves.
Fast Moving Consumer Goods are recognised as being a frequent consumer purchase,
and what that involves a low level of risk and/or emotion.
Characteristics of FMCGs:
From the consumers' perspective:
Frequent purchase
Low involvement (little or no effort to choose the item – products with strong brand
loyalty are exceptions to this rule)
Low price
From the marketers' angle:
High volumes
Low contribution margins
Extensive distribution networks
High stock turnover
7
8. FMCG CATEGORY AND PRODUCTS
Category Products
Household care Fabric wash (laundry soaps and synthetic
detergents); household cleaners (dish/utensil
cleaners, floor cleaners, toilet cleaners,
air fresheners, insecticides and mosquito repellents,
metal polish and furniture polish
Food and health beverages Soft drinks; staples/cereals; Beverages bakery
products (biscuits, bread, cakes);food; chocolates;
ice cream; tea; coffee; soft drinks; processed fruits,
vegetables; dairy products; bottled water; branded
flour; branded rice; branded sugar; juices etc.
Personal care Oral care, hair care, skin care, personal wash(soaps);
cosmetics and toiletries; deodorants; Perfumes;
feminine hygiene;
8
9. SWOT analysis of FMCG
Strengths:
Low operational costs
Presence of established distribution networks in both urban and rural areas
Presence of well-known brands in FMCG sector
Weaknesses:
• Lower scope of investing in technology and achieving economies of scale, especially
in small sectors
• Low exports levels
• "Me-tooʺ products, which illegally mimic the labels of the established brands. These
products narrow the scope of FMCG products in rural and semi-urban market.
Opportunities:
• Untapped rural market
• Rising income levels, i.e. increase in purchasing power of consumers
• Large domestic market- a population of over one billion.
• Export potential
• High consumer goods spending
Threats:
• Removal of import restrictions resulting in replacing of domestic brands
• Slowdown in rural demand
• Tax and regulatory structure
9
10. TOP 10 FMCG COMPANIES IN INDIA
FMCG (Fast Moving Consumer Goods) or Consumer Packaged Goods
(CPG) – are products that are sold quickly and at relatively low cost. Below is a List
of Top 10 FMCG Companies in India 2012.
1. ITC (Indian Tobacco Company)
Market Capitalization –
(Rs. Crore): 151,078
It presence in FMCG, Hotels,
Paper boards & Specialty Papers,
Packaging, Agri-Business, and
Information Technology.ITC Ltd,
traditional businesses of Cigarettes,
Hotels, Paperboard‘s, Packaging and
Agri-Exports.
10
11. 2. HINDUSTAN UNILEVER
Market Capitalization –
(Rs. Crore): 67,858
India’s largest consumer
products with products such
as soaps, tea, detergents and
shampoos with over 700 million
Indian are using its products.
3. NESTLE INDIA
Market Capitalization – (Rs.
Crore): 39,819
A subsidiary of Nestlé S.A. of
Switzerland. A largest food and
beverage manufacturer in the world
with many popular and largest selling
products such as MAGGI, NESCAFE,
KITKAT and MILKMAID.
4. DABUR INDIA
Market Capitalization – (Rs.
Crore): 18,632
They has 17 ultra modern
manufacturing units around the globe and its
products marketed in over 60 countries.
11
12. 5. GODREJ CONSUMER PRODUCTS
Market Capitalization –
(Rs.Crore): 13,335
A Household, hair colors, household
insecticides and Personal Care Products.
6. P&G (Proctor and Gamble India)
Market Capitalization – (Rs. Crore): 12,838
Acquisition by Gillette.
12
13. 7. COLGATE-PALMOLIVE
Market Capitalization –
(Rs.Crore): 12,764
The leading Tooth Paste Brand in
India.
8. GSK (Glaxosmithkline Consumer Healthcare)
Market Capitalization -
(Rs.Crore): 9,842
A pharmaceutical
industry and over 100,000 employees
Worldwide.
13
14. 9. MARICO
Market Capitalization - (Rs.Crore): 9,078
And the company present in more than 25
countries across Asia and the African continent.
10. EMAMI
Market Capitalization - (Rs.Crore): 6,836
And over 20,000 employees. Products
are paper , writing instruments, edible oil and
cultivation, bio-diesel, hospitals, contemporary
art, pharmacy, cement, real estate and retail.
14
15. BENEFITS OF FMCG COMPANIES
Cumulative Profits
For a retailer's bottom line, the key benefit of CPGs/FMCGs is the cumulative profit
they provide. CPGs/FMCGs have a low profit margin, which means that a small percentage
of each each unit sale represents profit. However, CPGs/FMCGs also sell in very high
quantities. This means that those small profits add up and can form a significant portion of a
retailer's total profits for a fiscal period. This profit serves any number of financial purposes
in the business.
Cross Merchandising Opportunities
Retailers thrive when customers buy multiple items on each visit. CPGs/FMCGs
provide opportunities for cross merchandising, which occurs when a business places two
products from different categories close to one another in a strategic arrangement. For
example, an electronics retailer may sell remote controls that have high profit margins but
don't fall into the CPG/FMCG category. A shelf of batteries (which are CPGs/FMCGs) next
to those remotes provides a chance to boost sales and earn profit on two items when
customers choose to buy the batteries they will need to operate their new remotes at the same
time.
Brand Appeal
When a retailer offers CPGs/FMCGs, it can rely on the brand appeal that they
generate to drive sales. Most CPGs/FMCGs come from brands that advertise heavily. This
means that when customers see CPGs/FMCGs on store shelves they have pre-existing
emotional relationships with those brands, which may not be true of the other items that the
retailer sells. Seeing recognizable brands may build trust between the customer and retailer or
lead to an additional purchase based on brand awareness, with no special effort from the
retailer.
Diversification
Selling CPGs/FMCGs spreads a retailer's revenue sources over a broader spectrum of
goods. The profits can help offset slow sales for other products during seasonal dips in
demand or periods of reduced consumer confidence. In the category of CPGs/FMCGs,
retailers can choose from among an almost unlimited range of product types including
pharmaceuticals, food items, beverages, household products and disposable items. The range
is so broad that some retailers, such as grocery stores and convenience markets, stay in
business selling them exclusively.
15
16. Characteristics of FMCG in India
Branding: Creating strong brands is important for FMCG companies and they
devote considerable money and effort in developing bands. With differentiation on
functional attributes being difficult to achieve in this competitive market, branding
results in consumer loyalty and sales growth.
Distribution Network: Given the fragmented nature of the Indian retailing
industry and the problems of infrastructure, FMCG companies need to develop
extensive distribution networks to achieve a high level of penetration in both the
urban and rural markets. Once they are able to create a strong distribution network, it
gives them significant advantages over their competitors.
Contract Manufacturing: As FMCG companies concentrate on brand building,
product development and creating distribution networks, they are at the same time
outsourcing their production requirements to third party manufacturers. Moreover,
with several items reserved for the small scale industry and with these SSI units
enjoying tax incentives, the contract manufacturing route has grown in importance
and popularity.
Large Unorganized Sector : The unorganised sector has a presence in most
product categories of the FMCG sector. Small companies from this sector have used
their locational advantages and regional presence to reach out to remote areas where
large consumer products have only limited presence. Their low cost structure also
gives them an advantage.
16
18. COMPANY PROFILE
Neither William Procter nor James Gamble ever intended to settle in Cincinnati.
Although the city was a busy center of commerce and industry in the early nineteenth century,
William, emigrating from England, and James, arriving from Ireland, were headed farther
west.
Despite their intentions, however, both men ended their travels when they arrived at
the Queen City of the West – William, to care for his ailing wife Martha, who soon died, and
James, to seek medical attention for himself.
William Procter quickly established himself as a candle maker. James Gamble
apprenticed himself to a soap maker. The two might never have met had they not married
sisters, Olivia and Elizabeth Norris, whose father convinced his new sons-in-law to become
business partners. In 1837, as a result of Alexander Norris‘ suggestion, a bold new enterprise
was born: Procter & Gamble.
1837 — 1890
The Partnership Years.1837 was a difficult time to start a business. Although
Cincinnati was a bustling marketplace, the U.S. was gripped by financial panic. Hundreds of
banks were closing across the country. There was widespread concern that the United States
was bankrupt. Yet, William and James launched their new enterprise, more concerned about
how to compete with the 14 other soap and candle makers in their city than with the financial
panic shaking their country.
Their calm in the midst of that economic storm reflected their forward-looking
approach to the business – an approach that became the hallmark of Procter & Gamble. In
the 1850s, for example, despite rumours of an impending civil war in the U.S., they built a
new plant to sustain their growing business. Later, they pioneered one of the nation‘s first
profit-sharing programs and were amo.ng the first in American industry to invest in a
research laboratory. By 1890, the fledgling partnership between Procter and Gamble had
grown into a multi-million dollar corporation. Nevertheless, P&G still had its eyes on the
future.
1837
On April 12, 1837, William Procter and James Gamble start making and selling their
soap and candles. On August 22, they formalize their business relationship by pledging
$3,596.47 apiece. The formal partnership agreement is signed on October 31, 1837.
1850
The Moon and Stars begins to appear in the 1850s as the unofficial trademark of
Procter & Gamble. Wharf hands used the symbol to distinguish boxes of Star Candles. By
the 1860s, the Moon and Stars appears on all Company products and correspondence. Once a
18
19. staple of the Company‘s product line, candles decline in popularity with the invention of the
electric light bulb. The Company discontinues candle manufacturing in the 1920s.
1859-1862
Twenty-two years after the partnership is formed, P&G sales reach $1 million. The
Company now employs 80 people.
During the Civil War, Procter & Gamble is awarded several contracts to supply soap
and candles to the Union armies. These orders keep the factory busy day and night, building
the Company‘s reputation as soldiers return home with their P&G
products.
1879
James Norris Gamble, son of the founder and a trained
chemist, develops an inexpensive white soap equal to high-quality,
imported castiles. Inspiration for the soap‘s name – Ivory – came to
Harley Procter, the founder‘s son, as he read the words ―out of ivory
palaces‖ in the Bible one Sunday in church. The name seems a
perfect match for the white soap‘s purity, mildness and long-lasting
qualities.
1882
Harley Procter convinces the partners to allocate $11,000 to advertise
Ivory nationally for the first time. Ivory‘s purity and floating capability are
first advertised across the country in the Independent, a weekly newspaper.
1890 — 1945
A Company Built on Innovation. By 1890, P&G was selling more than 30 different
types of soap, including Ivory. Fueled by full-color print ads in national magazines,
consumer demand for P&G soaps continued to grow. To meet this increasing demand, the
Company expanded its operations outside Cincinnati, with a plant in Kansas City, Kansas,
followed by a plant in Ontario, Canada. As each new plant opened, P&G would embark on
plans for another.
The research labs were as busy as the plants. Innovative new products rolled out one
after another – Ivory Flakes, a soap in flake form for washing clothes and dishes; Chipso, the
first soap designed for washing machines; Dreft, the first synthetic house-hold detergent; and
Crisco, the first all-vegetable shortening that changed the way consumers cooked. Each of
these new products came from P&G‘s in-depth understanding of consumer needs and
pioneering approach to market research. And they were marketed through equally innovative
techniques, including radio ―soap operas,‖ product sampling and promotional premiums.
19
20. 1890-1896
After running the Company as a partnership for 53 years, the partners
incorporate to raise additional capital for expansion. William Alexander
Procter, son of the founder, is named the first president. P&G sets up an
analytical lab at Ivorydale to study and improve the soap-making process. It is
one of the earliest product research labs in America. King Camp Gillette
invents the first safety razor.
P&G‘s first color print advertisement – an ad for Ivory – appears in
Cosmopolitan magazine picturing this ―Ivory Lady.‖
1901-1917
American Safety Razor Company formed in Boston, Massachusetts, later becoming
the Gillette Co. William Cooper Procter becomes the head of the Company following the
death of his father, William Alexander Procter.
P&G introduces Crisco, the first all-vegetable shortening. Crisco provides a healthier
alternative to cooking with animal fats and is more economical than butter. The Company
builds its first manufacturing facility outside the United States, in Canada. Employing 75
people, the plant produces Ivory soap and Crisco. U.S. Government requests Gillette supply
razors and blades for the entire U.S. Armed Forces during WWI.
1923-1930
Crisco sponsors cooking shows on network radio, placing P&G among the medium‘s
advertising innovators. A market research department is created to study consumer
preferences and buying habits – one of the first such organizations in industry. In response to
the growing popularity of perfumed beauty soaps, P&G introduces Camay. William Cooper
Procter turns the reins of the Company over to Richard R. Deupree.
1931
P&G‘s brand management system begins to take shape in the late 1920s. In 1931,
Neil McElroy, the Company‘s promotion department manager, creates a marketing
organization based on competing brands managed by dedicated groups of people. The
system provides more specialized marketing strategies for each brand and Procter &
Gamble‘s brand management system is born.
1933-1939
Dreft, the first synthetic detergent developed for household use, is introduced. The
discovery of detergent technology lays the groundwork for a revolution in cleaning
technology. `William Cooper Procter dies and a monument is erected at Ivorydale in his
honor. He is the last member of the founding families to run the Company.
20
21. The Company expands its international presenc with the acquisition of the Philippine
Manufacturing Company – the Company‘s first operations in the Far East. P&G celebrates
its 100th anniversary. Sales reach $230 million. Just five months after the introduction of
television in the U.S., P&G airs its first TV commercial (for Ivory Soap) during the first
televised major league baseball game.
1943-1946
The Company creates its first division – the Drug Products Division – to sell its
growing line of toilet goods. Tide, ―the washing miracle,‖ is introduced. Tide incorporates a
new formula that cleans better than anything currently on the market. Its superior
performance at a reasonable price makes Tide the country‘s leading laundry product by
1950.
1947 — 1952
P&G‘s detergent technology leads to the development of a wide range of products
such as granulated and liquid detergents, shampoos, toothpastes and household cleaning
products that provide growth opportunities in the 1950s and beyond. Neil H. McElroy
assumes leadership of P&G. P&G establishes an Overseas Division to manage the
Company‘s growing international business
1950-1955
The first subsidiary on the South American continent is established in Venezuela. A
new research facility, Miami Valley Laboratories, opens in Cincinnati. MVL is the
Company‘s first facility dedicated solely to upstream research
The Company begins operations in continental Europe by leasing a small plant in
Marseilles, France, from the Fournier-Ferrier Company, a detergent manufacturer. Crest, the
first toothpaste with fluoride clinically proven to fight cavities, is introduced. P&G
announces plans to form individual operating divisions to better manage its growing lines of
products. This divisionalization also creates separate line and staff organizations.
1956
The new General Office building opens, signifying P&G‘s continuing commitment to
downtown Cincinnati. P&G announces plans to form individual operating divisions to better
manage its growing lines of products. This divisionalization also creates separate line and
staff organizations. The new General Office building opens, signifying P&G‘s continuing
commitment to downtown Cincinnati
1957
P&G enters the consumer paper products business with the acquisition of Charmin
Paper Mills, a regional manufacturer of toilet tissue, towels and napkins. Howard J. Morgens
21
22. takes over Company leadership when Neil McElroy leaves to serve as the U.S. Secretary of
Defense.
1960
Crest sales skyrocket when The American Dental Association recognizes the
toothpaste as ―an effective decay-preventive dentifrice.‖ P&G GmbH opens its first office in
Frankfurt, Germany, with 15 employees. Three years later, Germany‘s first plant in Worms
begins production of Fairy cleaning powder and Dash laundry detergent.
1961
Although Pampers‘ first test market in Peoria, Illinois, is
unsuccessful, it leads to an improved Pampers product at a lower cost that
eventually replaces cloth diapers as the preferred way to diaper babies.
1963-1968
P&G enters the coffee business with the acquisition of Folger‘s
Coffee. The first paper plant built by P&G opens in Mehoopany, Pennsylvania. Pringle‘s,
with its unique stackable shape and resealable can, is introduced into test market.
1972-1973
Bounce combines softening agents with a nonwoven sheet to soften clothes in the
dryer. It quickly becomes the second largest selling fabric softener after Downy.
The Company begins manufacturing and selling P&G products in Japan through the
acquisition of The Nippon Sunhome Company. The new company is called Procter &
Gamble Sunhome Co. Ltd.
1974-1981
Ed Harness is elected to head. Didronel is introduced. A treatment for Paget‘s disease,
it is one of the Company‘s first pharmaceutical products the Company. Sales reach $10
billion. John G. Smale becomes head of Procter & Gamble.
1982-1984
P&G increases its prescription and over-the-counter health care business with the
acquisition of Norwich Eaton Pharmaceuticals. The Company introduces a superior feminine
protection product, Always/Whisper, which becomes the leading world brand in its category
by 1985. Gillette acquires Oral B, founded in 1950. Liquid Tide is introduced. This represents
the results of global research with surfactants developed in Japan, fragrance in Europe and
packaging from the United States.
22
23. 1985
The Company significantly expands its over-the-counter and personal health care
business worldwide with the acquisition of Richardson- Vicks, owners of Vicks respiratory
care and Oil of Olay product lines. P&G opens the General Offices Tower building, the
expansion of Procter & Gamble‘s world headquarters in Cincinnati, Ohio.
1986
Ultra Pampers and Luvs Super Baby Pants are introduced – with
effective, new technology that makes diapers thinner. P&G creates the
industry‘s first multi-functional customer teams. The Company develops
a new technology that enables consumers to wash and condition their
hair using only one product. Pert Plus/Rejoice shampoo quickly
becomes one of the leading worldwide shampoo brands.
1987
P&G celebrates its 150th anniversary. The Company increases its presence in the
European personal care category, with the acquisition of the Blendax line of products,
including Blend-a-med and Blendax toothpastes. P&G announces several major organization
changes with the creation of category management and a product supply system which
integrates purchasing, manufacturing, engineering and distribution.
1988-1989
The Company announces a joint venture to manufacture products in China. This is the
Company‘s first operation in the largest consumer market in the world. Refill packs are
introduced in Germany for liquid products like Lenor fabric softener. Germany‘s retail
grocers name Lenor‘s refill pouch the invention of the year.
The Company enters the cosmetics and fragrances category with the acquisition of
Noxell and its Cover Girl and Noxzema products.
1990
Edwin L. Artzt is named to lead the Company. The Company expands its presence in
the male personal care market with the acquisition of Shulton‘s Old Spice product line. Most
of the laundry detergent brands are reformulated to incorporate P&G‘s compact technology.
Introduced in Japan with the Cheer and Ariel brands, the technology is expanded to 36 brands
in 20 different countries during the year.
23
24. 1991
The acquisitions of Max Factor and Betrix increase the Company‘s worldwide
presence in the cosmetics and fragrances category. P&G opens its first operation in Eastern
Europe with the acquisition of Rakona in Czechoslovakia. New businesses in other Eastern
European countries – Hungary, Poland and Russia – follow throughout the year.
1992
P&G receives the World Environment Center
Gold Medal for International Corporate
Environmental Achievement. Pantene Pro-V is
introduced. Originally a small part of the 1985
Richardson-Vicks acquisition, Pantene becomes the
fastest growing shampoo in the world.
1993
Company sales exceed $30 billion. For the
first time in Company history, more than 50% of sales come from outside the U.S. The Japan
Headquarters and Technical Center opens on Rokko Island in Kobe City, Japan. The complex
consolidates headquarters and product development operations.
1994-1995
P&G enters the European tissue and towel market with the acquisition of the German-
based company, VP Schickedanz. John E. Pepper becomes P&G‘s ninth Chairman and Chief
Executive, and Durk I. Jager becomes President and Chief Operating Officer.
1996
The U.S. Food and Drug Administration grants approval of Olestra for use in salty
snacks and crackers. Olestra, marketed under the brand name Olean, is a calorie-free fat
replacer that provides the full taste of fat without the added fat calories. The Company
continues to expand its global reach with acquisitions of the U.S. baby wipes brand Baby
Fresh – complementing the Company‘s global diaper business and its strong European
Pampers Baby Wipes business
1996-1998
Gillette acquires Duracell, originally founded in the early 1920s. The Company
expands its feminine protection expertise into a new global market with the acquisition of
Tambrands. Tampax Tampon is the market leader worldwide.
24
25. P&G announces Organization 2005, a new global organizational design to drive
innovative ideas to world markets faster. Mach 3 razor is introduced. P&G provides a
foundation for future growth by investing in new breakthrough products. Febreze, Dryel and
Swiffer are introduced and sold around the world in less than 18 months.
1999-2002
Durk Jager becomes Chairman of the Board and Chief Executive. A.G. Lafley
becomes President and Chief Executive. Reflect.com, P&G‘s initial Internet brand, is
launched. It is the first to offer truly customized beauty care products online.
Crest WhiteStrips launches in the U.S. P&G acquires the Clairol business from
Bristol-Myers Squibb Co. Clairol is a world leader in hair color and hair care products. A.G.
Lafley is elected Chairman of the Board. Bruce Byrnes and R. Kerry Clark are elected Vice-
Chairman of the Board.
2003-2004
FDA approves switching Prilosec, a treatment for frequent heartburn, from a
prescription to an over-thecounter (OTC) product. P&G‗s Children's Safe Drinking Water
Program wins the World Business Award from the United Nations Development Program &
International Chamber of Commerce in support of the UN‗s Millenium Development goals.
Actonel becomes a billion dollar brand, and P&G's first pharmaceutical brand to reach this
important milestone.
2005
P&G and Gillette merge into one company and add five more billion dollar brands to
our product portfolio, including Gillette and Braun‗s shaving and grooming products, the
Oral-B dental care line and Duracell batteries.
25
26. Purpose, Values & Principles
Foundation
P&G Purpose, Values and Principles are the foundation for P&G‘s unique culture.
Throughout the history of over 170 years, P&G has grown and changed while these elements
have endured, and will continue to be passed down to generations of P&G people to come.
P&G Purpose unifies us in a common cause and growth strategy of improving more
consumers‘ lives in small but meaningful ways each day. It inspires P&G people to make a
positive contribution every day.
P&G Values reflect the behaviours that shape the tone of how they work with each
other and with their partners.
PURPOSE
P&G brands and P&G people are the foundation of P&G‘s success.
P&G people bring the values to life as they focus on improving, the lives of the world‘s
consumers.
26
27. VALUES
Integrity
They are honest and straightforward with each other.
They operate within the letter and spirit of the law.
They uphold the values and principles of P&G in every action and decision.
They are data-based and intellectually honest in advocating proposals, including, recognizing
risks.
Leadership
Everyone should have responsibility in their area, with a deep commitment to delivering
leadership results.
They have a clear vision of where they going.
They focus their resources to achieve leadership objectives and strategies.
They develop the capability to deliver the company strategies and eliminate organizational
barriers.
Ownership
The company accept personal accountability to meet their business needs, improve their
systems and it will improve their effectiveness.
Each one act like owners, treating the Company‘s assets as their own and behaving with the
Company‘s long-term success in mind.
Passion for Winning
They are determined to be the best at doing what matters most.
27
28. They have a healthy dissatisfaction with the status quo.
They have a compelling desire to improve and to win in the marketplace.
Ownership
P&G colleagues, customers and consumers, and treat them as they want to be treated.
They have confidence in each other‘s capabilities and intentions.
They believe that people work best when there is a foundation of trust.
PRINCIPLES
P&G Show Respect for All Individuals
They believe that all individuals can and want to contribute to their fullest potential.
They inspire and enable people to achieve high expectations, standards and challenging goals.
They are honest with people about their performance.
The Interests of the Company and the Individual Are Inseparable
They believe that doing what is right for the business with integrity will lead to mutual
success for both the Company and the individual. their quest for mutual success ties us
together.
They encourage stock ownership and ownership behaviour.
P&G Strategically Focused in Their Work
They operate against clearly articulated and aligned objectives and strategies.
They usually do work and ask for work that adds value to the business.
They simplify, standardize and streamline our current work whenever possible.
28
29. Innovation Is the Cornerstone of P&G Success
They place great value on big, new consumer innovations.
Challenge convention and reinvent the way we do business to better win in the marketplace.
Value Personal Mastery
They believe it is the responsibility of all individuals to continually develop themselves and
others.
They encourage and expect outstanding technical mastery and executional excellence.
P&G Seek to Be the Best
They strive to be the best in all areas of strategic importance to the Company.
Their performance are rigorously versus the very best internally and externally.
They learn from both of their successes and failures.
P&G Are Externally Focused
They develop superior understanding of consumers and their needs.
They create and deliver products, packaging and concepts that build winning brand equities.
They develop close, mutually productive relationships with their customers and their
suppliers.
They incorporate sustainability into products, packaging and operations.
Mutual Interdependency Is a Way of Life
It work together with confidence and trust across business units, functions, categories and
geographies.
They take pride in results from reapplying others‘ ideas.
29
31. Ambi Pur
Though we strive hard to keep our
homes and our cars clean and tidy, the
results are rarely satisfactory. Odours that
linger in our homes just before guests arrive,
or a persistent stench that never leaves the
car, not only adversely affect our mood, but
also that of our guests. With this in mind,
P&G experts have bottled the fragrance of
freshness with the new Ambi Pur range for
both homes and cars.
Ariel
Introduced in 1991, Ariel was the first to
bring the 'compact detergent' technology, the
enzyme technology for safe and superior stain-
removing power and the 'smart eyes' technology
into India, with an aim of becoming India's best
stain removal detergent. Ariel contains safe
ingredients for all fabrics under recommended
usage conditions for laundry. The Ariel product
range in India includes different variants to meet your specific needs like Ariel
OxyBlu, Ariel Oxyblu Ultramatic, Ariel Front O Mat, Ariel 2in1.
Duracell
Duracell batteries have a history of providing dependable power when
and where you need it the most. Our
range of Batteries gives you the right
power for all your device needs,
providing up to 10x performance. The
product range in India includes Duracell
and Duracell Ultra. Duracell is available
in sizes AAA, AA, C, D, and 9-volt while
Duracell Ultra is available in sizes AA
and AAA sizes.
31
32. Gillette
Gillette® has been at the heart of men‘s grooming for over 100 years. Each day, more
than 600 million men around the world trust their
faces and skin to Gillette‘s innovative razors and
shaving products designed for the unique needs
of men – helping them to look, feel and be their
best every day. The razor range in India includes
Gillette Vector, Gillette Mach3, Gillette Mach3
Turbo, Gillette Guard and Gillette Mach3 Turbo
Sensitive and Gillette Fusion. The Shave Care
range includes Gillette Fusion HydraGel, Gillette Series Sensitive Skin Foam, Gillette Series
After Shave & Gillette Classic Shave Foam Sensitive Skin.
The Gillette Skincare regimen is a no-fuss and efficient solution in caring for the
health and appearance of men‘s skin and includes a special range of designed-for-men
Gillette Skincare Foaming Wash, Gillette Skincare Scrub, Gillette Skincare Facial
Moisturizer with Aloe Vera, Gillette Skincare Facial Moisturizer with SPF and Gillette
Skincare Lotion 100ml.
Head & Shoulders
Since 1950, Head & Shoulders has been at the forefront of scalp and hair science,
significantly advancing the treatment of dandruff and scalp problems. Along with
professional advice and expert insight we have a
wide range of products to care for your scalp
and nurture your hair.
Head & Shoulders is available in 8
variants in India including Men Hair Retain,
Complete Care for Dry Scalp, Anti Hair fall,
Smooth & Silky, Cool Menthol, Clean &
Balanced, Thick & Long & Silky Black.
Olay
Olay is a product truly born in love created by Graham
Wulff for his wife Dinah in 1950s to address her frustration
with the then thick and waxy beauty creams. Today, Olay is
one of the most recognizable brands in the world. Yet through
all the changes and innovations, the philosophy upheld by
Graham Wulff remains just as relevant as ever: Help women
look and feel beautiful and Challenge what‘s possible with their skin.
32
33. Oral-B
Oral-B continuously strives to work closely with the dental professionals and deliver
high quality products, which make us leaders* in the $ 4.5 billion toothbrush category,
marketing toothbrushes for children & adults, as
well as inter-dental products such as Dental
Floss. In India, Oral-B has an innovative range
of toothbrushes including Cross Action Pro-
health 7 Benefits, Cross Action Pro-health
Superior Clean and Advantage Sensitive
toothbrush. Oral-B‘S floss range includes Ultra Floss & Essential Floss.
Pampers
As a result of constant research and innovation in understanding the needs of babies at
various stages of development, Pampers Active
Baby has been voted as the best diaper by Indian
moms with the guarantee of superior dryness for an
uninterrupted sleep of 12 hours. Pampers has an
answer for all your needs with its innovative
product range that includes Pampers, Pampers
Active Baby, Pampers Active Baby Pants, all
designed especially for providing a night of Golden
Sleep for the baby.
Pantene
The New Pantene Amino Pro-V Complex range of shampoo & conditioner comes in
three variants suited for individual needs - Pantene Nourished Shine, Pantene Hair Fall
Control & Pantene Smooth & Silky. Enriched with the
goodness of pro-vitamins and three essential aminos,
Pantene restores your hair with its lost beauty while
making your hair ten times stronger.
33
34. Tide
Tide is the World‘s Oldest & Most Trusted Detergent brand and is the Market Leader
in 23 Countries around the world. Launched in India in
mid-2000, Tide provides ‗Outstanding Whiteness‘ on white
clothes & excellent cleaning on coloured clothes as well.
Tide‘s Fabric Whitening Agents clean clothes without
bleaching or removing colour from a garment. The Tide
range in India includes Tide (Detergent) and Tide (Bar with
Whiteons). Tide Naturals was launched in India in
December 2009. Packed with the benefits of lemon and
chandan, it provides great cleaning while keeping the
hands soft.
Vicks
Vicks has long been invested in the science and research of
respiratory health and through that dedication has developed a wide
range of therapeutic products that offer effective relief for all the
major signs and symptoms of the common cold, flu and sinus pain
and pressure. The Vicks product range in India includes Vicks Cough
drops, Vicks Vaporub, Vicks Inhaler, Vicks Vapocool, and Vicks
Action 500 Extra.
Whisper
Whisper understands that we're each very different, and offers a wide range of
sanitary napkins to suit every girl or woman's needs. With the right menstrual pad, you could
take the first step to having a Happy Period. Whisper has a wide range of products in India
which includes Whisper Ultra Regular Wings, Whisper
Ultra XL Wings, Whisper Ultra Heavy Flow
Overnights Wings, Whisper Maxi Regular, Whisper
Maxi XL Wings, Whisper Choice Regular, Whisper
Choice Wings and Whisper Choice Ultra Wings.
34
38. PROCTER & GAMBLE SWOT ANALYSIS
―SWOT is an acronym for the internal Strengths and Weaknesses of a firm and the
environmental Opportunities and Threats facing that firm. SWOT analysis is a widely used
technique through which managers create a quick overview of a company‘s strategic
situation. The technique is based on the assumption that an effective strategy derives from a
sound ―fit‖ between a firm‘s internal resources (strengths and weaknesses) and its external
situation (opportunities and threats). A good fit maximizes a firm‘s strengths and
opportunities and minimizes its weaknesses and threats. Accurately applied, this simple
assumption has powerful implications for the design of a successful strategy.‖
Procter & Gamble
P&G is the world's largest consumer goods company that markets more than 300
brands in over180 countries. The company is engaged in producing beauty, health, fabric,
home, baby, family and personal care products. The company's product portfolio also
includes pet health products and snacks. The company's leading market position along with
its strong brand portfolio provides it with a significant competitive advantage. However,
slowdown in global economic condition is making it increasingly difficult for branded
product manufacturers like P&G to maintain their sales volume and revenue growth.
38
39. Strengths
The large scale, on which the P & G operates, is one of its strengths. It is a global leader
for different product categories like fabric, home, baby, beauty, health and personal care in
many countries. Its three hundred products are sold in over one hundred and eighty
countries.
The strong branding of P & G makes it one of the most successful brands in the world.
The company has a vast experience in oral and personal hygiene products as they are
working since...
Also, it has an extensive experience in marketing in different market segments and is one
of the best marketers in the world.
P & G is tightly integrated with some of the largest retailers in United States of America as
well as world around. and around the world Distribution channels all over the world
Gross profit margin of the company is 15 times the industry average
P & G is known for its diverse brand portfolio. The company is able to customize its global
products and brands according to the local preferences.
P & G invests greatly in its research and development to. About $2 billion are invested
every year by P & G for improving and introducing new products. The end-consumer
understanding of P & G and its large database of consumers make its research and
development strong.
Weaknesses
Many of the top brands of P & G are losing their market share rapidly. In
online media leadership and presence P & G is lagging behind.
The beauty and health products by P & G are mostly for women.
P & G does not make and offer any private label products for the retail
customers and is, missing an opportunity.
39
40. The large scale operation of the company makes the culture heavy and
processes slow. This also leads to quality control problems.
P & G does not divest its weak or poor brands.
The major customers of P & G are located at some of the places and it
concentrates heavily as them.
When P & G acquired Clairol business in year 2001, it was unable to grow
this business. The Clairol Herbal Essence brand failed to enter new markets
as the market had access to better and innovative products. This shows
weakness of P & G in the beauty care division.
Opportunities
An opportunity for P & G is health and beauty products for men. With the acquisition of
Gillette, the company now has several growth opportunities in this market segment.
P & G has doubled its Environmental Goals for the year 2012 and thus, promises more
value for the environment concerned customers today.
Using the online social networks and internet marketing techniques is also an
opportunity for P & G.
Divest brands that are not in accordance or do not meet P & G's long-term goals
Company is constantly trying to pursue growth overseas.
40
41. Threats
There is a cut throat competition in the fast moving consumer's goods markets today.
Companies like Kimberly Clark, Unilever, Johnsons & Johnsons and Colgate-Palmolive
etc pose a serious threat to its market share in different countries.
The competitors are making their product portfolios diverse day b day and using different
marketing and promotional strategies to increase their market share.
In the market many substitutes are available for P & G products at cheaper prices.
The private label growth is also a serious threat to the P & G's market share.
Due to recession, the consumer spending has decreased globally. Also, the prices for
raw materials are increasing so cost to the company is increasing.
41
43. STRATEGY
They are focused on strategies that the right for the long- term health of the Company
and will deliver total shareholder return in the top one-third of their peer group.
The Company’s long-term financial targets are:
Grow organic sales 1% to 2% faster than market growth in the categories and geographies in
which they compete,
Deliver earnings per share (EPS) growth of high single digits to low double digits, and
Generate free cash flow productivity of 90% or greater.
In order to achieve these targets, they are prioritizing the strategies and resources that will
make P&G more focused and fit to win over the near- and long-terms.
IMPROVING PRODUCTIVITY AND CREATING A COST SAVINGS CULTURE
They have taken significant steps to accelerate cost savings and create a more cost
focused culture within the Company, including a five-year, $10 billion cost savings initiative,
which was announced in February 2012. The cost savings program is based on:
The reduction of approximately 5,700 non-manufacturing overhead positions by the end of
fiscal year 2013.
Approximately $1.2 billion in annual cost of goods savings across raw materials,
manufacturing and transportation and warehousing expenses.
Generating efficiencies to enable us to grow marketing costs at a slightly slower rate than
sales growth while still increasing consumer reach and effectiveness, saving approximately
$1 billion over the five year period.
43
44. Procter and Gamble: Still a Champion Blue-Chip
Procter and Gamble (NYSE: PG) is a worldwide consumer products company, and
one of the largest companies in the world. The company has grown its dividend for well over
50 years, and has a market cap of almost $190 billion.
-Seven Year Revenue Growth Rate: 5.7%
-Seven Year EPS Growth Rate: 4.7%
-Seven Year Dividend Growth Rate: 11%
-Current Dividend Yield: 3.28%
-Balance Sheet Strength: Strong, but with Goodwill
The returns have been positive since, PG dividend stock report from 2011 when
called the stock fairly valued and a ―hold‖, but the company seems to have a diminished moat
and lackluster growth prospects. Over the long-run, earnings will begin inching up and the
rate of return will be positive, but they don‘t view the current valuation as appropriate for the
stock performance with a margin of safety. They would desire a 10% pullback or more to
invest.
Overview
Founded in 1837, Procter and Gamble (symbol: PG) is now one of the largest
companies in the world. They sell their products in over 180 countries and currently have a
market capitalization of over $180 billion. The company is known as one of the most solid
blue chip dividend stocks with the history of more than five decades of consecutive annual
dividend growth and large product diversification.
The company operates in numerous segments, as outlined below:
Beauty
With brands like Head and Shoulders, Pantene, and Olay, Procter and Gamble brings
in 24% of its sales and 22% of its earnings from its beauty segment.
Grooming
Another 10% of sales and 16% of earnings come from the grooming segment, which
includes brands like Braun, Fusion, and Gillette.
44
45. Health Care
Procter and Gamble offers a number of feminine care, oral care, and symptom-care
products, including Oral-B, Vicks, and Always. The company generates 15% of sales and
17% of earnings from this segment.
Fabric/Home Care
The company has a variety of brands like Duracell batteries, Tide detergent, and
Febreeze air care, from which it generates 32% of revenue and 26% of earnings.
Baby/Family Care
Through brands like Bounty, Charmin, and Pampers, Procter and Gamble generates
19% of sales and 19% of earnings from baby and family care products.
In terms of geographic exposure, 39% of sales come from North America, 19% come
from Western Europe, 18% come from Asia, 14% come from Africa, the Middle East, and
Central/Eastern Europe, and 10% come from Latin America.
45
46. RATIOS
Price to Earnings: 22
Price to Free Cash Flow: 22
Price to Book: 3
Return on Equity: 17%
REVENUE CHART
Sales grew at an annualized rate of 5.7% over this period, but over a more recent
period, sales growth has been flat. The company has restated numbers which are not shown
here, and those points to mild growth. In some ways, the chart is not quite as bad as it looks,
because the company was actively divesting brands over this period, including selling the
large Folgers coffee brand to Smuckers, rather than focusing on growth. Still, investors are
broadly and correctly unimpressed by Procter and Gamble‘s performance over this period.
46
47. Earnings and Dividends
In terms of earnings per share, the company grew at an annualized rate of 4.7%.
However, earnings have declined over the later period as part of the cost-cutting.
The company has stated that it targets high single digit EPS growth. When combined
with a dividend yield of over 3%, that would mean long-term low double-digit returns.
As far as the dividend is concerned, it currently yields 3.28% with a payout ratio of
under 60%. The dividend has grown by a rate of 11% annually, and the most recent increase
was 7%.
47
48. Approximate historical dividend yield at beginning of each year:
Year Yield
Current 3.28%
2012 3.1%
2011 3.0%
2010 2.9%
2009 1.8%
2008 2.5%
2007 1.9%
2006 1.9%
Like many stocks, PG was overvalued several years ago, and had a lower yield. Plus,
the payout ratio increased from around 40% to around 60% over this period.
In most years, PG spends more on stock buybacks than on dividends. Over the last 3
years, the company spent over $17 billion on share repurchases and over $17 billion on
dividends. Based on 2012 results, the company‘s shareholder yield is around 5.4%.
BALANCE SHEET
Total debt/equity for the company is under 50%, and the debt/income ratio is under 3
xs. However, over 80% of the existing shareholder equity consists of goodwill. Much of PG‘s
growth was due to acquisitions.
The interest coverage ratio is very solid, at over 17. Taking everything into account,
Procter and Gamble has a rather strong balance sheet, with manageable debt levels, a high
interest coverage ratio, and good investment grades. The only real downside to the balance
sheet is the large quantity of goodwill, but overall, it‘s in good shape.
48
49. INVESTMENT THESIS
Procter and Gamble is the largest company in the world at what it does, and has 25
billion-dollar brands. The company‘s goals, as stated in their most recent annual report, were
for an organic sales growth rate of 1-2% above global market growth rates, earnings growth
in the high single digits or low double digits, and for free cash flow to be 90% of earnings.
The company has pursued a global growth strategy, and has achieved 23% compound
annual sales growth in Brazil, 25% compound annual sales growth in Russia, 27% compound
annual sales growth in India, and 17% compound annual sales growth in China, over the last
10-year period.
For example, if a company can achieve 2% annual volume growth and 3% pricing
growth on that volume (basically in line with a standard inflation rate), then the revenue
growth is around 5%. If a company then buys back 3% of its market cap in stock
buybacks each year and net profit margins remain static, then EPS growth is in the ballpark
of 8%. Add a 3% dividend yield, and P&G got a good investment on your hands.
But if margins deteriorate, or volume growth halts, then the picture can change. In
addition, if the valuation of the stock is too high, it drives down the dividend yield and
reduces the number of shares that the company can repurchase, which in turn reduces the EPS
growth rate. That‘s something that not everyone realizes: that for a company that does
buybacks, a high stock valuation results in a measurable reduction in EPS growth compared
to if the stock valuation were low. Slow and profitable growth works great when the
valuation is low enough to provide double-digit returns.
For Procter and Gamble, they announced earlier in 2012 a plan to save $10 billion in
operations by the end of 2016. Specifically, they call for $6 billion in savings on cost of
goods (which comes out to around $1.2 billion per year), $3 billion in savings on overhead
(reducing the number of employees, at about $600 million per year), and then $1 billion in
savings from marketing, or around $200 million per year.
To do this and keep the top line intact means that these savings can go towards
dividends, buybacks, or strengthening the balance sheet.
49
50. RISKS
Procter and Gamble faces commodity cost risk and global currency risk. More
specifically, they operate in a highly competitive industry, and if consumers are looking to
reduce spending, they can switch and have switched to private label products. Plus, other
branded companies with overlapping products, like Colgate, can fight for market share.
If the company doesn‘t make good use of its advertising, maintain pricing power, and
continue to grow global volume, then their earnings growth rate won‘t match their target rate
of high single digits or better per year.
50
51. THE PROCTER & GAMBLE COMPANY AND SUBSIDIARIES
(Amounts in Millions Except Per Share Amounts)
Consolidated Earnings Information
Three Months Ended March Nine Months Ended March
31 31
2012 2011 % CHG 2012 2011 % CHG
NET SALES $ 20,194 $ 19,893 2 % $ 63,468 $ 60,653 5 %
Cost of products sold 10,237 9,789 5 % 31,894 29,327 9 %
Selling, general & administrative 6,636 6,399 4 % 19,769 19,010 4 %
expense
Goodwill & indefinite lived 22 0 - 1,576 0
-
intangible impairment charges
OPERATING INCOME 3,299 3,705 (11) % 10,229 12,316 (17) %
Total interest expense 179 202 (11) % 587 619 (5) %
Other non-operating
67 104 (36) % 238 171 39 %
income/(expense),
EARNINGS FROM
CONTINUING OPERATIONS 3,187 3,607 (12) % 9,880 11,868 (17) %
BEFORE INCOME TAXES
Income taxes on continuing
754 748 1 % 2,776 2,638 5 %
operations
NET EARNINGS FROM
2,433 2,859 (15) % 7,104 9,230 (23) %
CONTINUING OPERATIONS
NET EARNINGS FROM
DISCONTINUED 34 47 (28) % 133 158
OPERATIONS
Net earnings 2,467 2,906 (15) % 7,237 9,388 (23) %
Less: net earnings attributable to
56 33 70 % 112 101 11 %
non controlling interests
NET EARNINGS
ATTRIBUTABLE TO 2,411 2,873 (16) % 7,125 9,287 (23) %
PROCTER & GAMBLE
Effective tax rate 23.7 % 20.7 % 28.1 % 22.2 %
51
52. BASIC NET EARNINGS PER
COMMON SHARE (1):
Earnings from continuing $ 0.84 $ 0.99 (15) % $ 2.47 $ 3.18 (22) %
operations
Earnings from discontinued $ 0.01 $ 0.02 (50) % $ 0.05 $ 0.06 (17) %
operations
BASIC NET EARNINGS PER
$ 0.85 $ 1.01 (16) % $ 2.52 $ 3.24 (22) %
COMMON SHARE
DILUTED NET EARNINGS
PER COMMON SHARE (1):
Earnings from continuing
$ 0.81 $ 0.94 (14) % $ 2.37 $ 3.04 (22) %
operations
Earnings from discontinued
$ 0.01 $ 0.02 (50) % $ 0.05 $ 0.05 0 %
operations
DILUTED NET EARNINGS
$ 0.82 $ 0.96 (15) % $ 2.42 $ 3.09 (22) %
PER COMMON SHARE
DIVIDENDS PER COMMON
$ 0.5250 $ 0.4818 9 % $ 1.5750 $ 1.4454 9 %
SHARE
Average diluted shares
2,937.8 2,999.3 2,944.9 3,008.6
outstanding
52
54. THE PROCTER & GAMBLE COMPANY AND SUBSIDIARIES
(Amounts in Millions)
Consolidated Cash Flows Information
Nine Months Ended March 31
2012 2011
Cash and cash equivalents, $ 2,768 $ 2,879
beginning of period
Operating activities
Net earnings 7,237 9,388
Depreciation and amortization 2,427 2,103
Share-based compensation 277 295
expense
Deferred income taxes (5) 186
Gain on sale of businesses (201) (70)
Goodwill and indefinite lived 1,576 0
intangibles impairment charges
Changes in:
Accounts receivable (347) (495)
Inventories (287) (817)
Accounts payable, accrued and (1,558) (223)
other liabilities
Other operating assets & 131 (831)
liabilities
Other 61 (84)
TOTAL OPERATING 9,311 9,452
ACTIVITIES
54
55. INVESTING
ACTIVITIES
Capital expenditures (2,663) (2,066)
Proceeds from asset sales 290 89
Acquisitions, net of cash (4) (489)
acquired
Change in investments 90 97
TOTAL INVESTING (2,287) (2,369)
ACTIVITIES
FINANCING
ACTIVITIES
Dividends to shareholders (4,521) (4,237)
Change in short-term debt (122) (420)
Additions to long-term debt 3,985 1,536
Reductions of long-term debt (2,514) (188)
Treasury stock purchases (4,023) (4,536)
Impact of stock options and 1,439 691
other
TOTAL FINANCING (5,756) (7,154)
ACTIVITIES
Effect of exchange rate changes (45) 138
on cash and cash equivalents
Change in cash and cash 1,223 67
equivalents
CASH EQUIVALENTS $ 3,991 $ 2,946
55
56. THE PROCTER & GAMBLE COMPANY AND SUBSIDIARIES
(Amounts in Millions)
Consolidated Balance Sheet Information
March 31, June 30,
2012 2011
Cash and cash equivalents $ 3,991 $ 2,768
Accounts receivable 6,200 6,275
Total inventories 7,239 7,379
Other 5,678 5,548
TOTAL CURRENT ASSETS 23,108 21,970
Net property, plant and equipment 20,384 21,293
Net goodwill and other intangible 86,262 90,182
assets
Other non-current assets 4,851 4,909
TOTAL ASSETS $ 134,605 $ 138,354
Accounts payable $ 6,684 $ 8,022
Accrued and other liabilities 8,449 9,290
Debt due within one year 11,771 9,981
TOTAL CURRENT LIABILITIES 26,904 27,293
Long-term debt 21,341 22,033
Other 20,451 21,027
TOTAL LIABILITIES 68,696 70,353
56
57. THE PROCTER & GAMBLE COMPANY AND
SUBSIDIARIES
(Amounts in Millions)
Consolidated Earnings Information
Three Months Ended March 31, 2012
Earnings from % Net Earnings
%
% Change Continuing Change Attributable
Change
Versus Operations Versus to
Net Sales Versus
Year Ago Before Income Year Procter &
Year Ago
Taxes Ago Gamble
Beauty $ 4,844 1 % $ 710 1 % $ 523 3 %
Grooming 1,962 0 % 530 -9 % 398 -4 %
Health Care 3,018 2 % 638 -3 % 411 -4 %
Fabric Care and
6,595 1 % 1,161 -7 % 716 -9 %
Home Care
Baby Care and
4,153 5 % 903 9 % 573 9 %
Family Care
Corporate (378) N/A (755) N/A (210) N/A
TOTAL
20,194 2 % 3,187 -12 % 2,411 -16 %
COMPANY
57
58. Nine Months Ended March 31, 2012
Earnings from % Net Earnings %
% Change Continuing Change Attributable Change
Net Sales Versus Operations Versus to Versus
Year Ago Before Income Year Procter & Year
Taxes Ago Gamble Ago
Beauty $ 15,512 4 % $ 2,652 -6 % $ 2,008 -7 %
Grooming 6,332 4 % 1,861 2 % 1,401 2 %
Health Care 9,492 4 % 2,222 2 % 1,490 3 %
Fabric Care and
20,703 4 % 3,643 -7 % 2,280 -10 %
Home Care
Baby Care and
12,394 7 % 2,511 5 % 1,583 6 %
Family Care
Corporate (965) N/A (3,009) N/A (1,637) N/A
TOTAL
63,468 5 % 9,880 -17 % 7,125 -23 %
COMPANY
58
59. Three Months Ended March 31, 2012
(Percent Change vs. Year Ago) *
Volume Volume
With Without
Acquisitions
Acquisitions/ Foreign Net Sales
/
Divestitures Divestitures Exchange Price Mix/Other Growth
Beauty
1 % 1 % -1 % 5 % -4 % 1 %
Grooming 1 % 1 % -2 % 3 % -2 % 0 %
Health Care 0 % -1 % -1 % 3 % 0 % 2 %
Fabric Care and
-3 % -3 % -1 % 7 % -2 % 1 %
Home Care
Baby Care and
3 % 3 % -1 % 5 % -2 % 5 %
Family Care
Total Company 0 % 0 % -1 % 5 % -2 % 2 %
59
60. Nine Months Ended March 31, 2012
(Percent Change vs. Year Ago) *
Volume Volume
With Without
Acquisitions
Acquisitions/ Foreign Net Sales
/
Divestitures Divestitures Exchange Price Mix/Other Growth
Beauty 2 % 3 % 2 % 3 % -3 % 4 %
Grooming 1 % 1 % 2 % 2 % -1 % 4 %
Health Care 1 % 1 % 1 % 3 % -1 % 4 %
Fabric Care and
-1 % -1 % 1 % 6 % -2 % 4 %
Home Care
Baby Care and
2 % 2 % 1 % 4 % 0 % 7 %
Family Care
Total Company
1 % 1 % 1 % 4 % -1 % 5 %
60
61. SHORT-TERM (OPERATING) ACTIVITY RATIOS
RATIOS (SUMMARY)
Procter & Gamble Co.,
Jun 30, Jun 30, Jun 30, Jun 30, Jun 30, Jun 30,
2012 2011 2010 2009 2008 2007
Turnover Ratios
Inventory turnover 12.45 11.19 12.36 11.49 9.92 11.22
Receivables turnover 13.79 13.16 14.80 13.54 12.35 11.54
Payables turnover 10.57 10.29 10.89 13.22 12.33 13.39
Working capital 17.19 14.66 17.67 11.73 9.94 9.88
turnover
Average No. of Days
Average inventory 29 33 30 32 37 33
processing period
Add: Average 26 28 25 27 30 32
receivable collection
period
Operating cycle 56 60 54 59 66 64
Less: Average payables 35 35 34 28 30 27
payment period
Cash conversion 21 25 21 31 37 37
cycle
61
62. INVENTORY TURNOVER
Jun 30, Jun 30, Jun 30, Jun 30, Jun 30, Jun 30,
2012 2011 2010 2009 2008 2007
Selected Financial Data (USD $ in millions)
Net sales 83,680 82,559 78,938 79,029 83,503 76,476
Inventories 6,721 7,379 6,384 6,880 8,416 6,819
Inventory Turnover, Comparison to Industry
Procter & Gamble 12.45 11.19 12.36 11.49 9.92 11.22
Co.
Industry, Consumer – 11.02 10.51 10.01 10.56 –
Goods
Inventory turnover = Net sales / Inventories
= 83,680 / 6,721 = 12.45
Ratio Description The company
Inventory An activity ratio calculated as Procter & Gamble Co.'s inventory turnover
turnover revenue divided by inventory. deteriorated from 2010 to 2011 but then improved
from 2011 to 2012 exceeding 2010 level.
62
63. RECEIVEBLE TURNOVER
Jun 30, Jun 30, Jun 30, Jun 30, Jun 30, Jun 30,
2012 2011 2010 2009 2008 2007
Selected Financial Data (USD $ in millions)
Net sales 83,680 82,559 78,938 79,029 83,503 76,476
Accounts 6,068 6,275 5,335 5,836 6,761 6,629
receivable
Receivables Turnover, Comparison to Industry
Procter & 13.79 13.16 14.80 13.54 12.35 11.54
Gamble
Co.1
Industry, – 12.21 11.17 12.64 12.03 –
Consumer
Goods
Receivable turnover = Net Sales / Accounts receivable
= 83,680 / 6,068 = 13.79
Ratio Description The company
Receivables An activity ratio equal to revenue Procter & Gamble Co.'s receivables turnover
turnover divided by receivables. deteriorated from 2010 to 2011 but then
slightly improved from 2011 to 2012.
63
64. PAYABLE TURNOVER
Jun 30, Jun 30, Jun 30, Jun 30, Jun 30, Jun 30,
2012 2011 2010 2009 2008 2007
Selected Financial Data (USD $ in millions)
Net sales 83,680 82,559 78,938 79,029 83,503 76,476
Accounts payable 7,920 8,022 7,251 5,980 6,775 5,710
Payables Turnover, Comparison to Industry
Procter & Gamble Co. 10.57 10.29 10.89 13.22 12.33 13.39
Industry, Consumer – 13.32 11.93 15.94 13.46 –
Goods
Payable turnover = Net sales / Accounts payable
= 83,680 / 7,920 = 10.57
Ratio Description The company
Payables An activity ratio calculated as Procter & Gamble Co.'s payables turnover
turnover revenue divided by payables. declined from 2010 to 2011 but then slightly
increased from 2011 to 2012.
64
65. WORKING CAPITAL TURNOVER
Jun 30, Jun 30, Jun 30, Jun 30, Jun 30, Jun 30,
2012 2011 2010 2009 2008 2007
Selected Financial Data (USD $ in millions)
Net sales 83,680 82,559 78,938 79,029 83,503 76,476
Working capital 4,869 5,632 4,468 6,736 8,402 7,738
Working Capital Turnover, Comparison to Industry
Procter & Gamble Co. 17.19 14.66 17.67 11.73 9.94 9.88
Industry, Consumer – 10.25 9.92 8.60 9.66 –
Goods
Working capital turnover = Net sales / working capital
= 83,680 / 4,869 = 17.19
Ratio Description The company
Working capital An activity ratio calculated as Procter & Gamble Co.'s working capital
turnover revenue divided by working turnover deteriorated from 2010 to 2011 but
capital. then improved from 2011 to 2012 not
reaching 2010 level.
65
66. AVERAGE INVENTORY PROCESSING PERIOD
No. Of days
Jun 30, Jun 30, Jun 30, Jun 30, Jun 30, Jun 30,
2012 2011 2010 2009 2008 2007
Selected Financial Data
Inventory turnover 12.45 11.19 12.36 11.49 9.92 11.22
Average Inventory Processing Period (no. of days), Comparison to Industry
Procter & Gamble Co. 29 33 30 32 37 33
Industry, Consumer – 33 35 36 35 –
Goods
Average inventory processing period = 365 / Inventory turnover
= 365 / 12.45 = 29
Ratio Description The company
Average An activity ratio equal to the Procter & Gamble Co.'s average inventory
inventory number of days in the period processing period deteriorated from 2010 to 2011
processing divided by inventory turnover but then improved from 2011 to 2012 exceeding
period over the period. 2010 level.
66
67. AVERAGE RECEIVEBLE COLLECTION PERIOD
No. Of days
Jun 30, Jun 30, Jun 30, Jun 30, Jun 30, Jun 30,
2012 2011 2010 2009 2008 2007
Selected Financial Data
Receivables turnover 13.79 13.16 14.80 13.54 12.35 11.54
Average Receivable Collection Period (no. of days), Comparison to Industry
Procter & Gamble Co. 26 28 25 27 30 32
Industry, Consumer – 30 33 29 30 –
Goods
Average receivable collection period = 365 / receivable turnover
= 365 / 13.79 = 26
Ratio Description The company
Average An activity ratio equal to the Procter & Gamble Co.'s average receivable
receivable number of days in the period collection period deteriorated from 2010 to 2011
collection divided by receivables turnover. but then slightly improved from 2011 to 2012.
period
67
68. OPERATING CYCLE
Jun 30, Jun 30, Jun 30, Jun 30, Jun 30, Jun 30,
2012 2011 2010 2009 2008 2007
Selected Financial Data
Average inventory 29 33 30 32 37 33
processing period
Average receivable 26 28 25 27 30 32
collection period
Operating Cycle, Comparison to Industry
Procter & Gamble 56 60 54 59 66 64
Co.
Industry, Consumer – 63 67 65 65 –
Goods
Operating cycle = Average inventory processing period + Average
receivable collection period
= 29 + 26 = 56
Ratio Description The company
Operating Equal to average inventory Procter & Gamble Co.'s operating cycle
cycle processing period plus average deteriorated from 2010 to 2011 but then
receivables collection period. improved from 2011 to 2012 not reaching 2010
level.
68
69. AVERAGE PAYABLES PAYMENT PERIOD
No. Of days
Jun 30, Jun 30, Jun 30, Jun 30, Jun 30, Jun 30,
2012 2011 2010 2009 2008 2007
Selected Financial Data
Payables turnover 10.57 10.29 10.89 13.22 12.33 13.39
Average Payables Payment Period (no. of days), Comparison to Industry
Procter & 35 35 34 28 30 27
Gamble Co.
Industry, – 27 31 23 27 –
Consumer Goods
Average payable payment period = 365 / payable turnover
= 365 / 10.57 = 35
Ratio Description The company
Average An estimate of the average number of days Procter & Gamble Co.'s average
payables it takes a company to pay its suppliers; payables payment period increased
payment equal to the number of days in the period from 2010 to 2011 but then slightly
period divided by payables turnover ratio for the declined from 2011 to 2012.
period.
69
70. CASH CONVERSION CYCLE
No. Of days
Jun 30, Jun 30, Jun 30, Jun 30, Jun 30, Jun 30,
2012 2011 2010 2009 2008 2007
Selected Financial Data
Average inventory 29 33 30 32 37 33
processing period
Average receivable 26 28 25 27 30 32
collection period
Average payables 35 35 34 28 30 27
payment period
Cash Conversion Cycle, Comparison to Industry
Procter & Gamble Co. 21 25 21 31 37 37
Industry, Consumer – 36 37 42 38 –
Goods
Cash conversion cycle = Average inventory processing period + Average
receivable collection period – Average payables payment period
= 29 + 26 – 35 = 21
Ratio Description The company
Cash A financial metric that measures the length of Procter & Gamble Co.'s cash
conversion time required for a company to convert cash conversion cycle deteriorated from
cycle invested in its operations to cash received as a 2010 to 2011 but then improved
result of its operations; equal to average from 2011 to 2012 not reaching
inventory processing period plus average 2010 level.
receivables collection period minus average
payables payment period.
70
71. LONG-TERM (INVESTMENT) ACTIVITY RATIOS
RATIOS (SUMMARY)
Procter & Gamble Co.,
Jun 30, Jun 30, Jun 30, Jun 30, Jun 30, Jun 30,
2012 2011 2010 2009 2008 2007
Net fixed 4.11 3.88 4.10 4.06 4.05 3.91
asset
turnover
Total asset 0.63 0.60 0.62 0.59 0.58 0.55
turnover
Equity 1.32 1.22 1.29 1.25 1.20 1.15
turnover
71
72. NET FIXED ASSET TURNOVER
Jun 30, Jun 30, Jun 30, Jun 30, Jun 30, Jun 30,
2012 2011 2010 2009 2008 2007
Selected Financial Data (USD $ in millions)
Net sales 83,680 82,559 78,938 79,029 83,503 76,476
Net property, 20,377 21,293 19,244 19,462 20,640 19,540
plant and
equipment
Net Fixed Asset Turnover, Comparison to Industry
Procter & 4.11 3.88 4.10 4.06 4.05 3.91
Gamble Co.
Industry, – 3.67 3.47 3.62 4.10 –
Consumer Goods
Net fixed asset turnover = Net sales / Net property, plant and equipment
= 83,680 / 20,377 = 4.11
Ratio Description The company
Net fixed asset An activity ratio calculated as total Procter & Gamble Co.'s net fixed
turnover revenue divided by net fixed assets. asset turnover deteriorated from
2010 to 2011 but then improved
from 2011 to 2012 exceeding 2010
level.
72
73. TOTAL ASSET TURNOVER
Jun 30, Jun 30, Jun 30, Jun 30, Jun 30, Jun 30,
2012 2011 2010 2009 2008 2007
Selected Financial Data (USD $ in millions)
Net sales 83,680 82,559 78,938 79,029 83,503 76,476
Total assets 132,244 138,354 128,172 134,833 143,992 138,014
Total Asset Turnover, Comparison to Industry
Procter & Gamble 0.63 0.60 0.62 0.59 0.58 0.55
Co.
Industry, Consumer – 0.77 0.75 0.81 0.88 –
Goods
Total asset turnover = Net sales / Total asset
= 83,680 / 132,244 = 0.63
Ratio Description The company
Total asset An activity ratio calculated as total Procter & Gamble Co.'s total asset
turnover revenue divided by total assets. turnover deteriorated from 2010 to
2011 but then improved from 2011 to
2012 exceeding 2010 level.
73
74. EQUITY TURNOVER
Jun 30, Jun 30, Jun 30, Jun 30, Jun 30, Jun 30,
2012 2011 2010 2009 2008 2007
Selected Financial Data (USD $ in millions)
Net sales 83,680 82,559 78,938 79,029 83,503 76,476
Shareholders' equity 63,439 67,640 61,115 63,099 69,494 66,760
attributable to parent
Equity Turnover, Comparison to Industry
Procter & Gamble Co. 1.32 1.22 1.29 1.25 1.20 1.15
Industry, Consumer – 2.19 2.11 2.25 2.39 –
Goods
Equity turnover = Net sales / Shareholders’ equity attributable to parent
= 83,680 / 63,439 = 1.32
Ratio Description The company
Equity turnover An activity ratio calculated as total Procter & Gamble Co.'s equity
revenue divided by shareholders' turnover deteriorated from 2010 to
equity. 2011 but then improved from 2011 to
2012 exceeding 2010 level.
74
75. LIQUIDITY ANALYSIS
Procter & Gamble Co. (PG)
Ratios (Summary)
Current Ratio
Quick Ratio
Cash Ratio
Ratios (Summary)
Procter & Gamble Co., liquidity ratios
Jun 30, Jun 30, Jun 30, Jun 30, Jun 30, Jun 30,
2012 2011 2010 2009 2008 2007
Current ratio 0.88 0.80 0.77 0.71 0.79 0.78
Quick ratio 0.42 0.33 0.34 0.34 0.33 0.40
Cash ratio 0.18 0.10 0.12 0.15 0.11 0.18
75
76. CURRENT RATIO
Jun 30, Jun 30, Jun 30, Jun 30, Jun 30, Jun 30,
2012 2011 2010 2009 2008 2007
Selected Financial Data (USD $ in millions)
Current assets 21,910 21,970 18,782 21,905 24,515 24,031
Current liabilities 24,907 27,293 24,282 30,901 30,958 30,717
Current Ratio, Comparison to Industry
Procter & 0.88 0.80 0.77 0.71 0.79 0.78
Gamble Co.
Industry, – 1.10 1.20 1.10 1.07 –
Consumer Goods
Current ratio = Current assets / current liabilities
= 21,910 / 24,907 = 0.88
Ratio Description The company
Current ratio A liquidity ratio calculated as Procter & Gamble Co.'s current
current assets divided by ratio improved from 2010 to
current liabilities. 2011 and from 2011 to 2012.
76
77. QUICK RATIO
Jun 30, Jun 30, Jun 30, Jun 30, Jun 30, Jun 30,
2012 2011 2010 2009 2008 2007
Selected Financial Data (USD $ in millions)
Cash and cash 4,436 2,768 2,879 4,781 3,313 5,354
equivalents
Investment – – – – 228 202
securities
Accounts 6,068 6,275 5,335 5,836 6,761 6,629
receivable
Total quick assets 10,504 9,043 8,214 10,617 10,302 12,185
Current liabilities 24,907 27,293 24,282 30,901 30,958 30,717
Quick Ratio, Comparison to Industry
Procter & Gamble 0.42 0.33 0.34 0.34 0.33 0.40
Co.
Industry, – 0.75 0.82 0.70 0.69 –
Consumer Goods
Quick ratio = total quick assets / current liabilities
= 10,504 / 24,907 = 0.42
Ratio Description The company
Quick ratio A liquidity ratio calculated as (cash Procter & Gamble Co.'s quick ratio
plus short-term marketable deteriorated from 2010 to 2011 but
investments plus receivables) divided then improved from 2011 to 2012
by current liabilities. exceeding 2010 level.
77
78. CASH RATIO
Jun 30, Jun 30, Jun 30, Jun 30, Jun 30, Jun 30,
2012 2011 2010 2009 2008 2007
Selected Financial Data (USD $ in millions)
Cash and cash 4,436 2,768 2,879 4,781 3,313 5,354
equivalents
Investment – – – – 228 202
securities
Total cash 4,436 2,768 2,879 4,781 3,541 5,556
assets
Current 24,907 27,293 24,282 30,901 30,958 30,717
liabilities
Cash Ratio, Comparison to Industry
Procter & 0.18 0.10 0.12 0.15 0.11 0.18
Gamble Co.
Industry, – 0.33 0.35 0.28 0.23 –
Consumer
Goods
Cash ratio = Total cash assets / Current liabilities
= 4,436 / 24,907 = 0.18
Ratio Description The company
Cash ratio A liquidity ratio calculated as (cash Procter & Gamble Co.'s cash ratio
plus short-term marketable deteriorated from 2010 to 2011 but then
investments) divided by current improved from 2011 to 2012 exceeding
liabilities. 2010 level.
78