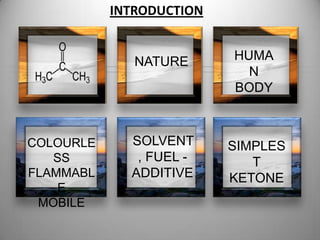
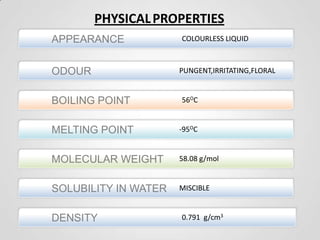
1. Acetone is a colorless, flammable, and mobile liquid that is the simplest ketone. It is used as a solvent and fuel additive.
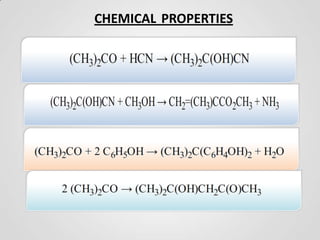
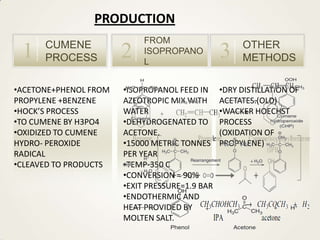
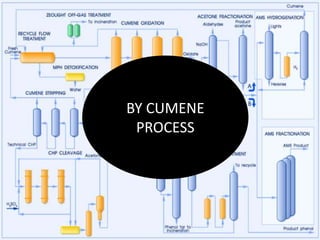
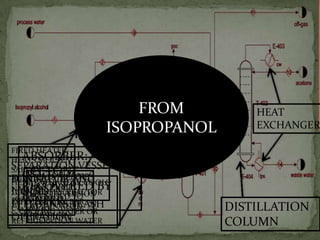
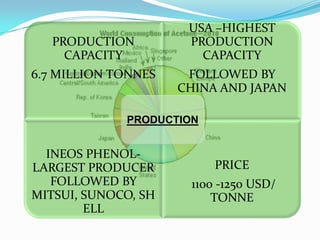
2. Acetone is produced commercially through two main processes - the cumene process and from isopropanol. The cumene process involves oxidizing cumene to form acetone and phenol. Production from isopropanol involves dehydrogenating isopropanol at high temperatures.
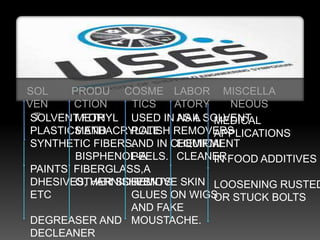
3. Acetone has a wide variety of applications including as a solvent for plastics, synthetic fibers, paints, adhesives, and varnishes. It is also used in cosmetics, laboratories, and as a miscellaneous solvent.
The document describes a two-step process to prepare 2-phenylindole from phenylhydrazine and acetophenone. The first step involves a condensation reaction of acetophenone and phenylhydrazine in ethanol and acetic acid to form acetophenone phenylhydrazone. The second step performs a Fischer indole cyclization of acetophenone phenylhydrazone in phosphoric acid and sulfuric acid to yield the final product 2-phenylindole. The product is then purified through recrystallization and its melting point is obtained.
Emma Rice, director of production and sales of Hattingley Valley UK will moderate the panel and inform attendees on considerations for developing a luxury quality sparkling region. Belinda Kemp, research professor at Brock University, Ontario, will present research on exploring leaf-pulling techniques for quality and Pinot noir press cuts for quality traditional method sparkling production accompanied by a tasting of Adelsheim press-cut Pinot noir base wines. Nate Klostermann of Argyle Winery will present Chardonnay base wines fermented in three different vessels. Rob Stuart of R.Stuart & Co. will discuss his beginnings with developing a premium method traditional sparkling wine brand and will present along with Nate Klostermann of Argyle a base wine blending trial. Eglantine Chauffour of Enartis will also join this panel.
This document describes a method for determining the gypsum requirement of alkali soils to aid in soil reclamation. Key steps include:
1) Adding a saturated gypsum solution to a sample of soil and allowing them to equilibrate.
2) Titrating the calcium and magnesium left in the solution after equilibration using versenate titration to determine the amount adsorbed by the soil.
3) The amount adsorbed provides a measure of the gypsum requirement to replace sodium in the soil as an initial step in reclamation.
The document describes procedures for converting stilbene to diphenylacetylene through bromination and elimination reactions. It involves brominating trans-stilbene with pyridinium tribromide to form the dibromide. Then heating the dibromide with potassium hydroxide eliminates hydrogen bromide to form diphenylacetylene. The procedures provide modifications to reaction conditions like times, temperatures, and solvent amounts to optimize product yield and purity. Safety warnings are included for handling hot sand, corrosive acids and bases.
Potassium in solution is atomized to flame and the flame excites atom of potassium causing them to emit radiation at specific wavelength. The amount of radiation emitted is directly proportional to concentration of the solution and it is measured in a flame photometer with suitable filter, which transmits only potassium wavelength (768 nm red filter).
This document describes the synthesis of benzocaine from p-aminobenzoic acid. P-aminobenzoic acid is reacted with ethanol in the presence of hydrochloric acid via an esterification reaction to form ethyl p-aminobenzoate (benzocaine). The percentage yield of benzocaine obtained was 93.3%, close to the theoretical yield, and it has a melting point of 91°C. Benzocaine is used as a local anesthetic to relieve minor mouth pain.
This lab report summarizes the brewing of a Kolsch beer. Key details include:
- The mash pH was high at 5.69 likely due to soft water and low acidity malts.
- The beer was oversparged, extracting tannins and reducing efficiency.
- Sensory analysis found cardboard, diacetyl and DMS flavors indicating issues with yeast and knockout processes.
- The astringent bitterness was attributed to high mash pH and oversparging extracting tannins.
An 2012 overview of our Arsenic Quick, recognized throughout the world as premium inorganic arsenic field test kits. Designed using cutting-edge chemistry, our kits report results in as few as 14 minutes and detect from 0.3 ppb. All Arsenic Quick™ kits detect below the MCL limits of inorganic arsenic concentrations in drinking water set by the EPA of 10 ppb (parts per billion) and the FDA limit in bottled water of 5 ppb. Our patented test kits are used by various world relief organizations. Performance and accuracy of these kits have been verified by the USEPA through the ETV program and require no technical training or equipment.
The document provides procedures for microscale synthesis of several organic compounds including aspirin, E-benzal, and azodyes. Microscale chemistry uses small quantities of chemicals to reduce waste and improve safety. It describes basic microscale equipment like conical vials, air condensers, Craig tubes for recrystallization, and pipettes. The aspirin synthesis involves reacting salicylic acid with acetyl chloride to form aspirin, which is then recrystallized. The E-benzal synthesis reacts benzaldehyde with hydroxylamine hydrochloride in the presence of sodium hydroxide.
Practical Experiment 8: To synthesize and characterized barbaturic acid SONALI PAWAR
The document describes an experiment to prepare barbituric acid from urea and diethyl malonate. Sodium metal is reacted with ethanol to form sodium ethoxide, which promotes a condensation reaction between diethyl malonate and urea. This results in the cyclization and formation of barbituric acid. The theoretical yield is calculated to be 64g based on the reactants used. The actual yield obtained is 61g, giving a percentage yield of 95.3%.
Preliminary findings on pb sorption characteristics of 2 tropical soilsFatai Olabanji Balogun
Analytical work and Experiment protocol on Lead (Pb) sorption in 2 tropical soils. This works aims to elucidate on the role of aging time, and temperature on the fractionation of lead in these two tropical soils.
The document provides a diagnostic analysis of soil and water from Darjeepara village in West Bengal, India. Soil and water samples were collected and various tests were conducted to analyze pH, organic carbon, available phosphorus, potassium, and nitrate nitrogen in the soil. Water quality parameters like EC, pH, sodium, calcium, magnesium, carbonate, bicarbonate, RSC and SAR were also analyzed. The results of all tests for both soil and water were found to be in the safe range, indicating the soil and water samples can support crop cultivation without limitations.
Titration is a process used to determine the concentration of an unknown substance. It involves adding a measured volume of the unknown sample and titrating it with a standard solution until the equivalence point is reached. The equivalence point is identified using an indicator that changes color at the exact point when the amounts of reacting substances are equivalent. The volume of standard solution used is then used to calculate the concentration of the original unknown sample.
This document discusses methods for determining available phosphorus in soil. There are two main methods - Bray's method for acid soils, which uses ammonium fluoride and hydrochloric acid to extract phosphorus, and Olsen's method for neutral/alkaline soils, which uses sodium bicarbonate. The extracted phosphorus reacts with ammonium molybdate in an acid solution to form a blue complex, the intensity of which can be measured to determine phosphorus concentration. Proper extraction and color development procedures are outlined to accurately quantify available phosphorus in soil samples.
This document describes biochemical tests used to identify bacteria, including the Indole test, Methyl Red test, Voges-Proskauer test, and Citrate test.
The Indole test detects the production of indole from tryptophan. A positive result is indicated by a yellow or cherry red color change with Kovac's reagent.
The Methyl Red test identifies stable acid production from glucose in MR-VP broth, indicated by a red color with methyl red indicator.
The Voges-Proskauer test detects acetyl methyl carbinol production from glucose, shown as a pinkish red color change when alpha-naphthol and potassium hydroxide are added.
Removal of Ammonium Hydroxide from EthanolMelissa Nguyen
This document summarizes a project to salvage ethanol from a waste stream produced using the Stober process. The goal is to reduce the ammonia content to below 0.5%. Two methods are proposed: 1) distillation to remove over 99% of ammonia but with 10% ethanol loss, and 2) using a bubble bed and activated carbon to reduce ammonia to around 1% while retaining 96% of ethanol. Both methods aim to reuse over 85% of the ethanol, a major material cost. Future work includes economic analysis and accurately measuring residual ammonia levels to optimize the process.
This document provides details for a design project involving the production of acetone. Students are tasked with designing a process to produce 15,000 metric tons per year of acetone via the reaction of isopropanol. The document outlines the process details including feed streams, equipment, costs, and economic analysis. It also specifies the deliverables which include a written report with process flow diagram and stream table, as well as an oral presentation.
Industrial production of chemical solvents “Acetone”Esam Yahya
This document discusses various types of chemical solvents including their classification and common uses. It focuses on acetone, describing its structure and various industrial production methods such as the cumene process, fermentation, and oxidation. Acetone is widely used as an industrial and laboratory solvent as well as in products like nail polish remover due to its ability to dissolve many compounds.
Acetone is an organic compound with the formula (CH3)2CO. It is the simplest ketone. Acetone has a colorless, pungent odor and is miscible with water and many organic solvents. It is produced industrially via the cumene process, which involves oxidation of cumene. Other production methods include oxidation of isopropyl alcohol, hydrolysis of halogenated compounds, and fermentation. India's annual acetone production has increased in recent years and the country imports acetone to meet domestic demand. Major Indian producers include Reliance Industries and HPCL.
Industrial production of chemical solvents “Acetone” 2Esam Yahya
Acetone is produced industrially mainly through the cumene process, in which propylene and benzene are reacted to form cumene, which is then oxidized to form phenol and acetone. Other industrial production methods for acetone include the oxidation of isopropyl alcohol, hydrolysis of gem-dihalides, and reactions of alkane nitriles with Grignard reagents followed by hydrolysis. Acetone is widely used as a solvent in industries such as cleaning, paints, adhesives, and more. Strict laws regulate volatile organic compound emissions from industrial acetone production and use.
1. Acetone-butanol fermentation is a process that uses Clostridium bacteria to produce acetone and butanol from glucose through anaerobic fermentation.
2. Clostridium acetobutylicum and Clostridium beijerinckii are commonly used species that produce a 3:6:1 ratio of acetone, butanol, and ethanol.
3. Historically this fermentation process was used commercially until the 1970s to produce acetone and butanol, which are used as solvents and in producing synthetic rubbers, lacquers, and explosives.
The consultants proposed increasing acetone production by 30% but their modeling had issues predicting separation at high concentrations. Their options were extractive distillation, purchasing acetone, or producing 97.6% purity. Extractive distillation was too costly. Purchasing acetone for $10.92 million annually was the best option to minimize losses compared to adding equipment for higher purity. The team recommends buying acetone but could improve their presentation by using informative headings and conclusions before recommendations.
This process involves upgrading waste streams from an existing plant to produce 189 MMlb/yr of acetone product. Two waste streams containing acetone and isopropanol will be fed to a new plant and processed using distillation columns and a reactor. In the reactor, isopropanol is converted to acetone over a copper-alumina catalyst. The overall process involves 7 distillation columns and separation of reactants and products to achieve >99.9% pure acetone product. Building this plant is not recommended due to its high capital costs and lower economic attractiveness compared to other company projects. Selling the waste streams is the best option economically.
This document discusses biobutanol as an alternative fuel. It is produced through fermentation of biomass using microbes. Biobutanol has advantages over bioethanol such as being non-hygroscopic and having a higher energy density. The fermentation and reactions involved in biobutanol production are explained. Properties of biobutanol like octane rating and heat of vaporization are compared to gasoline and other fuels. Modifications needed for gasoline engines to run on biobutanol include changes to the intake manifold, carburetor, and using a fuel pre-heater due to biobutanol's higher ignition temperature. Overall, biobutanol can be a safer and slightly lower power alternative
O documento conta a história de um menino de 5 anos que perdeu sua irmã e mãe em um acidente de carro causado por um motorista bêbado. Ele queria comprar uma boneca para sua mãe levar para sua irmã no céu. Com a ajuda do narrador, o menino consegue comprar a boneca e uma rosa amarela para sua mãe.
Fungi can be helpful in your garden and delicious in the kitchen. This class offers a peek into the fungi kingdom at large and addresses DIY indoor growing and cultivation methods with the option to transfer your fungi to your outdoor garden in the spring. In addition to a demonstration of basic propagation techniques, the class offers resources for finding mushroom materials to work with as you set about on your homegrown mycological pursuits.
Present at the Brooklyn Botanic Garden on October 11, 2015 as part of continuing education.
Presentation developed and presented by @Gil_Lopez
The document contains 20 multiple choice questions about viruses and viral reproduction from a biology textbook chapter. The questions cover topics like the basic structure and composition of viruses, different types of viral cycles (lytic vs lysogenic), how viruses infect cells and reproduce, plant viruses, retroviruses, and some specific virus examples.
Mushrooms have long been used as a food source and in traditional medicine. They provide many health benefits and are a source of important nutrients. However, only about 10% of the estimated 140,000 mushroom species are known. Conservation efforts for mushrooms are important but face challenges due to limited funding that prioritizes more attractive species. DNA metabarcoding shows promise for mushroom identification and conservation, but high throughput sequencing methods remain in early stages. Overall, mushrooms have great potential but more work is needed to develop conservation technologies for these medicinal species.
The document summarizes the amino acid industry, focusing on production of glutamic acid (MSG), lysine, and threonine through microbial fermentation. It describes how researchers isolated bacteria like Corynebacterium glutamicum that overproduce these amino acids. Large-scale fermentation processes now annually produce over 1 million metric tons of MSG and 600,000 metric tons of lysine. The amino acids have various uses including as flavor enhancers, animal feed supplements, and in pharmaceuticals.
This document summarizes microbial production of various solvents like ethanol, acetone, butanol, and glycerol. It describes the common uses of solvents and details the processes of ethanol production through both petrochemical and biological fermentation methods. The biological fermentation process involves steps like saccharification, liquefaction, milling, fermentation, and distillation. It also discusses the advantages of using bacteria like Z. mobilis and C. ljungdahlii over yeast for ethanol production, as well as the production methods for acetone, butanol, and glycerol.
world production of edible mushrooms and edible mushrooms of pakistanJannat Iftikhar
This document provides information about world production of edible mushrooms and edible mushrooms of Pakistan. It discusses that mushrooms have been consumed for thousands of years and commercial production began in the late 19th century. It notes that China is the largest producer, followed by the US and European countries. It also summarizes mushroom production, trade, consumption and major producing countries globally. For Pakistan, it outlines 56 edible mushroom species found in various regions and notes oyster, white and phoenix mushrooms have the best quality. It concludes with references used in the document.
Fermentation of bakery products involves yeast converting carbohydrates into carbon dioxide, alcohol, and other compounds. This causes dough to rise and develops flavors. During baking, the alcohol evaporates while other volatile compounds contribute taste. Optimal fermentation softens dough for handling, improves gas retention, and yields a soft texture with fermented flavors in the final product. Key factors that influence fermentation are time, temperature, water content, sugar and salt levels, and dough pH.
Response of major grain legumes to inoculation with rhizobia and application ...IFPRIMaSSP
Soybean plays roles in reducing soil erosion, in biological nitrogen fixation, in pests and disease management and is also an important source of plant proteins. However production remains low in Malawi because of several factors, including the limited use or non-use of rhizobial inoculants and phosphorus fertilizers. Studies were conducted in 2011/12 and 2012/13 growing seasons in central Malawi to test the response of soybean to inoculation with biofix and soil amendments with phosphorus (P) fertilizer. The research used two approaches of research designed-research managed (RDRM) and research designed-farmer managed (RDFM) on-farm trials. The RDRM trials were laid in split plots replicated three times whereas RDFM trials were laid out on randomly selected farmers’ plots and field book was used to capture data. Analysis of variance was performed using Genstat (16th Edition) and Micro Soft excel. Results showed that inoculation significantly increased biomass yield, grain yield and nodulation. P-fertilizer did not have significant impact on grain yield. The yield in RDFM trials were generally lower than RDRM. The implications of the findings in smallholder farming systems in Malawi are discussed.
Biotin is a B vitamin that acts as a coenzyme in carbohydrate, protein, and lipid metabolism. It is essential for cell growth and DNA/RNA replication. Biotin deficiency can cause dermatitis, hair loss, and neuromuscular dysfunction with symptoms like scaly skin, rash, hypotonia, and depression. Good dietary sources of biotin include eggs, organ meats, nuts, dairy, and whole grains.
biobutanol is an advanced biofuel, it has better properties than ethanol and gasoline .it can be transported via existing pipelines and can be used in current engines. ethanol plants can be easily converted to biobutanol plants.
Microbial biomass in soil, measurement by chloroform fumigation incubation method, limits of measurement of microbial biomass, why microbes are important in the soil, why microbial biomass is important in the soil
The document discusses lead, its sources and toxicity. It describes various methods of bioremediating lead contamination including biosorption by bacterial cell surfaces, precipitation of insoluble lead complexes, rhizofiltration using plant roots, bioaccumulation inside microbial cells, and the use of fish bones. It also discusses the pbr lead resistance operon in Cupriavidus metallidurans bacteria that encodes proteins for lead transport and detoxification. An Indian study showed Pseudomonas fluorescence was able to remove up to 94.32% of lead from industrial effluents.
This document summarizes a study on the advanced oxidation of phenolic compounds using ultraviolet (UV) radiation and hydrogen peroxide (H2O2). The study investigated the degradation of phenol in a batch photolytic reactor with a UV lamp. It examined the effects of H2O2 dosage, initial phenol concentration, H2O2/phenol ratio, pH, and temperature on phenol degradation. Optimal conditions included a H2O2/phenol ratio of 100-250. Reaction products included hydroquinones, benzoquinones, and aliphatic carboxylic acids. A kinetic model was developed to predict phenol oxidation kinetics and product distribution.
This document reports on a trial of ozonation treatment for effluent from a Dipyridamole manufacturing process. Key findings:
1. Ozonation for 1 hour reduced COD by 91% and further treatment for 1.45 hours reduced COD by 98.6%, transforming dark effluent to crystal clear.
2. Other parameters like turbidity and TSS were reduced to almost zero after 1.45 hours of ozonation.
3. Ozonation is an effective treatment that significantly reduced contaminants in Dipy effluent and produced water that could be reused on-site.
This document describes the preparation of p-bromoaniline from acetanilide. It involves a two step process:
1. Bromination of acetanilide using potassium bromate and potassium bromide in the presence of tartaric acid yields p-bromoacetanilide as the major product.
2. Hydrolysis of p-bromoacetanilide using hydrochloric acid and heat produces p-bromoaniline. The product is isolated by adjusting the pH to basic and cooling.
Yields, melting points and reactions are calculated and mechanisms are provided for both steps. Chemical tests to identify the products are also outlined.
Heat stabilizer for copper and other metal mono phthalocyanines as well as fo...Benjamin Lukas
Simple method for preparation of heat stabilizer for copper phthalocyanine pigments for colouration of plastic and rubber is described. The method can be used for heat stabilizer for other mono metal phthalocyanine used in industry as well as for other pigments such as quinocridones.
This presentation discusses sludge treatment methods. It will cover the final products in sludge digesters, which are digested sludge, supernatant liquor, and decomposition gases. It will also discuss the stages of sludge digestion including acid fermentation, acid regression, and alkaline fermentation. Finally, it will cover the key factors that affect sludge digestion, such as temperature, pH, seeding, and mixing, and how to control these factors.
Permanganate titration by krishna baokarkrishnabaokar
This document discusses potassium permanganate titration. It begins by outlining the key learning objectives, which include understanding why potassium permanganate is not used as a primary standard and how to prepare and standardize it. It then explains that permanganate behaves differently in acidic, neutral, and basic conditions when used as an oxidizing agent. The document also notes some disadvantages of using permanganate solutions and provides guidance on proper preparation, storage, and applications for titrating various analytes like ferrous ions, nitrites, and hydrogen peroxide.
This document provides information about coumarins and related compounds. It discusses the classification of coumarins, including simple coumarins, furocoumarins, pyranocoumarins, and benzocoumarins. It also provides details about psoralen, including its biological source, structure, isolation, identification tests, uses, synthesis, and biological actions. Finally, it mentions xanthotoxin, which is extracted from Ammi majus, and discusses its extraction, purification, testing methods, synthesis, and properties/uses.
Weiber's Multi function reactor is an ideal instrument for performing multiple functions as ascertaining Chemical
Oxygen Demand, i.e. COD and TP / TN. COD is necessary to ascertain the oxygen requirement of waste water prior to its release into the environment, so that it can be monitored and controlled to avoid harmful effects on the nature, human beings, etc.
This document describes the synthesis of adipic acid from cyclohexanone via a nitric acid oxidation reaction. The reaction is exothermic and the nitric acid must be added slowly to cyclohexanone. Once complete, the product crystallizes and is washed and dried. The percent yield was 62.33% and melting point was 148-151°C, slightly lower than literature due to residual solvent. Infrared spectroscopy confirmed the product was adipic acid. Safety precautions are described for handling oxidizing and acidic reagents.
Made in Millersville: Internship at Glatfelter's Corporate Analytical ServicesGloria Chung
This is my poster presentation for the 2017 Made in Millersville Conference at Millersville University. I had the opportunity to share my internship experience at Glatfelter's Corporate Analytical Services to the faculty, staff, administration, and students at Millersville, as well as get reviewed by professionals on my presentation.
This document summarizes the coatings and products offered by Ecopol Tech SL, a technology company that specializes in environmentally friendly polymers. They develop nanostructured polymers for coatings, adhesives, and encapsulated active ingredients. Their product lines include (1) hydrophobic and oleophobic coatings based on water-based polyurethane and fluoropolymer nano-dispersions, (2) textile coatings, and (3) hot melt adhesives. They also produce microcapsules and nanocapsules for phase change materials, fragrances, antibacterials, and cosmetic actives. Ecopol Tech provides R&D, manufacturing, consulting and develops specialty polymers through contract
Application for ceramic filter and reverse osmosis membrane for produced wate...sunilkumarvss395
Ceramic filters and reverse osmosis membranes are both commonly used in the treatment of produced water in oil and gas operations.
1. **Ceramic Filters:**
- **Application:** Ceramic filters are often used as a pre-treatment step for produced water. They can remove suspended solids, oil, and some organic compounds. Ceramic filters are particularly effective in handling high temperatures and harsh chemicals commonly found in produced water.
- **Benefits:** They offer high chemical and thermal resistance, low operating costs, and can operate in harsh conditions without degradation. They are also relatively easy to maintain and have a long lifespan.
2. **Reverse Osmosis (RO) Membranes:**
- **Application:** RO membranes are typically employed for further treatment of produced water after pre-treatment with ceramic filters. They are effective in removing dissolved solids, salts, and other contaminants, producing high-quality water suitable for reuse or discharge.
- **Benefits:** RO membranes offer high removal efficiencies for dissolved solids, are capable of producing high-quality water, and are relatively compact compared to other treatment methods. However, they require careful monitoring and maintenance to prevent fouling and scaling.
**Combined Application:**
- Using ceramic filters as a pre-treatment step can help protect RO membranes by removing larger particles and reducing fouling potential, thereby extending the lifespan and efficiency of the RO system.
- Together, ceramic filters and RO membranes can effectively treat produced water to meet regulatory standards for discharge or reuse, contributing to environmental sustainability and operational efficiency in oil and gas operations.
The document discusses various methods for removing nitrogen from wastewater, including biological, chemical, and physicochemical approaches. Biologically, nitrification and denitrification can convert nitrogenous wastes to nitrogen gas. Chemically, methods like breakpoint chlorination and struvite precipitation are used. Physicochemically, ammonia stripping releases nitrogen gas from wastewater. The preferred approach is nitrogen removal via nitrification and denitrification during secondary wastewater treatment using activated sludge or other suspended growth systems.
This document summarizes research on removing tannic acid from water using different sorbents. It describes 5 sorbent materials tested - activated carbon, polymeric resin WJN-09, polyaniline, chitosan-coated attapulgite, and surfactant-modified zeolite. For each sorbent, it provides details on material properties and synthesis methods. It analyzes the sorption capacity, kinetics, isotherms and effects of variables like pH, temperature and concentration for each sorbent. Based on the results, activated carbon is recommended for tannic acid removal from water due to its high sorption capacity of 416.67 mg/g. Polymeric resin WJ
This project report summarizes the student's research on biodegrading polycyclic aromatic hydrocarbons (PAHs) using fungi. The objectives were to isolate PAH-degrading fungi from contaminated soil, test their ability to degrade naphthalene, acenaphthene, and anthracene, and analyze degradation qualitatively. Methods included collecting soil, isolating fungi, identifying isolates, screening degradation in solid and liquid media, and measuring a redox indicator to quantify degradation. Several fungi were isolated including Aspergillus niger and Absidia sp. that will be tested for their ability to degrade various PAHs.
This project report discusses the biodegradation of polycyclic aromatic hydrocarbons (PAHs) by fungi. Eight fungal isolates were obtained from contaminated soil samples, including Fusarium sp., Rhizopus sp., Absidia sp., and Aspergillus versicolor. Secondary screening in broth found that Fusarium sp., Rhizopus sp., and Trichoderma harzianum best degraded naphthalene at rates of 34.5%, 20.17%, and 35.68%, respectively. Fusarium sp. and Aspergillus sp. degraded acenaphthene the most at 58.04% and 55.96%. For anthracene, Fusarium sp
This project report summarizes the biodegradation of polycyclic aromatic hydrocarbons (PAHs) by fungi. [1] Eight fungal isolates were obtained from contaminated soil samples that could degrade PAHs like naphthalene, acenaphthene, and anthracene. [2] Screening experiments found that Fusarium sp., Rhizopus sp., Trichoderma harzianum, and Aspergillus versicolor exhibited the strongest biodegradation potential based on methylene blue reduction and fungal biomass production. [3] Specifically, Fusarium sp. and Rhizopus sp. effectively degraded all three PAH compounds.
This PPT will help you cover the complete topic of PHOTOSYNTHESIS IN DETAIL.
covers everything from introduction to all the cycle ..
For detailed explanation watch the video on my youtube channel- BOTANY INSIDER https://www.youtube.com/watch?v=VISyatjK5Gk&list=PLLIvWvpvrjO-oFMVYmvxfvkMEBQeBgCQb
Leveraging Generative AI to Drive Nonprofit InnovationTechSoup
In this webinar, participants learned how to utilize Generative AI to streamline operations and elevate member engagement. Amazon Web Service experts provided a customer specific use cases and dived into low/no-code tools that are quick and easy to deploy through Amazon Web Service (AWS.)
Andreas Schleicher presents PISA 2022 Volume III - Creative Thinking - 18 Jun...EduSkills OECD
Andreas Schleicher, Director of Education and Skills at the OECD presents at the launch of PISA 2022 Volume III - Creative Minds, Creative Schools on 18 June 2024.
How to Download & Install Module From the Odoo App Store in Odoo 17Celine George
Custom modules offer the flexibility to extend Odoo's capabilities, address unique requirements, and optimize workflows to align seamlessly with your organization's processes. By leveraging custom modules, businesses can unlock greater efficiency, productivity, and innovation, empowering them to stay competitive in today's dynamic market landscape. In this tutorial, we'll guide you step by step on how to easily download and install modules from the Odoo App Store.
Philippine Edukasyong Pantahanan at Pangkabuhayan (EPP) CurriculumMJDuyan
(𝐓𝐋𝐄 𝟏𝟎𝟎) (𝐋𝐞𝐬𝐬𝐨𝐧 𝟏)-𝐏𝐫𝐞𝐥𝐢𝐦𝐬
𝐃𝐢𝐬𝐜𝐮𝐬𝐬 𝐭𝐡𝐞 𝐄𝐏𝐏 𝐂𝐮𝐫𝐫𝐢𝐜𝐮𝐥𝐮𝐦 𝐢𝐧 𝐭𝐡𝐞 𝐏𝐡𝐢𝐥𝐢𝐩𝐩𝐢𝐧𝐞𝐬:
- Understand the goals and objectives of the Edukasyong Pantahanan at Pangkabuhayan (EPP) curriculum, recognizing its importance in fostering practical life skills and values among students. Students will also be able to identify the key components and subjects covered, such as agriculture, home economics, industrial arts, and information and communication technology.
𝐄𝐱𝐩𝐥𝐚𝐢𝐧 𝐭𝐡𝐞 𝐍𝐚𝐭𝐮𝐫𝐞 𝐚𝐧𝐝 𝐒𝐜𝐨𝐩𝐞 𝐨𝐟 𝐚𝐧 𝐄𝐧𝐭𝐫𝐞𝐩𝐫𝐞𝐧𝐞𝐮𝐫:
-Define entrepreneurship, distinguishing it from general business activities by emphasizing its focus on innovation, risk-taking, and value creation. Students will describe the characteristics and traits of successful entrepreneurs, including their roles and responsibilities, and discuss the broader economic and social impacts of entrepreneurial activities on both local and global scales.
This presentation was provided by Racquel Jemison, Ph.D., Christina MacLaughlin, Ph.D., and Paulomi Majumder. Ph.D., all of the American Chemical Society, for the second session of NISO's 2024 Training Series "DEIA in the Scholarly Landscape." Session Two: 'Expanding Pathways to Publishing Careers,' was held June 13, 2024.
This presentation was provided by Rebecca Benner, Ph.D., of the American Society of Anesthesiologists, for the second session of NISO's 2024 Training Series "DEIA in the Scholarly Landscape." Session Two: 'Expanding Pathways to Publishing Careers,' was held June 13, 2024.
Gender and Mental Health - Counselling and Family Therapy Applications and In...PsychoTech Services
A proprietary approach developed by bringing together the best of learning theories from Psychology, design principles from the world of visualization, and pedagogical methods from over a decade of training experience, that enables you to: Learn better, faster!
5. PRODUCTION
1
CUMENE
PROCESS
•ACETONE+PHENOL FROM
PROPYLENE +BENZENE
•HOCK’S PROCESS
•TO CUMENE BY H3PO4
•OXIDIZED TO CUMENE
HYDRO- PEROXIDE
RADICAL
•CLEAVED TO PRODUCTS
2
FROM
ISOPROPANO
L
•ISOPROPANOL FEED IN
AZEOTROPIC MIX WITH
WATER
•DEHYDROGENATED TO
ACETONE.
•15000 METRIC TONNES
PER YEAR
•TEMP-350 C
•CONVERSION = 90%
•EXIT PRESSURE=1.9 BAR
•ENDOTHERMIC AND
HEAT PROVIDED BY
MOLTEN SALT.
3
OTHER
METHODS
•DRY DISTILLATION OF
ACETATES.(OLD)
•WACKER HOECHST
PROCESS
(OXIDATION OF
PROPYLENE)
7. FROM
ISOPROPANOL
FIRED HEATERABSORBER:
HEATS MOLTEN
SEPARATION VESSEL
SALT BY
ACETONE320C
REACTOR AT
FORHEATS FEED TO
VAPOR AND
BURNING
HEAT1.9 BAR
EXCHANGER:COOLS
, 235c . PUMP
RECOVERED BY
NATURAL GAS.REACTOR
LIQUID
, CONDENSES
90% CONVERSION
360WATER BAR, 50
c PROVIDED TO
TO 410 1.6
EFFLUENTS, c
EFFLUENTS.FLASH
ATTAIN REQD
C=1.56 J/g K WATER OR
c, COOLING
PRESSURE
OPERATION WATER
REFRIGERATION
HEAT
EXCHANGER
DISTILLATION
COLUMN
9. SOL
PRODU COSME LABOR MISCELLA
VEN
CTION
TICS
ATORY
NEOUS
T
SOLVENT FOR
METHYL USED IN AS A SOLVENT
NAIL MEDICAL
PLASTICS AND
METHACRYLATE REMOVERS
POLISH
APPLICATIONS
SYNTHETIC FIBERS.
AND IN CHEMICAL
EQUIPMENT
BISPHENOL-A
PEELS. CLEANER FOOD ADDITIVES
IN
PAINTS, FIBERGLASS,A
DHESIVES, VARNISHES
OTHER SOLVENTS SKIN LOOSENING RUSTED
REMOVE
ETC
GLUES ON WIGS STUCK BOLTS
OR
AND FAKE
DEGREASER AND MOUSTACHE.
DECLEANER
10. PRODUCTION
CAPACITY
6.7 MILLION TONNES
USA –HIGHEST
PRODUCTION
CAPACITY
FOLLOWED BY
CHINA AND JAPAN
PRODUCTION
INEOS PHENOLLARGEST PRODUCER
FOLLOWED BY
MITSUI, SUNOCO, SH
ELL
PRICE
1100 -1250 USD/
TONNE
Editor's Notes
Frames with faded pictures and text(Intermediate)To reproduce the picture effects on this slide, do the following:On the Home tab, in theSlides group, click Layout, and then click Blank.On the Insert tab, in the Illustrations group, click Picture. In the Insert Picture dialog box, select a picture and then click Insert. Select the picture. Under Picture Tools, on the Format tab, in the bottom right corner of the Size group, click the Size and Position dialog box launcher.In the Size and Position dialog box, on the Size tab, resize or crop the picture as needed so that under Size and rotate, the Height box is set to 3” and the Width box is set to 3”. Resize the picture under Size and rotate by entering values into the Height and Width boxes. Crop the picture under Crop from by entering values into the Left, Right, Top, and Bottom boxes. Repeat steps 2-4 to insert, resize, and crop another picture so that in the Size and Position dialog box, on the Size tab, under Size and rotate, the Height box is set to 3” and the Width box is set to 3”. Press and hold SHIFT and select both pictures. On the Home tab, in the bottom right corner of the Drawing group, click the Format Shape dialog box launcher. In the Format Picture dialog box, click Picture in the left pane, and then do the following in the right pane:Click the button next to Recolor, and then under Color Modes click Grayscale (first option from the left). In the Brightness box, enter 55%.In the Contrast box, enter -70%. Select both pictures. On the Home tab, in the Clipboard group, click the arrow under Paste, and then click Duplicate. Select the two duplicate pictures. Under Picture Tools, on the Format tab, in the Picture Styles group, click Picture Shape, and then under Basic Shapes click Frame (second row, fourth option from the left). On the slide, select one frame and drag the yellow diamond adjustment handle to increase or decrease frame width. Repeat this step on the other frame.Press and hold SHIFT and select both frames. On the Home tab, in the bottom right corner of the Drawing group, click the Format Shape dialog box launcher. In the Format Picture dialog box, click Picture in the left pane. In the right pane, click the button next to Recolor, and then under No Recolor,click No Recolor. Also in the Format Shape dialog box, click 3-D Formatin the left pane, and then do the following in the right pane under Bevel:Click the button next to Top, and then under Bevel click Circle (first row, first option from the left).Next to Top, in the Width box, enter 6 pt. Next to Top, in the Height box, enter 6 pt. Also in the Format Shape dialog box, click Shadow in the left pane, and then do the following in the right pane:Click the button next to Presets, and then under Outer click Offset Bottom (first row, second option from the left).In the Blur box, enter 30 pt. In the Distance box, enter 18 pt. Press and hold SHIFT and select one of the frames and the corresponding grayscale picture. On the Home tab, in the Drawing group, click Arrange, and then do the following to position the frame directly on top of the grayscale picture:Point to Align, and then click Align Selected Objects.Point to Align, and then click Align Center.Point to Align, and then clickAlign Middle. Click Group. Repeat step 14 with the other frame and corresponding grayscale picture. Select each group and drag them so they are next to each other at the desired position on the slide.Press and hold SHIFT and select both groups. On the Home tab, in the Drawing group, click Arrange, point to Align, and then click Align Middle. To reproduce the text effects on this slide, do the following:On the Insert tab, in the Text group, click Text Box, and then on the slide, drag to draw the text box.Enter text in the text box, select the text, and then on the Home tab, in the Font group, select Franklin Gothic Medium Condfrom the Font list and then enter 30 in the Font Size box.On the Home tab, in the Paragraph group, click Center to center the text on the slide.Under Drawing Tools, on the Format tab, in the WordArt Styles group, click the arrow next toText Fill, and then under Theme Colors click White, Background 1, Darker 50% (sixth row, first option from the left).On the slide, drag the text box to position it inside one of the frames.Repeat steps 1-5 to createtext for the other frame. To reproduce the horizontal line effects on this slide, do the following:On the Home tab, in the Drawing group, click Shapes, and then under Lines click Line (first option from the left).Press and hold SHIFT, and then on the slide, drag to draw a straight, horizontal line. Select the line. Under Drawing Tools, on the Format tab, in the Size group, in the Shape Width box, enter 10”.On the Home tab, in the bottom right corner of the Drawing group, click the Format Shape dialog box launcher. In the Format Shape dialog box, click Line Color in the left pane, and then do the following in the right pane:Select Solid line.Click the button next to Color, and then under Theme Colors click White, Background 1, Darker 35% (fifth row, first option from the left).Also in the Format Shape dialog box, click Line Style in the left pane, and then in the right pane, in the Width box, enter 0.75 pt.On the Home tab, in the Clipboard group, click the arrow under Paste, and then click Duplicate. Press and hold SHIFT and select both lines on the slide.On the Home tab, in the Drawing group, click Arrange, and then click Send to Back. Drag both lines so that they are positioned behind the pictures and frames. On the Home tab, in the Drawing group, click Arrange, point to Align,and then do the following:Click Align to Slide.Click Align Center.To reproduce the background on this slide, do the following:On the Design tab, in the Background group, click the arrow next to BackgroundStyles, and click Style 5 (second row, first option from the left). (Note: If this action is taken in a PowerPoint presentation containing more than one slide, the background style will be applied to all of the slides.)
Rounded corner rectangle tabs with inset pictures(Advanced)To reproduce the top rectangle (olive-green, “label one”) with text effects on this slide, do the following:On the Home tab, in theSlides group, click Layout, and then click Blank.On the Home tab, in the Drawing group, click Shapes, and then under Rectangles, click Rounded Diagonal Corner Rectangle(ninth option from the left). On the slide, drag to draw a rectangle.On the Home tab, in the bottom right corner of the Drawing group, click the Format Shape dialog box launcher. In the Format Shape dialog box, click Fill in the left pane, select Gradient fill in the right pane, and then do the following:In the Type list, select Linear.Click the button next to Direction, and then click Linear Down (first row, second option from the left).Under Gradient stops, click Add or Remove until two stops appear in the drop-down list.Also under Gradient stops, customize the gradient stops that you added as follows:Select Stop 1 from the list, and then do the following:In the Stop position box, enter32%.Click the button next to Color, and then under Theme Colorsclick White, Background 1 (first row, first option from the left).Select Stop 2 from the list, and then do the following:In the Stop position box, enter100%.Click the button next to Color, and then under Theme Colorsclick Olive Green, Accent 3, Lighter 60%(third row, seventh option from the left).Also in the Format Shape dialog box, click Line Color in the left pane, select Gradient line in the right pane, and then do the following:In the Type list, select Linear.Click the button next to Direction, and then click Linear Up (second row, second option from the left). Under Gradient stops, click Add or Remove until two stops appear in the drop-down list.Also under Gradient stops, customize the gradient stops that you added as follows:Select Stop 1 from the list, and then do the following:In the Stop position box, enter0%.Click the button next to Color, and then under Theme Colorsclick White, Background 1 (first row, first option from the left).Select Stop 2 from the list, and then do the following:In the Stop position box, enter100%.Click the button next to Color, and then under Theme Colorsclick White, Background 1, Darker 25%(fourth row, first option from the left).Also in the Format Shape dialog box, click Line Style in the left pane. In the Line Style pane, in the Width box, enter 1 pt. On the Home tab, in the Drawing group, click Shape Effects, point to Glow, and then do the following:Under Glow Variations, select any option in the first row (5 pt glow options). Point to More Glow Colors, and then under Theme Colors click White, Background 1, Darker 25% (fourth row, first option from the left). On the slide, right-click the rectangle and then click Edit Text. Enter text in the text box and select the text. On the Home tab, in the Font group, select Gill Sans MTfrom the Font list and then select 24 from the Font Size list.On the Home tab, in the Paragraph group, click Align Text Left to align the text left within the rectangle.Under Drawing Tools, on the Format tab, in the WordArt Styles group, click the arrow next toText Fill, click More Fill Colors, and then in the Colors dialog box, on the Custom tab, enter values for Red: 127, Green: 127, and Blue: 127.Select the rectangle. On the Home tab, in the bottom-right corner of the Drawing group, click the Format Shapes dialog box launcher. In the Format Shapes dialog box, click Text Box in the left pane. In the right pane, under Internal margin, enter 1” in the Left box to increase the left margin in the rectangle to accommodate the embossed picture. Under Drawing Tools, on the Format tab, in the Size group, do the following:In the Shape Height box, enter 0.92”.In the Shape Width box, enter 4.5”.To reproduce the olive-green embossed picture for the top rectangle on this slide, do the following:On the Home tab, in the Drawing group, click Shapes, and then under Rectangles, click Rounded Diagonal Corner Rectangle(ninth option from the left). On the slide, drag to draw a rectangle.On the Home tab, in the bottom right corner of the Drawing group, click the Format Shape dialog box launcher. In the Format Shape dialog box, click Fill in the left pane, select Picture or texture fill, and then under Insert from click File. In the Insert Picture dialog box, select a picture and then click Insert. Also in the Format Shape dialog box, click Line Color in the left pane. In the Line Color pane, select No line. Also in the Format Shape dialog box, click Picture in the left pane, click the button next to Recolor, and then under Light Variations click Accent color 3 Light (fourth option from the left).Also in the Format Shape dialog box, click Shadow in the left pane, and then do the following in the right pane:Click the button next to Preset, and then under Inner click Inside Diagonal Top Left (first row, first option from the left).In the Transparency box, enter 65%. Under Picture Tools, on the Format tab, in the bottom right corner of the Size group, click the Size and Position dialog box launcher. In the Size and Position dialog box, on the Size tab, do the following:UnderScale, select the Lock aspect ratio check box.Under Size and rotate, in the Height box, enter 0.75”. (Under Size and rotate, in the Width box, 0.75” will appear automatically.)Drag the picture onto the left side of the rectangle. Press and hold CTRL and select the picture and the rectangle. On the Home tab, in the Drawing group, click Arrange, point to Align, and then click Align Middle. To reproduce the other shapes on this slide, do the following:Press and hold CTRL and select the picture and the rectangle.On the Home tab, in the Drawing group, click Arrange, and then click Group.On the Home tab, in the Clipboard group, click the arrow under Paste, and then click Duplicate. Repeat the process until there is a total of four groups of shapes.Drag the groups so that they are distributed vertically on the slide. Press and hold CTRL and select all four groups.On the Home tab, in the Drawing group, click Arrange, and then do the following:Point to Align, and then click Align Center. Point to Align, and then clickDistribute Vertically. Click Ungroup. To change the color and text for the duplicate rectangles (second, third, and fourth from the top), do the following:Select the rectangle that you would like to recolor.Under Drawing Tools, on the Format tab, in the Shape Styles group, click the arrow next toShape Fill, point to Gradient, and then click More Gradients.In the Format Shape dialog box, click Fill in the left pane, selectGradient fill in the right pane, and then do the following:For the second rectangle from the top, under Gradient stops, select Stop 2 from the drop-down list, click the button next to Color, and then under Theme Colors click Orange, Accent 6, Lighter 60% (third row, tenth option from the left). For the third rectangle from the top, under Gradient stops, select Stop 2 from the drop-down list, click the button next to Color, and then under Theme Colors click Aqua, Accent 5, Lighter 60% (third row, ninth option from the left).For the fourth rectangle from the top, under Gradient stops, select Stop 2 from the drop-down list, click the button next to Color, and then under Theme Colors click Blue, Accent 1, Lighter 60% (third row, fifth option from the left).To change the text on the duplicate rectangles, click in each text box and edit the text. To change the picture on the duplicate rectangles (second, third, and fourth from the top), do the following:Right-click the second picture from the top, and then click Format Picture. In the Format Picture dialog box, click Fill in the left pane, and then underInsert from click File. In the Insert Picture dialog box, select a picture, and then click Insert.Repeat the process for the third and fourth rectangles from the top. To change the color for the duplicate pictures (second, third, and fourth from the top), do the following:Select the picture that you would like to recolor.Under Picture Tools, on the Format tab, in the Adjust group, click the arrow next toRecolor, and then do the following:For the second picture from the top, under Light Variations, clickAccent color 6 Light (seventh option from the left).For the third picture from the top, under Light Variations, clickAccent color 5 Light (sixth option from the left).For the fourth picture from the top, under Light Variations, clickAccent color 1 Light (second option from the left).To reproduce the background on this slide, do the following:Right-click the slide background area, and then clickFormat Background.In the Format Background dialog box, click Fill in the left pane, select Gradient fill in the right pane, and then do the following:In the Type list, select Radial.Click the button next to Direction, and then click From Center (third option from the left).Under Gradient stops, click Add or Remove until two stops appear in the drop-down list.Also under Gradient stops, customize the gradient stops that you added as follows:Select Stop 1 from the list, and then do the following:In the Stop position box, enter0%.Click the button next to Color, and then under Theme Colorsclick White, Background 1 (first row, first option from the left).Select Stop 2 from the list, and then do the following:In the Stop position box, enter100%.Click the button next to Color, and then under Theme Colorsclick White, Background 1, Darker 15% (third row, first option from the left).
Picture with three text columns(Intermediate)To reproduce the picture effects on this slide, do the following:On the Home tab, in theSlides group, click Layout, and then click Blank.On the Insert tab, in the Illustrations group, click Picture. In the Insert Picture dialog box, select a picture and then click Insert. Select the picture. Under Picture Tools, on the Format tab, in the bottom right corner of the Size group, click the Size and Position dialog box launcher.In the Size and Position dialog box, on the Size tab, resize or crop the picture as needed so that under Size and rotate, the Height box is set to 1.48” and the Width box is set to 9.17”. Resize the picture under Size and rotate by entering values into the Height and Width boxes. Crop the picture under Crop from by entering values into the Left, Right, Top, and Bottom boxes. On the Home tab, in the bottom right corner of the Drawing group, click the Format Shape dialog box launcher. In the Format Shape dialog box, click Line Color in the left pane, select Gradient line in the right pane, and then do the following:In the Type list, select Linear. Click the button next to Direction, and then click Linear Up (second row, second option from the left). Under Gradient stops, click Add or Remove until two stops appear in the drop-down list.Also under Gradient stops, customize the gradient stops that you added as follows:Select Stop 1 from the list, and then do the following:In the Stop position box, enter0%.Click the button next to Color, and then under Theme Colorsclick White, Background 1(first row, first option from the left).Select Stop 2 from the list, and then do the following:In the Stop position box, enter100%.Click the button next to Color, and then under Theme Colorsclick White, Background 1, Darker 25%(fourth row, first option from the left).Also in the Format Shape dialog box, click Line Style in the left pane, and then in the right pane, in the Width box, enter 1 pt. On the Home tab, in the Drawing group, click Shape Effects, point to Glow,and then do the following:Under Glow Variations,select any option in the first row (5 pt glow options).Point to More Glow Colors, and then under Theme Colors click White, Background 1, Darker 25% (fourth row, first option from the left).On the Home tab, in theDrawing group, click Arrange, point to Align, and then click Align Center.To reproduce the first column heading on this slide, do the following:On the Home tab, in the Drawing group, click Shapes, and then under Rectangles, click Rectangle (first option from the left). On the slide, drag to draw a rectangle.Under Drawing Tools, on the Format tab, in the Size group, do the following:In the Shape Height box, enter 1”.In the Shape Width box, enter 2.92”.On the Home tab, in the bottom right corner of the Drawing group, click the Format Shape dialog box launcher. In the Format Shape dialog box, click Fill in the left pane, select Gradient fill in the right pane, and then do the following:In the Type list, select Linear.Click the button next to Direction, and then click Linear Down (first row, second option from the left).Under Gradient stops, click Add or Remove until two stops appear in the drop-down list.Also under Gradient stops, customize the gradient stops that you added as follows:Select Stop 1 from the list, and then do the following:In the Stop position box, enter32%.Click the button next to Color, and then under Theme Colorsclick Tan, Background 2 (first row, third option from the left).Select Stop 2 from the list, and then do the following:In the Stop position box, enter100%.Click the button next to Color, and then under Theme Colorsclick Tan, Background 2, Darker 25%(third row, third option from the left).Also in the Format Shape dialog box, click Line Color in the left pane, select Gradient line in the Line Color pane, and then do the following:In the Type list, select Linear.Click the button next to Direction, and then click Linear Up (second row, second option from the left).Under Gradient stops, click Add or Remove until two stops appear in the drop-down list.Also under Gradient stops, customize the gradient stops that you added as follows:Select Stop 1 from the list, and then do the following:In the Stop position box, enter0%.Click the button next to Color, and then under Theme Colorsclick White, Background 1 (first row, first option from the left).Select Stop 2 from the list, and then do the following:In the Stop position box, enter100%.Click the button next to Color, and then under Theme Colorsclick White, Background 1, Darker 25% (fourth row, first option from the left).Also in the Format Shape dialog box, click Line Style in the left pane. In the right pane, in the Width box, enter 1 pt. On the Home tab, in the Drawing group, click Shape Effects, point to Glow, and then do the following:Under Glow Variations,select any option in the first row (5 pt glow options).Point to More Glow Colors, and then under Theme Colors click White, Background 1, Darker 25% (fourth row, first option from the left).On the slide, right-click the rectangle and then click Edit Text. Enter text in the text box and select the text. On the Home tab, in the Font group, select Gill Sans MTfrom the Font list and then select 24 from the Font Size list.On the Home tab, in the Paragraph group, click Align Text Left to align the text left within the text box.Under Drawing Tools, on the Format tab, in the WordArt Styles group, click the arrow next toText Fill, and then under Theme Colors click Tan, Background 2, Darker 75% (fifth row, third option from the left). On the Home tab, in the bottom-right corner of the Drawing group, click the Format Shapes dialog box launcher. In the Format Shapes dialog box, click Text Box in the left pane. In the right pane, under Internal margin, enter 1” in the Left box to increase the left margin in the rectangle to accommodate the embossed number. On the Home tab, in the Drawing group, click Shapes, and then under Lines, click Line (first option from the left).Press and hold SHIFT, and then on the slide, drag to draw a straight, vertical line. Under Drawing Tools, on the Format tab, in the Size group, in the Width box, enter 0.75”.On the Home tab, in the bottom-right corner of the Drawing group, click the Format Shapes dialog box launcher. In the Format Shapes dialog box, click Line Style in the left pane, and then do the following in the right pane:In the Width box, enter 2.25 pt.Click the button next to Dash type, and then click Round Dot (second option from the top). Also in the Format Shapes dialog box, click Line Color in the left pane. In the right pane, click the button next to Color, and then under Theme Colors click White, Background 1 (first row, first option from the left). On the slide, drag the line onto the rectangle, just left of the text box. On the Insert tab, in the Text box, click Text Box and then on the slide, drag to draw another text box. Enter 1 in the text box and select the text. On the Home tab, in the Font group, select Calisto MT from the Font list and then enter 50 in the Font Size box.On the Home tab, in the Paragraph group, click Center to center the text within the text box.Under Drawing Tools, on the Format tab, in the WordArt Styles group, click the arrow next toText Fill, and then under Theme Colors click Tan, Background 2, Darker 25% (third row, third option from the left). Drag the text box onto the rectangle, left of the dotted vertical line. On the Home tab, in the Editing group, click Select, and then click Selection Pane. In the Selectionand Visibility pane, press and hold CTRL to select the text box, line, and rectangle.On the Home tab, in the Drawing group, click Arrange, point to Align, and then click Align Middle. To reproduce the other column headings on this slide, do the following:On the Home tab, in the Editing group, click Select, and then click Selection Pane. In the Selectionand Visibility pane, press and hold CTRL to select the text box, line, and rectangle.On the Home tab, in the Drawing group, click Arrange, and then under Group Objects click Group.On the Home tab, in the Clipboard group, click the arrow under Paste, and then click Duplicate. Repeat the process until you have a total of three groups of shapes.Select each group in the Selection and Visibility pane and drag it on the slide to form a row under the picture. Also in the Selection and Visibility pane, press and hold CTRL and select all three groups.On the Home tab, in the Drawing group, click Arrange, point to Align,and then do the following:Click Align Middle. ClickDistribute Horizontally. To change the numbers in the duplicate text boxes (second and third from the left), click in each text box and edit the text. To reproduce the first column (the “subtext” portion) on this slide, do the following:On the Home tab, in the Drawing group, click Shapes, and then under Rectangles click Rectangle (first option from the left). On the slide, drag to draw the rectangle so that the top edge is just below the first column heading and the bottom edge is at the bottom of the slide. Under Drawing Tools, on the Format tab, in the Size group, in the Shape Width box, enter 2.92” so that the subtext column is the same width as the column heading above it. On the Home tab, in the Drawing group, click the arrow next toShape Outline, and then click No Outline.On the Home tab, in the bottom right corner of the Drawing group, click the Format Shape dialog box launcher. In the Format Shape dialog box, click Fill in the left pane, select Gradient fill in the right pane, and then do the following:In the Type list, select Linear.Click the button next to Direction, and then click Linear Down (first row, second option from the left).Under Gradient stops, click Add or Remove until three stops appear in the drop-down list.Also under Gradient stops, customize the gradient stops that you added as follows:Select Stop 1 from the list, and then do the following:In the Stop position box, enter0%.Click the button next to Color, and then under Theme Colorsclick White, Background 1 (first row, first option from the left).In the Transparency box, enter 100%. Select Stop 2 from the list, and then do the following:In the Stop position box, enter50%.Click the button next to Color, and then under Theme Colorsclick Tan, Background 2, Darker 25%(third row, third option from the left).In the Transparency box, enter 25%. Select Stop 3 from the list, and then do the following:In the Stop position box, enter100%.Click the button next to Color, and then under Theme Colorsclick White, Background 1(first row, first option from the left).In the Transparency box, enter 100%. On the slide, right-click the column and then click Edit Text. Enter text in the text box and select the text. On the Home tab, in the Font group, select Gill Sans MTfrom the Font list and then enter 22 in the Font Size box.On the Home tab, in the Paragraph group, click Center to center the text within the rectangle.Under Drawing Tools, on the Format tab, in the WordArt Styles group, click the arrow next toText Fill, and then under Theme Colors click White, Background 1, Darker 50% (sixth row, first option from the left). On the Home tab, in the bottom-right corner of the Drawing group, click the Format Shapes dialog box launcher. In the Format Shapes dialog box, click Text Box in the left pane. In the right pane, under Text layout, in the Vertical Alignment list, select Top. To reproduce the other columns (the “subtext” portion) on this slide, do the following:Select the first “subtext” rectangle. On the Home tab, in the Clipboard group, click the arrow under Paste, and then click Duplicate. Repeat the process until you have a total of three “subtext” rectangles.Drag each duplicate on the slide to form a row under the “text heading” rectangles. Press and hold SHIFT and select all three “subtext” rectangles. On the Home tab, in the Drawing group, click Arrange, point to Align, and then click Distribute Horizontally. To reproduce the background on this slide, do the following:Right-click the slide background area, and then clickFormat Background.In the Format Background dialog box, click Fill in the left pane, select Gradient fill in the right pane, and then do the following:In the Type list, select Radial.Click the button next to Direction, and then click From Center (third option from the left).Under Gradient stops, click Add or Remove until two stops appear in the drop-down list.Also under Gradient stops, customize the gradient stops that you added as follows:Select Stop 1 from the list, and then do the following:In the Stop position box, enter0%.Click the button next to Color, and then under Theme Colorsclick White, Background 1 (first row, first option from the left).Select Stop 2 from the list, and then do the following:In the Stop position box, enter100%.Click the button next to Color, and then under Theme Colorsclick Tan, Background 2(first row, third option from the left).
Timeline graphic with pictures(Intermediate)To reproduce the picture effects on this slide, do the following:On the Home tab, in theSlides group, click Layout, and then click Blank.On the Insert tab, in the Illustrations group, click Picture. In the Insert Picture dialog box, select a picture and then click Insert. Select the picture. Under Picture Tools, on the Format tab, in the bottom right corner of the Size group, click the Size and Position dialog box launcher.In the Size and Position dialog box, on the Size tab, resize or crop the picture as needed so that under Size and rotate, the Height box is set to 2.65” and the Width box is set to 9”. Resize the picture under Size and rotate by entering values into the Height and Width boxes. Crop the picture under Crop from by entering values into the Left, Right, Top, and Bottom boxes. Under Picture Tools, in the Format tab, in the Picture Styles group, click Picture Shape, and then under Rectangles click Round Same Side Corner Rectangle (eighth option from the left).Drag the top yellow diamond adjustment handle slightly to the right to decrease the amount of rounding on the corners. Under Picture Tools, in the Format tab, in the Picture Styles group, click Picture Effects, point to Shadow, and then under Inner click Inside Center (second row, second option from the left).To reproduce the timeline effects on this slide, do the following:On the Home tab, in the Drawing group, click Shapes, and then under Rectangles click Rectangle (first option from the left). On the slide, drag to draw a rectangle.Select the rectangle. Under Drawing Tools, on the Format tab, in the Size group, do the following:In the Shape Height box, enter 0.73”.In the Shape Width box, enter 9”.On the Home tab, in the bottom right corner of the Drawing group, click the Format Shape dialog box launcher. In the Format Shape dialog box, click Fill in the left pane, select Solid fill in the Fill pane, and then do the following:Click the button next to Color, and then under Theme Colors click Black, Text 1, Lighter 35%(third row, second option from the left).In the Transparency box, enter 20%.Also in the Format Shape dialog box, click Line Color in the left pane, and then in the right pane, select No line. Also in the Format Shape dialog box, click Shadow in the left pane. In the right pane, click the button next to Presets, and then under Inner click Inside Center (second row, second option from the left). Drag the rectangle onto the bottom of the picture. Press and hold SHIFT and select the rectangle and the picture. On the Home tab, in the Drawing group, click Arrange, point to Align, and then do the following: Click Align Selected Objects. Click Align Center.Click Align Top.Click Align to Slide.Click Align Center. To reproduce the month labels for the timeline, do the following:On the Insert tab, in the Text group, click Text Box, and then on the slide, drag to draw the text box.Enter text in the text box (in this example the text is “JAN”), select the text, and then on the Home tab, in the Font group, select Gil Sans MT Condensed from the Font list, select 18 from the Font Size list, click the arrow next to Font Color, and then under Theme Colors click White, Background 1, Darker 35% (fifth row, first option from the left).On the Home tab, in the Paragraph group, click Center to center the text in the text box. Select the text box. On the Home tab, in the Clipboard group, click the arrow under Paste, and then click Duplicate. Repeat the process until there is a total of six text boxes. On the slide, drag the text boxes onto the rectangle to form a timeline. On the Home tab, in the Editing group, click Select, and then click Selection Pane. In the Selection and Visibility pane, press and hold CTRL and select all six text boxes and the rectangle.On the Home tab, in the Drawing group, click Arrange, point to Align, and then do the following:Click Align Selected Objects.Click Align Middle. In the Selection and Visibility pane, press and hold CTRL and cancel the selection of the rectangle, keeping the text boxes selected. On the Home tab, in the Drawing group, click Arrange, point to Align, and then do the following:Click Align to Slide.Click Distribute Horizontally. To change the text in the duplicate text boxes, click in each text box and edit the text.To change the color of the second text box from the left, select the text box, and then on the Home tab, in the Font group, click the arrow next to Font Color, and then under Theme Colors click White, Background 1 (first row, first option from the left). To reproduce the vertical line with text effects on this slide, do the following:On the Home tab, in the Drawing group, click Shapes, and then under Lines click Line (first option from the left).Press and hold SHIFT, and then drag on the slide to draw a straight, vertical line. Select the line. Under Drawing Tools, on the Format tab, in the Size group, in the Shape Width box, enter 1.2”.On the Home tab, in the bottom right corner of the Drawing group, click the Format Shape dialog box launcher. In the Format Shape dialog box, click Line Color in the left pane, and then do the following in the right pane:Select Solid line.Click the button next to Color, and then under Theme Colors click White, Background 1, Darker 25% (fourth row, first option from the left).Also in the Format Shape dialog box, click Line Style in the left pane, and then do the following in the right pane:In the Width box, enter 0.75 pt.Under Arrow Settings, click the button next to Begin type, and then click Oval Arrow (second row, third option from the left).Click the button next to Begin size, and then click Arrow L Size 1 (first row, first option from the left).Click the button next to End type, and then enter Oval Arrow (second row, third option from the left).Click the button next to End size, and then enter Arrow R Size 1 (first row, first option from the left).On the Home tab, in the Clipboard group, click the arrow under Paste, and then click Duplicate. Select the duplicate line. Under Drawing Tools, on the Format tab, in the Size group, in the Shape Width box, enter 2.6”.Press and hold SHIFT and select both lines. On the Home tab, in the Drawing group, click Arrange, and then do the following:Point to Align, and then click Align Selected Objects.Point to Align, and then click Align Center.Drag both lines together on the slide to position them under one of the timeline month labels. Press and hold SHIFT and select both lines and the text box they are under. On the Home tab, in the Drawing group, click Arrange, and then do the following:Click Align Selected Objects.Click Align Center.On the Insert tab, in the Text group, click Text Box, and then on the slide, drag to draw the text box.Enter text in the text box, select the text, and then on the Home tab, in the Font group, select Gill Sans MT from the Font list, select 20 from the Font Size list, and then click the arrow next to Font Color and click White, Background 1 (first row, first option from the left).On the Home tab, in the Paragraph group, click Align Text Left to align the text left in the text box. On the slide, drag the text box to position it to the right of the vertical line. To reproduce the background on this slide, do the following:Right-click the slide background area, and then clickFormat Background.In the Format Background dialog box, click Fill in the left pane, select Gradient fill in the Fill pane, and then do the following:In the Type list, select Linear.Click the button next to Direction, and then clickLinear Down (first row, second option from the left).Under Gradient stops, click Add or Remove until two stops appear in the drop-down list.Also under Gradient stops, customize the gradient stops that you added as follows:Select Stop 1 from the list, and then do the following:In the Stop position box, enter50%.Click the button next to Color, and then under Theme Colorsclick Black, Text 1(first row, second option from the left).Select Stop 2 from the list, and then do the following:In the Stop position box, enter99%.Click the button next to Color, and then under Theme Colorsclick Black, Text 1, Lighter 35% (third row, second option from the left).