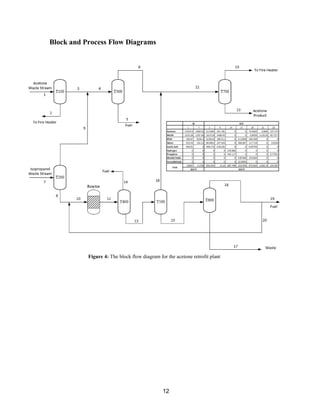
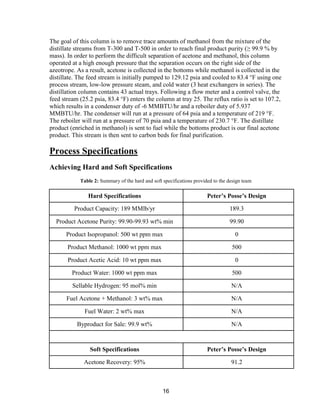
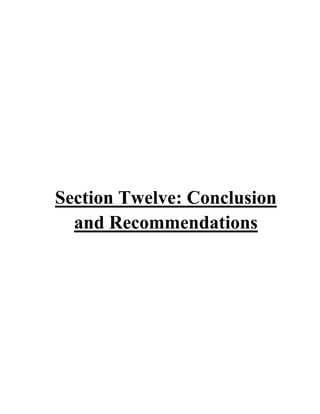
This process involves upgrading waste streams from an existing plant to produce 189 MMlb/yr of acetone product. Two waste streams containing acetone and isopropanol will be fed to a new plant and processed using distillation columns and a reactor. In the reactor, isopropanol is converted to acetone over a copper-alumina catalyst. The overall process involves 7 distillation columns and separation of reactants and products to achieve >99.9% pure acetone product. Building this plant is not recommended due to its high capital costs and lower economic attractiveness compared to other company projects. Selling the waste streams is the best option economically.


![8
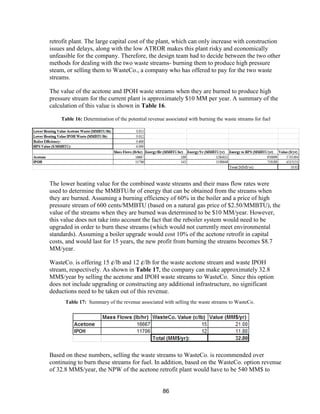
estimates that the current burning of these waste streams earns a profit of roughly $7.7
MM/yr.
WasteCo is currently offering our company 15 ¢/lb for the waste acetone stream and 12 ¢/lb
for the waste isopropanol streams. By considering the mass of each stream that we currently
produce in our process, our company estimates that selling these waste streams to WasteCo
would earn a profit of roughly $34.2 MM/yr. This is a greater profit than our company
currently makes by burning these streams and thus it should be considered as an alternative
practice.
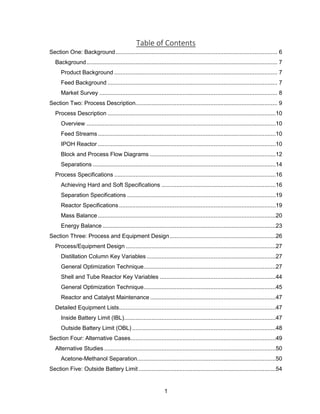
Market Survey
Market prices for truck acetone had shown
decreases throughout 2015. However, recent
increases to almost 40¢/lb have occurred due
to higher raw material costs such as refinery-
grade propylene (RGP). This serves as one of
the two raw materials used in the production
of cumene, the feedstock for phenol/acetone
production.
US spot export acetone prices have also seen a
recent increase in price per lb. The
strengthening of RGP values and increases in
US domestic acetone pricing have been
reflected in export pricing. In addition, US
acetone supply has been tightened due to
upcoming plant turnarounds and lack of recent
imports.
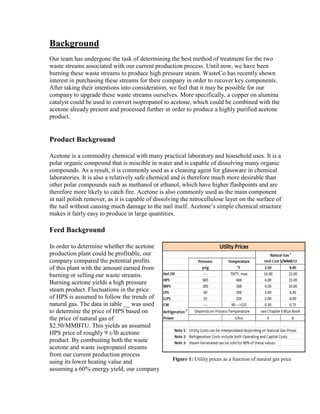
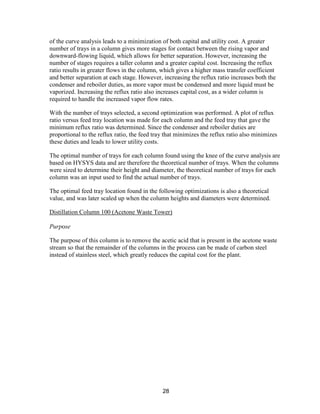
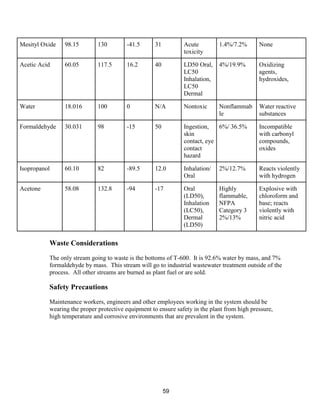
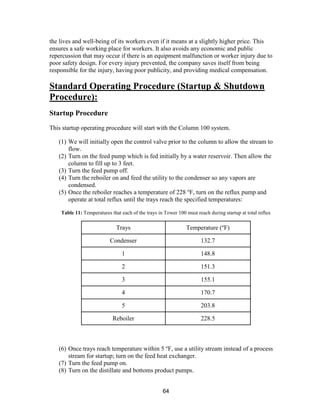
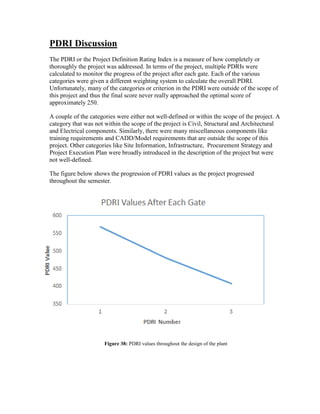
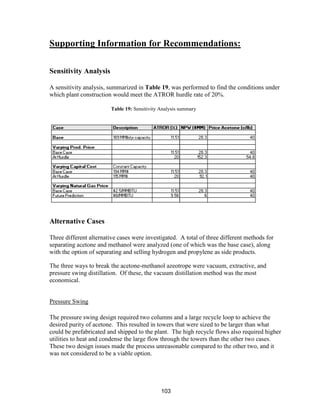
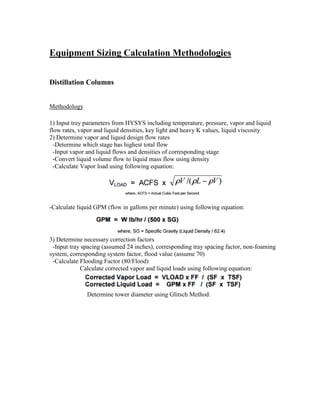
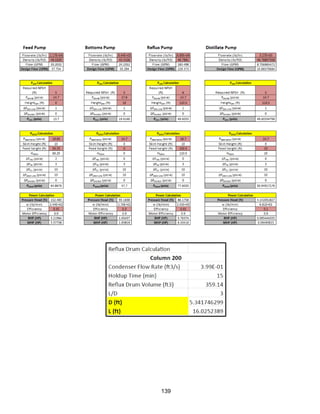
Using the current truck acetone price of 40¢
/lb, current estimates for the design plant
indicate that roughly $75.6 MM/yr of acetone
can be produced (assuming an acetone
capacity of roughly 189 MMlb/yr). Although
acetone prices have decreased significantly
over the past year, the recent stagnation and
slight increases in price change indicate that
the profitability of an acetone production plant
may increase in the near future.
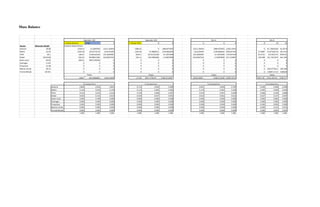
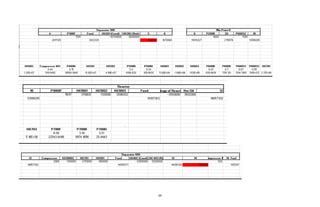
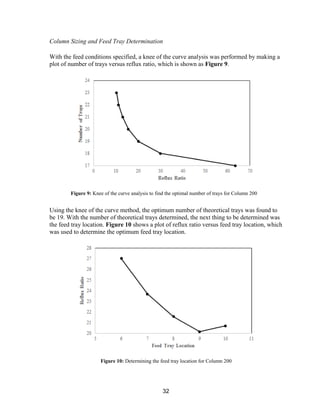
Figure 2: Acetone delivered contract price in 2015-2016 [26]
Figure 3: Acetone Free On Board spot price 2015-2016 [26]](https://image.slidesharecdn.com/49324da9-98a4-4a62-9a14-1c4fabd7896a-160505194536/85/Acetone-Retrofit_Senior-Design-9-320.jpg)
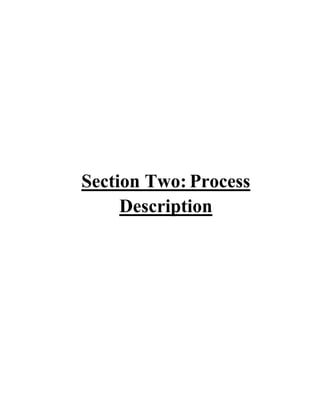
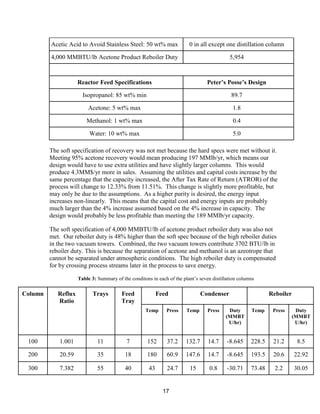
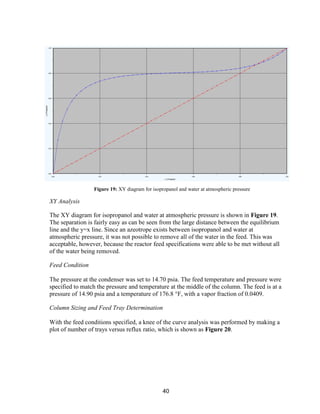
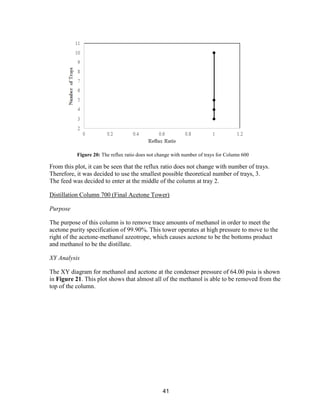
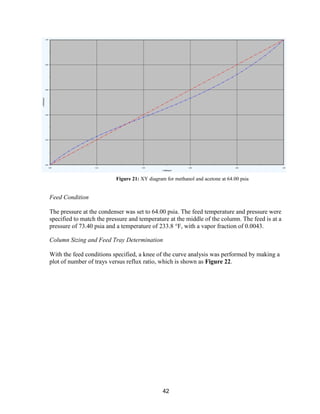
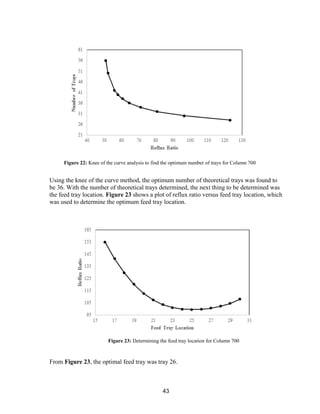
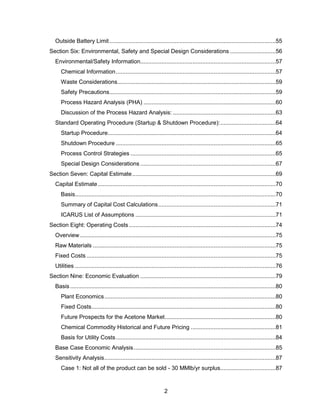
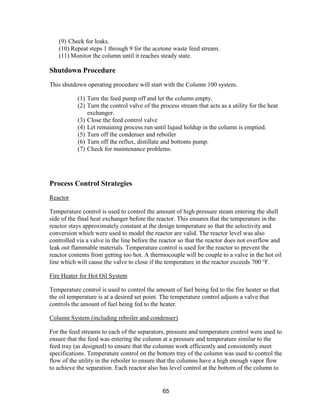
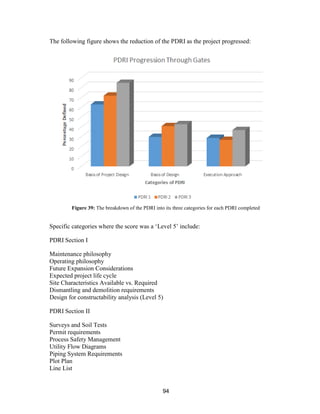
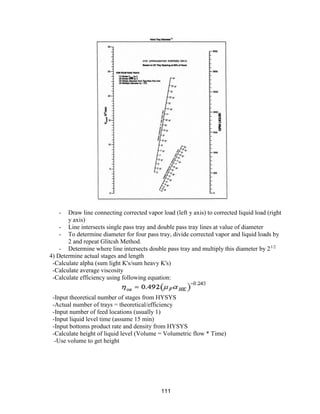
![45
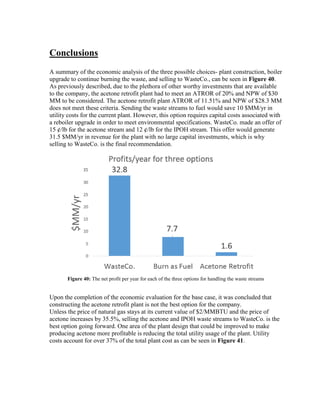
and ends at the outlet concentration. If a CSTR type reactor was chosen, the reactor would
always be run at the outlet acetone concentration, decreasing acetone production.
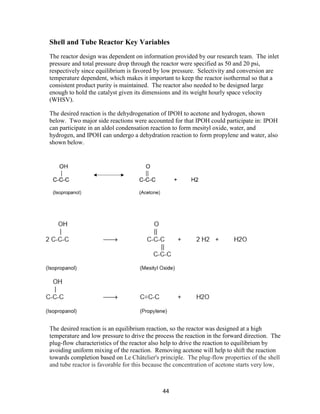
The production of side products was minimized by choosing the appropriate reaction
temperature. The selectivity for mesityl oxide and propylene increased with temperature, as
did the conversion of IPOH. The tradeoff between selectivity and conversion was
considered and optimized.
Reactor Choice
A shell and tube reactor was chosen based on the volume needed for the heterogeneous
catalyst, and the surface area needed for heat transfer to keep the reactor near isothermal
operation. A direct fired heater reactor will not be used because a fixed bed or shell and
tube reactor in combination with available utilities can accommodate the temperatures that
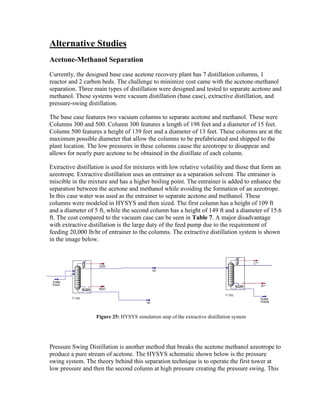
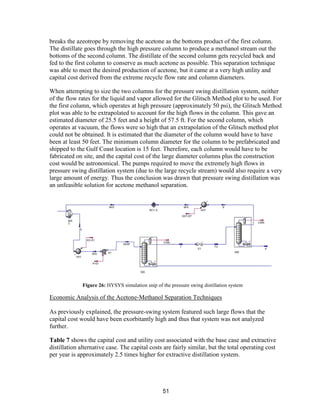
are needed; and it is a more expensive alternative.
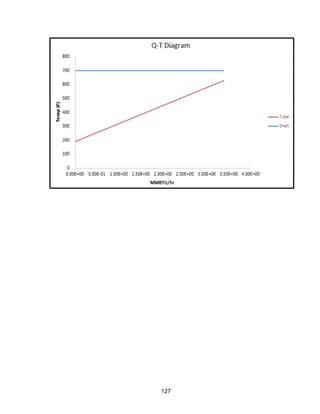
For an assumed flow rate of 9,800 lb/hr into the reactor, a heat input of 3.55 MMBTU/hr
yielded a process temperature change of 52.9o
F. Because the reactor needs to be run at
650o
F, hot oil at 750o
F must be used as the heat transfer fluid since the temperature
approach is 100-200o
F when heating above 600o
F. Dowtherm oil was chosen as the heat
transfer fluid, and it has an overall heat transfer coefficient of approximately 15 BTU (hr ft2
o
F)-1
[24]. The desired outlet temperature of the hot oil needed to be about 730o
F to achieve
a ∆TLM less than 90o
F (730o
F gives ∆TLM=81o
F), and to stay above the 100o
F temperature
approach. The minimum area required for heat transfer was determined to be 2,895 ft2
. The
surface area of the packed bed reactor was assumed to be the same as the heat transfer area.
For a fixed bed reactor, a length over diameter ratio of 3 was used to find a diameter of 17ft
and a resulting reactor volume equal to 11,575ft3
. Based on the catalyst’s WHSV, the
volume needed to accommodate the catalyst with a void fraction of 0.3 is 1,254ft3
. Because
of the factor of 10 difference in reactor volume needed for the catalyst versus the volume
needed for heat transfer using a cylindrical packed bed, a reactor with a higher area of heat
transfer to volume ratio will be needed, such as a shell and tube heat exchanger design.
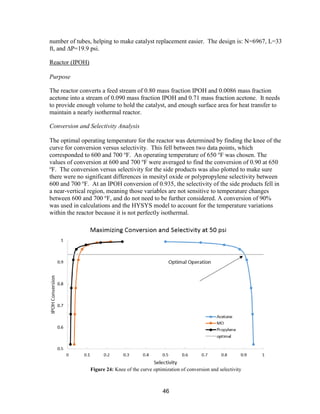
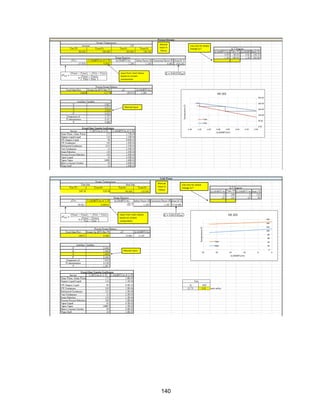
General Optimization Technique
The research group that developed our catalyst specified that the reactor feed needed to be
50 psi, with a maximum pressure drop of 20 psi. The tube diameter is set to 1” to hold the
catalyst with a maximum linear length (L) of 40 ft, and the volume for the catalyst was set
by its WHSV of 0.25 (lb feed/hr)/(lb catalyst). The number of tubes (N) was calculated
using the required catalyst volume and individual tube volume at a specific length. The
maximum N per reactor was specified to be 10,000. The Ergun Equation (Appendix,
Equipment sizing calculation methodologies) was used to determine the pressure drop
through the tubes. The reactor was sized by iterating the linear length to get a pressure drop
below 20 psi, and fewer than 10,000 tubes. The area for heat transfer was not a constraint
because the required area is 2,895 ft2
when using 750o
F hot oil, and the surface area of
10,000 tubes is on the order of 60,000 ft2
. Because equilibrium is favored by low pressure,
we chose to design to the maximum pressure drop of 20 psi, which also gave the minimum](https://image.slidesharecdn.com/49324da9-98a4-4a62-9a14-1c4fabd7896a-160505194536/85/Acetone-Retrofit_Senior-Design-46-320.jpg)
![47
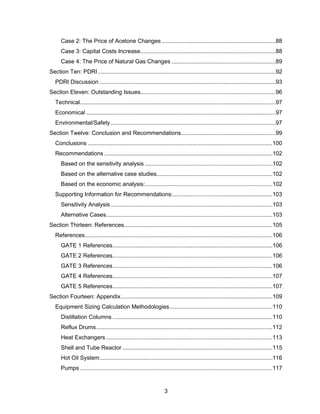
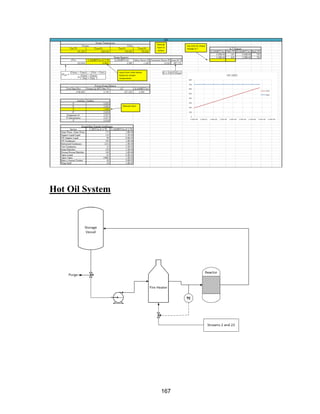
Hot Oil Heating Loop
Purpose
A utility needed to be provided to keep the reactor running isothermally. Based on the heat
of reaction and the moles of IPOH reacted, it was determined that 3.55 MMBTU/hr of heat
needs to be provided to the reactor to keep it near isothermal. The most economical utility
that could supply heat to reach a reaction temperature of 650 o
F was hot oil heated to 750o
F.
Optimization of Utility Stream Used to Heat the Hot Oil
There were seven waste streams in our process that could be used in the direct fire heater to
heat the hot oil. The utility in each stream was determined by multiplying the lower heating
value by the flow rate of the stream. The stream has to provide 3.55 MMBTU/hr, and no
single stream provided enough heat without providing ≥100% more than necessary. By
combining the bottoms of T-100 and distillate of T-700, a total of 5.646 MMBTU/hr can be
supplied to the direct fire heater, which can transfer 3.67 MMBTU/hr based on a 65%
thermal efficiency [18]. This provides enough heat to the reactor, with a safety factor of
1.03, and allows us to use a waste stream directly in the process.
Reactor and Catalyst Maintenance
Regeneration Process
Purpose
The copper on alumina catalyst experiences losses in activity (a function of the rate constant
and conversion) over time. This is likely due to coke forming on the surface as the
hydrocarbons pass over it at high temperature. Coke formation is known to happen during
dehydrogenation reactions, and has specifically been seen on a copper on alumina catalyst
[11, 14].
Regeneration Process
The catalyst must be regenerated every 6 months, and the entire regeneration cycle takes 7
days. Because Eurecat is the company supplying our catalyst and has a location in the US
Gulf Coast, we will be using their expert catalyst regeneration services rather than designing
and operating the process in-house.
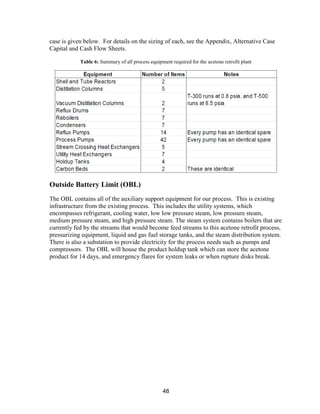
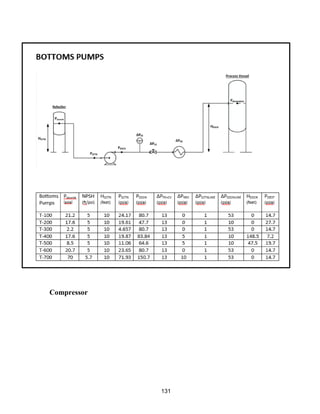
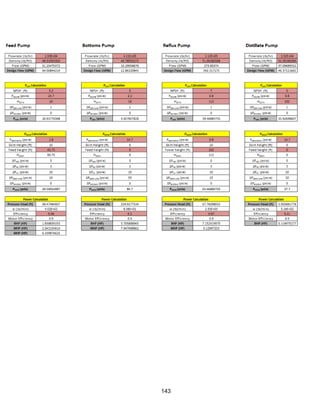
Detailed Equipment Lists
Inside Battery Limit (IBL)
The IBL contains all of the essential equipment to meet our plant capacity and hard
specifications. A summary of the number of each piece of process equipment for the base](https://image.slidesharecdn.com/49324da9-98a4-4a62-9a14-1c4fabd7896a-160505194536/85/Acetone-Retrofit_Senior-Design-48-320.jpg)


![72
General Specs
● Process description: Proven process (none of the information is proprietary, and all
of the separations have been done before)
● Process complexity: Typical (Azeotropes are common- this was the only major
problem we faced. Our process used mostly standard distillation procedures for
separations)
● Process control: Digital (We will not have manual control processes)
● Plant addition: Adjacent to existing (There is an existent plan that produces our feed
streams adjacent to this plant)
● Estimated start date: Jan 18, 2016 (Assumed to be the beginning of semester)
● Soil conditions: Sand/clay [19]
● Pressure Vessel Design Code: ASME (specified)
● Vessel diameter: ID (specified)
● P and I design level: Full (specified)
Investment Parameters
● Capital escalation: 0 (This will be specified and added into the capital estimate
which includes ICARUS and other capital costs)
● Facility type: chemical process facility (acetone is not a specialty chemical,
pharmaceutical, or food product)
● Operating mode: 24 hrs/day (assumed)
● Length of start-up period: 20 weeks (specified as default)
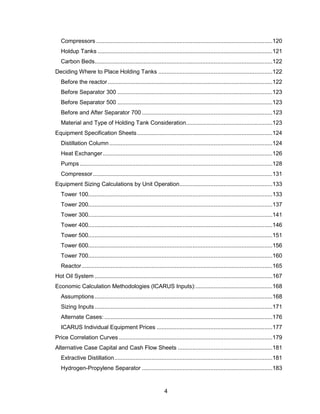
Discussion
The two most expensive systems in terms of capital are Tower 300 (Acetone/Methanol
Vacuum Tower) and the IPOH Reactor.
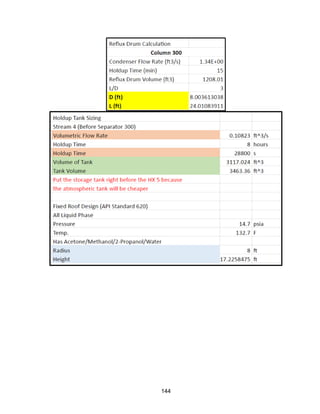
The Tower 300 system is expensive mainly because of the large size of the tower, which is
required for the difficult acetone-methanol separation. This cost is much smaller than it
would be if the originally-planned pressure-swing distillation system was installed, because
that system would have required two extremely large towers. Tower 300 requires a vacuum
system to be installed; but even with this cost, the system is cheaper than the pressure-swing
system. A possible alternative to lower the capital cost for Tower 300 would be to use an
extractive distillation column. Further research would need to be done to see if the capital
savings for using extractive distillation would make up for the fact that a fresh stream of an
entrainer would need to be purchased for the system. .Another large capital expense
associated with the Tower 300 system is the holding tank. However, a large holding tank is
necessary for safety reasons.
The IPOH reactor system features a large capital cost because the reactor also acts as a heat
exchanger. The reactor required a large area for the proper heat transfer to occur so that the
reactor stays at the optimal temperature for conversion and selectivity reasons. A large
holding tank is also included in the IPOH reactor system, which greatly increases the capital
cost but is necessary for safety reasons. The final reason the IPOH capital cost is high is due](https://image.slidesharecdn.com/49324da9-98a4-4a62-9a14-1c4fabd7896a-160505194536/85/Acetone-Retrofit_Senior-Design-73-320.jpg)
![76
Repair and maintenance costs were assumed to be 1.5% of the capital costs. Property taxes
were accounted for as a fixed cost while sales and income taxes were accounted for in the
cash flow sheets. Property tax was 2.5% of the capital cost. Insurance was assumed to be
0.5% of the capital costs. This covers casualties, property damage, and pollution liability.
Utilities
The power utilities were used to power the process pumps and compressors. The
heating/cooling utilities available spanned from -150 to 750 o
F. The assumed price of each
utility is shown in Appendix, Economic Calculation Methodologies (ICARUS Inputs).
These were calculated based on a natural gas price of $2.5/MMBTU. Although the current
price of natural gas is $1.86/MMBTU, $2.5/MMBTU was used as a safety factor. The
historical natural gas prices show price fluctuations of at least $0.5/MMBTU in any single
year. The natural gas futures predict that the price will increase to $6/MMBTU by 2025
[31]. The combination of these two factors resulted in us estimating the price of natural gas
to be higher than the current value.
The heating/cooling utilities were used for the reactor, process heat exchangers, reboilers,
and condensers. Each utility has a different cost, which allowed us to optimize the use of
each by minimizing price. Heat exchangers with large duties can be split into multiple heat
exchangers in series to reduce the use of expensive utilities. This is done by adding another
heat exchanger using a different process once the process stream is heated/cooled to the
range of a less expensive utility. Utility costs were also minimized by crossing process
streams where one needed to be heated, and the other needed to be cooled. The largest
energy savings seen by crossing streams was from cooling the reactor effluent by preheating
the stream going into T-700. This saved 4.34MMBU/hr. The cheapest utility was always
chosen while satisfying the temperature approach limits for each temperature range.](https://image.slidesharecdn.com/49324da9-98a4-4a62-9a14-1c4fabd7896a-160505194536/85/Acetone-Retrofit_Senior-Design-77-320.jpg)
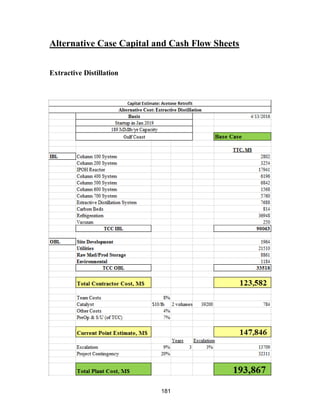
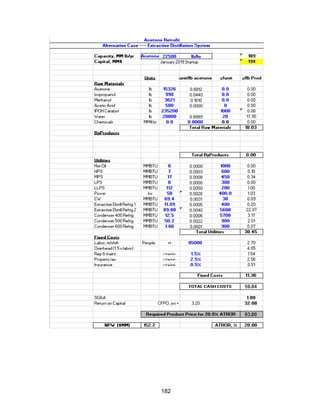
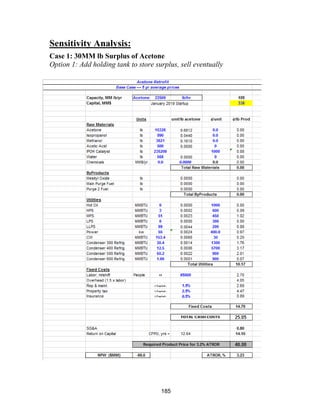
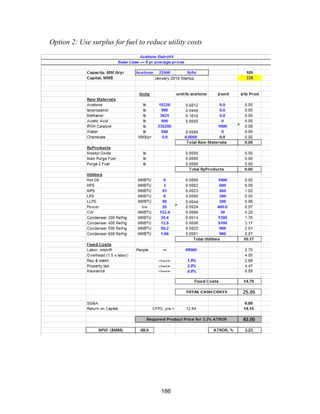
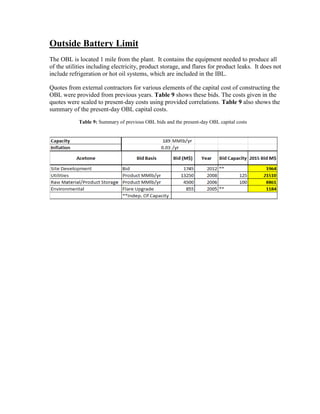
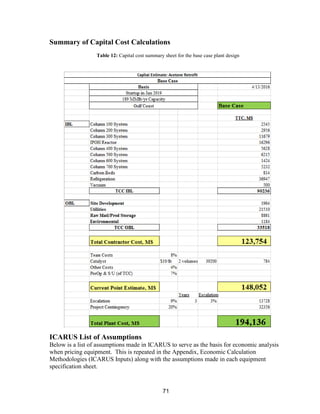
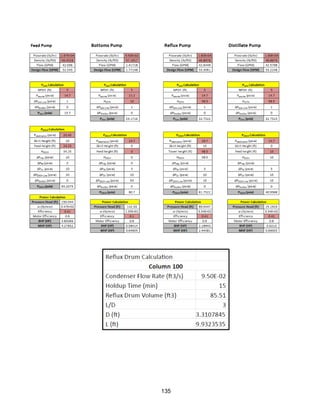
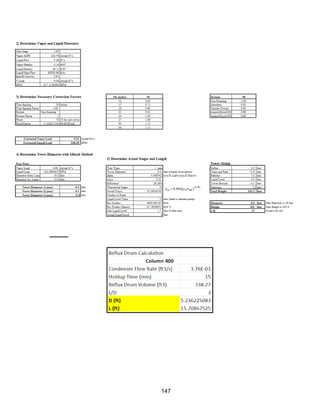
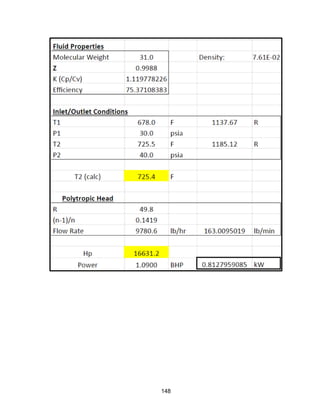
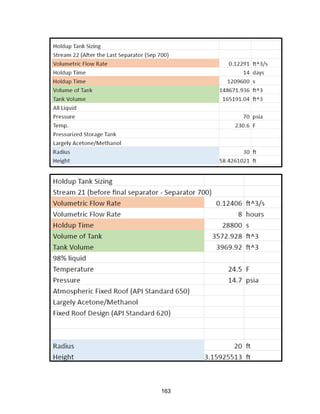
![Basis
The basis used for the economic evaluation is shown below. The values were provided from
the company’s management. The targets for designing a process that is competitive with
other ones the company is considering are: ATROR ≥ 20% and NPV ≥ $30MM.
Plant Economics
● Plant Operating Time: 8400 hours per year
● Plant Startup: January 2019
● Project Start: March 2016
● Project Life: 15 years from start-up
● Capital Spending: 15%/35%/50%
● Market Build: 40%, 75%, 100% in 1st
3 years of production
● SG&A: 2% of sales
● Income Tax Rate: 38%
● Working Capital: 10% of revenues
● Depreciation: MACRA
● Project Discount Rate: 9%
● Escalation (Inflation): 3% per year
Fixed Costs
● Plant Labor Salary + Benefits: $85,000/man-yr
● Plant Overhead: 1.5 x Plant Labor
● Repairs and maintenance: 1.5% of capital
● Property tax: 2.5% of capital
● Insurance: 0.5% of capital
Future Prospects for the Acetone Market
The consumption of acetone is expected to increase in the future based on the demand of the
products that it is used for, predominantly BPA, methyl methacrylate, and solvents. In
2014, BPA accounted for 31% of all global acetone production, and it is expected to
continue to surpass all other categories by 2020 [25]. The largest market players in the
acetone industry are: Dow chemical company, BASF, INEOS Phenol GmBH, CEPSA
QUIMICA, Shell Chemicals, Mitsui Chemicals, Reliance Chemicals, Honeywell and LG. A
company in Shanghai China recently started up the world's largest phenol and acetone plant,
meaning China will be importing less acetone than historically.](https://image.slidesharecdn.com/49324da9-98a4-4a62-9a14-1c4fabd7896a-160505194536/85/Acetone-Retrofit_Senior-Design-81-320.jpg)
![81
The estimated trend in consumption and year-over-year growth both indicate that the
demand for acetone will be consistently increasing in the future. Because acetone is used as
a precursor to BPA, the demand for acetone will likely not drop significantly over the 18
year period that this plant will be in operation [25]. Seventy-three percent of BPA is used to
make polycarbonate resins. Twenty percent of these resins are used in the automotive
industry, and another 20% is used in making media products like CDs and DVDs. Because
of the market shift away from tangible media products, this is not an area of consumption
that should be depended on for demand. However, the automotive industry is increasingly
replacing glass with polycarbonate plastic, which is projected to increase in the future [25,
32]. According to a Research and Markets publication, the BPA market is projected to grow
between 2014 and 2019 [25].
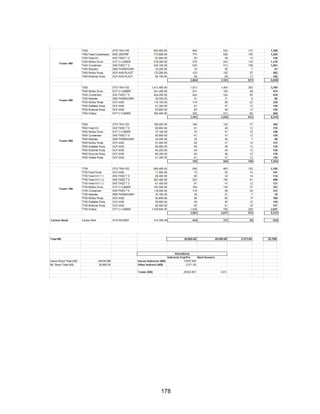
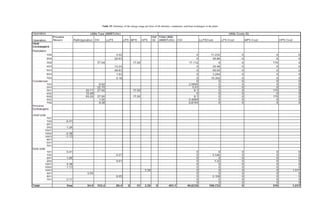
Chemical Commodity Historical and Future Pricing
The acetone price increases at a higher rate than if its price increased only due to inflation
[28]. A line was fit to the historical acetone price to project what it will be in the future
because no commodity was found to correlate to acetone prices to use for future predictions
(crude oil correlation R=0.349, natural gas correlation R=0.252, and cumene correlation
R=0.448. Data shown in Appendix, Price Correlation Curves). We estimate that its price
will increase in the future for two main reasons:
Figure 30: Global acetone consumption forecast through year 2020 [25]](https://image.slidesharecdn.com/49324da9-98a4-4a62-9a14-1c4fabd7896a-160505194536/85/Acetone-Retrofit_Senior-Design-82-320.jpg)
![82
1) Acetone is a byproduct of cumene, which is petroleum based. The historical
prices correlate with a linear fit having an R=0.95 (data shown in Appendix, Price
Correlation Curves). The futures for crude oil predict that the price will drop by about 15%
by the year 2025 [31]. However, the cost of cumene was not seen to correlate with
acetone’s price. This means that the price of acetone will likely be driven by supply/demand
more than the cumene price.
2) The demand for acetone will likely grow, based on the analysis given in the
previous section. Combined with the decrease in acetone production, this will increase the
global price of acetone.
Figure 31: Prediction of future acetone prices based on historical data](https://image.slidesharecdn.com/49324da9-98a4-4a62-9a14-1c4fabd7896a-160505194536/85/Acetone-Retrofit_Senior-Design-83-320.jpg)
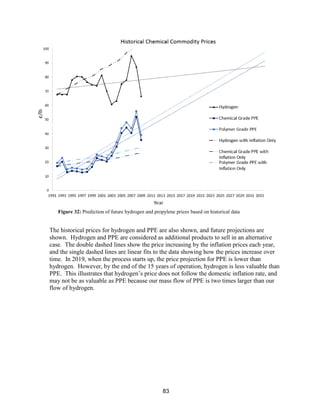
![84
Basis for Utility Costs
Figure 33: Historical natural gas prices along with forecasted prices up to 2025 [29]
The plot of natural gas prices shows that it peaked in 2005, and has been on a steady decline
since then because of technological improvements of hydraulic fracturing. The inset zooms
in on the price trend since 2014, which also shows a 50% decrease in price over the two
year period. The current price for natural gas is $1.96/MMBTU, so utility prices were based
off of this price. The price has been decreasing for the past decade, but World Bank predicts
that it will triple within the next 10 years.
The historical or future price of isopropanol (the major component in the feed stream other
than acetone) was not factored into the economic evaluation. This is because its current
value is derived from being used as a fuel, rather than as a product to sell. Its heat of
combustion will not change over time like price would, so its value is based upon the price
of natural gas that it saves from being used. The price of natural gas is predicted to increase
from the current price of $2/MMBTU, to $6/MMBTU in 2025 [31]. This means that the
feed streams to the acetone retrofit process will become more valuable with time. The
avoided costs of using the feed streams as fuel instead of natural gas to produce high
pressure steam will be larger in the future, and will be taken into consideration when
comparing the company’s options, but will not be part of the acetone retrofit cash flow.](https://image.slidesharecdn.com/49324da9-98a4-4a62-9a14-1c4fabd7896a-160505194536/85/Acetone-Retrofit_Senior-Design-85-320.jpg)
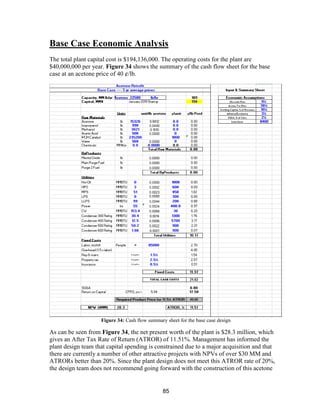
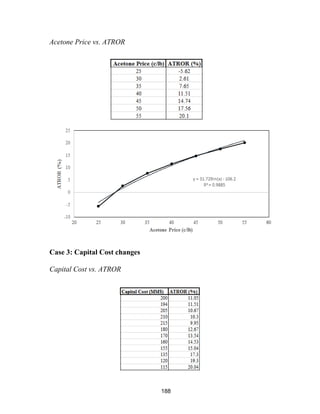
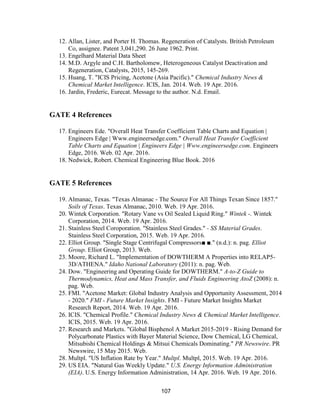
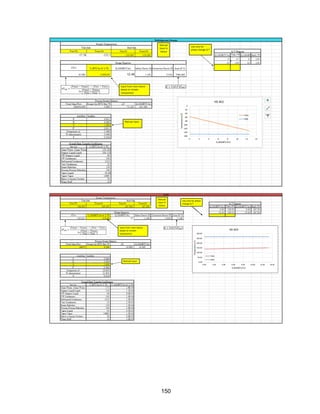
![89
a plot showing the effect of capital cost on ATROR. It can be seen from the plot that the
capital cost would need to be reduced by approximately $79 million (to $115 million) in
order for the plant to eclipse the ATROR hurdle rate of 20%. Since the sizing of all of the
capital equipment was optimized to reduce costs, achieving such a cut in capital cost is
unfeasible.
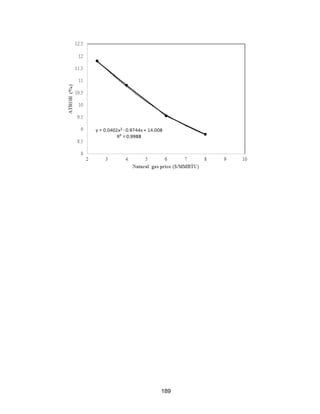
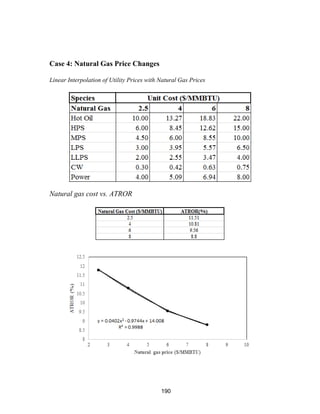
Case 4: The Price of Natural Gas Changes
The price of natural gas could continue to fluctuate in future years. The price of natural gas
has reached a 10-year low due to technology improvements in hydraulic fracturing. Natural
gas is a non-renewable resource that will become increasingly expensive to drill for as the
supplies decrease. The current domestic supplies are expected to last 84 years [30], but that
does not imply that the cost will remain at $2/MMBTU until the economical reserves are
drained. According to the World Bank, natural gas will reach $6/MMBTU by 2025 [31],
which needs to be considered for the future of the acetone retrofit process. Table 18 shows
the utility prices at two different prices of natural gas. Linear interpolation was used to
obtain utility prices at two additional prices of natural gas. Then, a plot of ATROR as a
function of natural gas price was produced. If the price of natural gas increases to
$6/MMBTU by 2025, the ATROR of the plant would drop to below 10%.
Figure 36: Effect of capital cost on ATROR (acetone price and capacity held constant)](https://image.slidesharecdn.com/49324da9-98a4-4a62-9a14-1c4fabd7896a-160505194536/85/Acetone-Retrofit_Senior-Design-90-320.jpg)


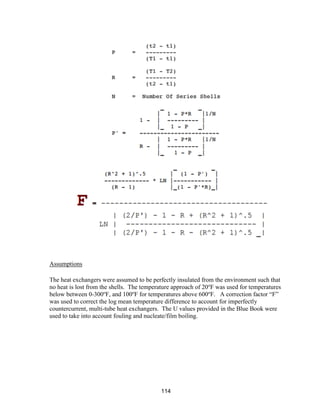
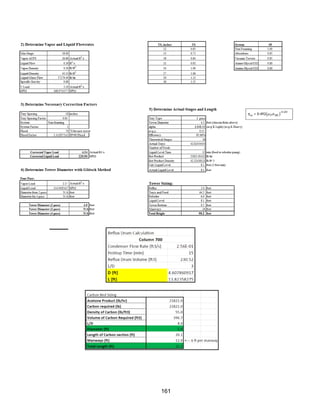
![115
Shell and Tube Reactor
Methodology
Sizing Calculation Defined: inlet pressure, pressure drop, maximum number of tubes,
maximum tube length, reactor diameter, and tube diameter.
1) A tube length was chosen, and the number of tubes needed to hold the volume of
catalyst was calculated assuming the tubes were cylinders. The pressure drop across
each tube was calculated using the single phase Ergun Equation because it is a vapor
phase reaction:
2) Once a pressure drop was found, the length of tube was updated, and the iteration
continued until the pressure drop equaled 20 psi. The largest pressure drop led to the
smallest number of tubes, which reduces capital cost. The reactor diameter was estimated by
assuming the tubes were square packed into a square shape: where N is the number of tubes.
Once the number of tubes, pressure drop, and reactor diameter were within the defined
limits, the reactor was sized.
Heat Calculations: The area needed for heat transfer was calculated using an overall heat
transfer coefficient: The log mean temperature difference had a defined limit of 90 F, Q was
determined by the heat of reaction and conversion (taken from HYSYS), and U was taken
from reference 16.
Assumptions:
Dowtherm oil is used as the heat transfer fluid, and it has an overall heat transfer unit of 15
BTU/(hr ft2 o
F) [17] when used in a shell and tube reactor. We assumed that there was only
a single vapor phase flowing through the tubes, making the single phase Ergun Equation
valid. The Ergun Equation assumes a uniform packing density, no wall effects, that the](https://image.slidesharecdn.com/49324da9-98a4-4a62-9a14-1c4fabd7896a-160505194536/85/Acetone-Retrofit_Senior-Design-116-320.jpg)
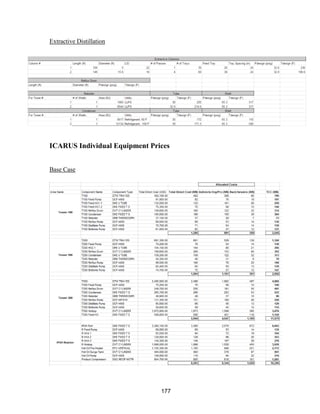
![168
Economic Calculation Methodologies (ICARUS Inputs):
Assumptions
General Process Data
General Specs
Process description: Proven process (none of the information is proprietary, and all of the
separations have been done before)
Process complexity: Typical (Azeotropes are common- this was the only major problem we
faced. Our process used mostly standard distillation procedures for separations)
Process control: Digital (We will not have manual control processes)
Plant addition: Adjacent to existing (There is an existent plan that produces our feed streams
adjacent to this plant)
Estimated start date: Jan 18, 2016 (Assumed to be the beginning of semester)
Soil conditions: Sand/clay [19]
Pressure Vessel Design Code: ASME (specified)
Vessel diameter: ID (specified)
P and I design level: Full (specified)
Investment Parameters
Capital escalation: 0 (This will be specified and added into the capital estimate which
includes ICARUS and other capital costs)
Facility type: chemical process facility (acetone is not a specialty chemical, pharmaceutical,
or food product)
Operating mode: 24 hrs/day (assumed)
Length of start-up period: 20 weeks (specified as default)](https://image.slidesharecdn.com/49324da9-98a4-4a62-9a14-1c4fabd7896a-160505194536/85/Acetone-Retrofit_Senior-Design-169-320.jpg)
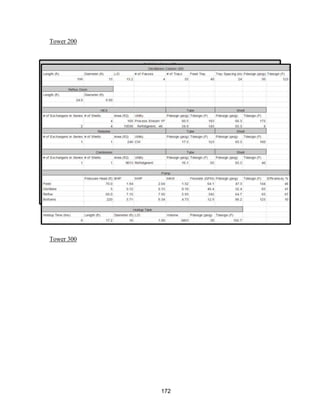
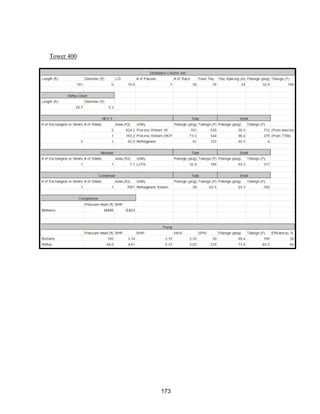
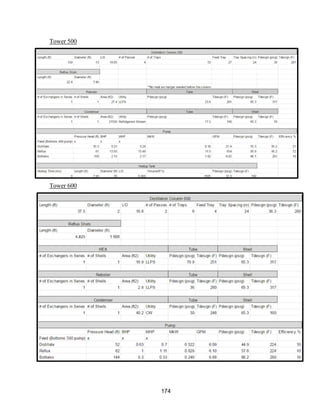
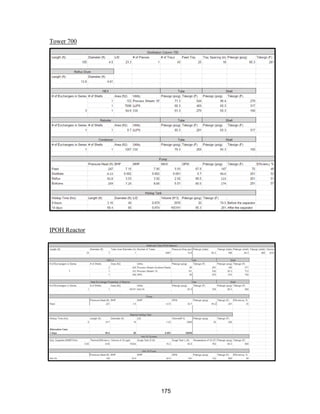
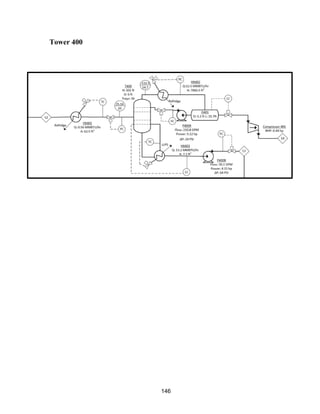
![171
MOC - Nickel
Skirt height is 10 ft
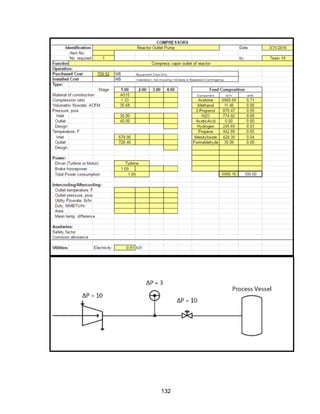
Compressors
Centrifugal
Tdesign =200o
F because this is the minimum allowed in ICARUS. Companies build
compressors for T>500o
F [21]
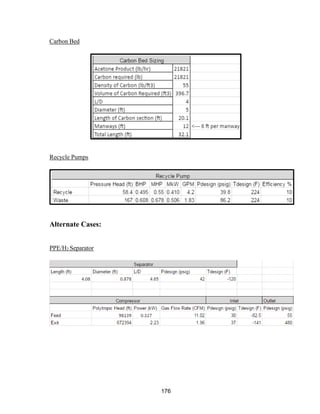
Carbon Beds
2 identical items
Sizing Inputs
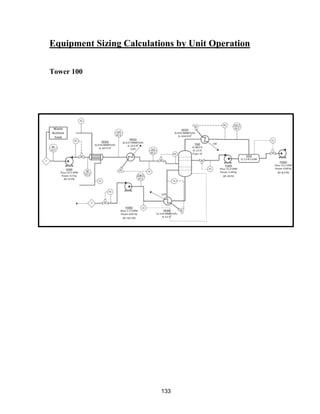
Tower 100](https://image.slidesharecdn.com/49324da9-98a4-4a62-9a14-1c4fabd7896a-160505194536/85/Acetone-Retrofit_Senior-Design-172-320.jpg)