Download to read offline
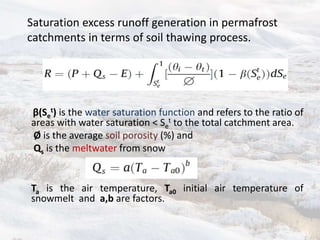
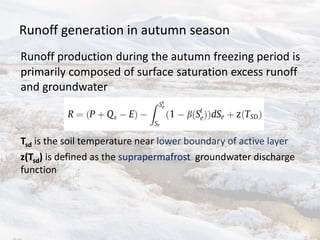

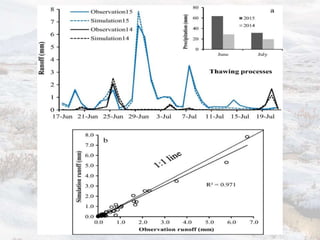
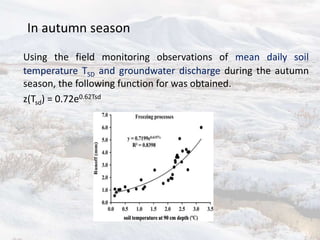
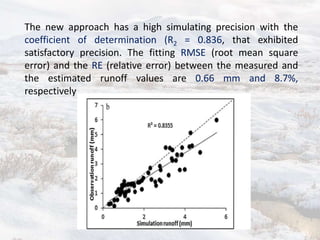

This seminar presentation summarizes a study on runoff generation processes during spring and autumn seasons in a permafrost catchment on the Qinghai-Tibet Plateau. The study develops an approach to simulate runoff based on soil water storage and active layer dynamics. During spring thaw, saturation excess runoff and subsurface interflow within the thawed active layer are dominant. In autumn, groundwater discharge from the suprapermafrost talik is the main source of runoff as the active layer freezes. The approach accurately simulates runoff with coefficients over 0.9, demonstrating its ability to model runoff in permafrost environments.