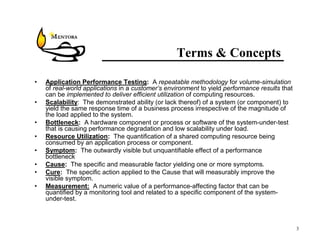
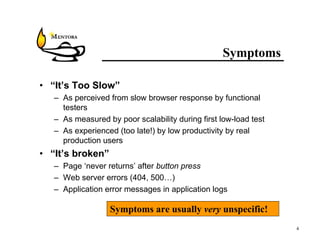
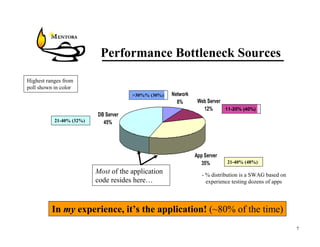
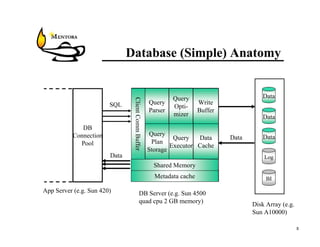
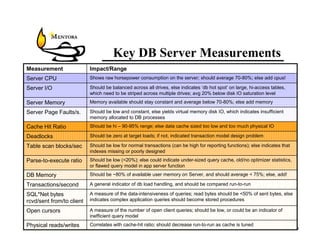
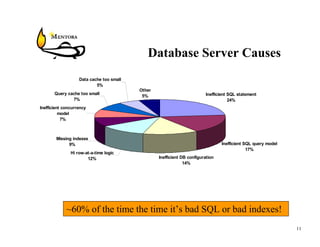
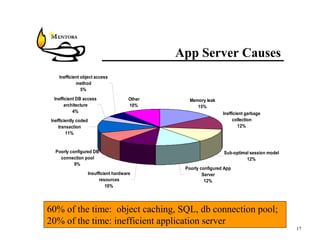
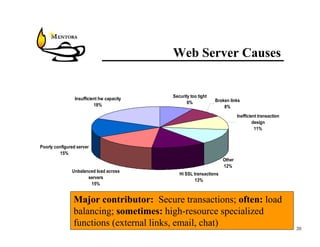
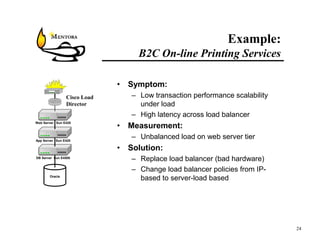
Микола Ковш “Performance Testing Implementation From Scratch. Why? When and H...
Bottlenecks exposed web app db servers
1. Bottlenecks Exposed – Title Slide
Web Application
^Bottlenecks Exposed:
The Most Frequently Found Performance
Problems – and How to Nail Them!
Dan Downing, VP Testing Services
MENTORA
Atlanta • Boston • DC • San Jose
404.250.6515 • www.mentora.com
Copyright Mentora 2001
2. Objectives
• Identify common website performance bottlenecks:
• Source (what component they occur on)
• Symptom (how you know there’s a problem)
• Causes (what creates the problem)
• Measurements (how to nail it)
• Cures (how to make it go away)
• Illustrate with examples of B2C, B2B, B2E cases
Audience: Performance Engineer, Load
Testing Expert, with intermediate experience
2
3. Terms & Concepts
• Application Performance Testing: A repeatable methodology for volume-simulation
of real-world applications in a customer’s environment to yield performance results that
can be implemented to deliver efficient utilization of computing resources.
• Scalability: The demonstrated ability (or lack thereof) of a system (or component) to
yield the same response time of a business process irrespective of the magnitude of
the load applied to the system.
• Bottleneck: A hardware component or process or software of the system-under-test
that is causing performance degradation and low scalability under load.
• Resource Utilization: The quantification of a shared computing resource being
consumed by an application process or component.
• Symptom: The outwardly visible but unquantifiable effect of a performance
bottleneck
• Cause: The specific and measurable factor yielding one or more symptoms.
• Cure: The specific action applied to the Cause that will measurably improve the
visible symptom.
• Measurement: A numeric value of a performance-affecting factor that can be
quantified by a monitoring tool and related to a specific component of the system-
under-test.
3
4. Symptoms
• “It’s Too Slow”
– As perceived from slow browser response by functional
testers
– As measured by poor scalability during first low-load test
– As experienced (too late!) by low productivity by real
production users
• “It’s broken”
– Page ‘never returns’ after button press
– Web server errors (404, 500…)
– Application error messages in application logs
Symptoms are usually very unspecific!
4
5. 3-Tier Environment
• Network
– Firewall, load balancer, routers, network interface
cards, cabling between all components
• Web Server Tier
Web Server Sun E220
– One or more (usually many) low capacity computers
that receive, route, and display results of http requests
from visitors’ browsers
• Application Server Tier
– One or more (often 2) medium-high capacity computers
App Server Sun E420 that receives, applies business logic to, and returns to
the web server the results of the http request
DB Server Sun E4500
• Database Server Tier
– One or more (usually one with redundant stand-by) high
capacity computers that operate database software,
Oracle
and access database (often on large disk arrays) for
servicing user data requests
5
6. Performance Bottleneck Sources
* Poll results of 56 Mercury Conference ’01
attendees of intermediate to advanced experience.
How App DB How Web Ntwk
often? Srvr Srvr often? Srvr
<10% 11% 7% <10% 29% 27%
DB Server Network 11-20% 40% 25%
11-20% 11% 21%
21-40% 48% 32% 21-30% 12% 16%
41-60% 21% 29% >30% 16% 30%
App Server Web Server
>60% 7% 9%
What in your experience* do you find as the
relative distribution of bottlenecks?
6
7. Performance Bottleneck Sources
Highest ranges from
poll shown in color
>30%% (30%) Network
8% Web Server
12% 11-20% (40%)
DB Server
21-40% (32%) 45%
App Server
35% 21-40% (48%)
Most of the application - % distribution is a SWAG based on
code resides here… experience testing dozens of apps
In my experience, it’s the application! (~80% of the time)
7
8. Database (Simple) Anatomy
Query Data
Client Comm Buffer
SQL Query Write
Opti-
Parser Buffer
mizer Data
DB
Connection Query Data
Query Data Data
Pool Plan
Executor Cache
Storage
Data Log
Shared Memory
Metadata cache BI
App Server (e.g. Sun 420) DB Server (e.g. Sun 4500
quad cpu 2 GB memory) Disk Array (e.g.
Sun A10000)
8
9. Key DB Server Measurements
Measurement Impact/Range
Server CPU Shows raw horsepower consumption on the server; should average 70-80%; else add cpus!
Server I/O Should be balanced across all drives, else indicates ‘db hot spot’ on large, hi-access tables,
which need to be striped across multiple drives; avg 20% below disk IO saturation level
Server Memory Memory available should stay constant and average below 70-80%; else add memory
Server Page Faults/s. Should be low and constant, else yields virtual memory disk IO, which indicates insufficient
memory allocated to DB processes
Cache Hit Ratio Should be hi – 90-95% range; else data cache sized too low and too much physical IO
Deadlocks Should be zero at target loads; if not, indicated transaction model design problem
Table scan blocks/sec Should be low for normal transactions (can be high for reporting functions); else indicates that
indexes missing or poorly designed
Parse-to-execute ratio Should be low (<20%); else could indicate under-sized query cache, old/no optimizer statistics,
or flawed query model in app server function
DB Memory Should be ~80% of available user memory on Server, and should average < 75%; else, add!
Transactions/second A general indicator of db load handling, and should be compared run-to-run
SQL*Net bytes A measure of the data-intensiveness of queries; read bytes should be <50% of sent bytes, else
rcvd/sent from/to client indicates complex application queries should become stored procedures
Open cursors A measure of the number of open client queries; should be low, or could be an indicator of
inefficient query model
Physical reads/writes Correlates with cache-hit ratio; should decrease run-to-run as cache is tuned
9
10. DB Server Causes & Cures
Cause Measurement Cure
Inefficient SQL statement Slow page (>10 sec) which ties to a specific Analyze query plan, optimize
function, thus an SQL query; hi db cpu | IO query
Inefficient SQL query Many slow pages; hi 'bytes recvd' by db Convert client SQL to stored
model server; low db cpu; or: many slow queries procedures | optimize slow q’s
Inefficient DB configuration Low correlation btw DB and Server Reconfigure DB (add memory,
resource utilization; unbalanced I/O write processes, threads, …)
Overuse of row-at-a-time Hi open cursors; hi bytes sent from client Tune query prepares in App
processing server / code
Missing/ineffective indexes high table scan blocks; slow function Find/add/fix table indexes
Query plan cache too small Hi parsed-to-executed queries ratio Raise size of query plan cache
Inefficient concurrency Hi blocked transactions, high table locks Review/fix transaction logic;
model modify DB locking strategy
Data cache too small Low cache-hit ratio, hi physical reads Increase cache size
Out-of-date statistics high table scan blocks; many slow rerun optimizer statistics
functions
Deadlocks Deadlocks non-zero /errors in error log Fix application transaction code
Other Inefficient access method; too many DB Pinpoint and correct!
connections; small comm buffers;… 10
11. Database Server Causes
Data cache too small
5%
Other
Query cache too small Inefficient SQL statement
5%
7% 24%
Inefficient concurrency
model
7%
Missing indexes
9% Inefficient SQL query model
17%
Hi row-at-a-time logic
12% Inefficient DB configuration
14%
~60% of the time the time it’s bad SQL or bad indexes!
11
12. Example:
B2B Supply Chain Management
• Symptom:
– Transactions that return list data running
very slowly; they don’t scale
Apache
Web Server Sun E220
• Measurement: (using LR Oracle Monitor)
– Hi table scan blocks
– Low index fast full scans
WebLogic • Cure:
App Server Sun E420
Oracle – Add additional indexes
DB Server Sun E420 – Design indexes so queries can be resolved
with index table columns w/o accessing
Oracle
base table
– Enable fast scan Oracle parameter
12
13. LR Oracle Monitor
Table scan blocks
average = 12
Index fast full
scans = 0
13
14. App Server (Simple) Anatomy
Client
Transaction Mgr
SQL
Communic. Mgr
Connection Mgr
Messaging Mgr
DB Conn. Mgr
Security Mgr
Requests
Data
html
pages Object
Business Logic
Cache
Presentation Presentation
Manager Logic
Web Server App Server (e.g. usually two; Sun DB Server
420 dual cpu 1GB memory)
14
15. Key App Server Measurements
Measurement Impact/Range
Server CPU Shows raw horsepower consumption on the server; should average 70-80%; else add cpus!
Server Memory Memory should track App Server memory, should stabilize at target load at 70% average, else
possible memory leak or add memory
Server Page Faults/s. Should be low and constant, else yields virtual memory disk IO, which indicates insufficient
memory allocated to App Server processes
Cache Hit Ratios Should be hi – 90% range; else data/object caches sized too low and too much physical IO
App Server memory Memory should rise as active sessions grow, should shrink in garbage collection cycle, and
should stabilize at target load at 70% average, else possible memory leak or add memory
Active/Total Sessions Should be rise as load increases, stabilize at target load, approximate vendor target/instance;
else, decrease inactive session keep-alive time
SSL transactions/sec Should be a relatively low ratio vs. non-secure transactions (<15%?); else, eating up cpu, bw
Active/Total DB Pool Active sessions should rise with load, and stabilize at less than Total; if does not stabilize,
Connections indicates insufficient processing power to keep up with DB; if maxes out, too few connections
Application log Should contain low/no error messages, low warnings; else indicates application problems
Load balancing Should see all app server instance doing similar amount of work; else indicates load balacing
problem
Requests/second A general indicator of app server load as evidenced by web server request volume, and should
be compared run-to-run and track with load applied
15
16. App Server Metrics & Cures
Cause Measurement Cure
Memory leak Memory utilization rises steadily, Find and fix memory faulty
doesn't recover application code
Inefficient garbage collection Spikes in transaction times Tune app server load balancing
Sub-optimal session model Steadily rising active sessions Tune session keep-alive setting
Poorly configured App Server Low correlation btw App and HW Validate proper JVM-to-app
resource utilization; overall poor server match; Increase data &
performance object caches; add HW memory
Insufficient hardware resources Hi cpu, memory, I/O utilization Add cpus, memory; decrease
no. App server instances
Poorly configured DB connection Steadily rising active connections, hi Raise DB connections; lower
pool cpu utilization no. of App Server instances
Inefficiently coded transaction Slow specific business function Pinpoint & diagnose longest
running business processes
Inefficient security model Hi calls on port 7002 Review/relax app security
Inefficient object access method Slow object creation Change object access method
Other Low OS resources; erratic Pinpoint and correct!
transaction performance 16
17. App Server Causes
Inefficient object access
method
5%
Inefficient DB access Other Memory leak
architecture 10% 15%
4% Inefficient garbage
Inefficiently coded collection
transaction 12%
11%
Poorly configured DB Sub-optimal session model
connection pool 12%
9%
Poorly configured App
Insufficient hardware Server
resources 12%
10%
60% of the time: object caching, SQL, db connection pool;
20% of the time: inefficient application server
17
18. Example:
B2C Large Retail Web Store
• Symptom:
– App server memory leak
• Measurement:
Apache – Steadily increasing, non-recovering
Web Server Sun E420 memory usage in Dynamo console
ATG Dynamo – Memory exhausted and app server dies
App Server Sun E420 over 8 hour run
Oracle • Solution:
DB Server Sun E4500
– Test individual functions
– Isolate errant function not releasing
Oracle
memory
– Fix code!
– Re-test to validate fix (longevity test)
18
19. Web Server Metrics & Cures
Cause Measurement Cure
Security too tight Hi firewall-to-web server traffic Direct firewall and user traffic to
different ports
Broken links Broken link errors Diagnose / fix application
Inefficient transaction design Hi ip connections per active Reduce keep-alive time; correct
session transaction design
Other Low OS resource utilization, Diagnose App, DB servers
overall poor throughput
Hi SSL transactions Memory utilization >70%, low Review/relax secure transaction
throughput; hi port 443 calls model
Unbalanced load across Uneven utilization across web Review/revise load balancing policies
servers servers
Poorly configured server Hi I/O, hi memory utilization, low Tune web server configuration
throughput
Insufficient hw capacity Hi cpu, memory, I/O; timeout Add cpus, memory; add web servers;
errors distribute content; add specialized
servers (images, streaming media…)
19
20. Web Server Causes
Security too tight
Insufficient hw capacity Broken links
18% 8%
8%
Inefficient transaction
design
11%
Poorly configured server
15%
Other
12%
Unbalanced load across
Hi SSL transactions
servers
13%
15%
Major contributor: Secure transactions; often: load
balancing; sometimes: high-resource specialized
functions (external links, email, chat) 20
21. Example:
B2E Collaborating Communities
• Symptom:
Cisco Load – Slow overall performance
Director – DB server low activity
IIS/Visual
Basic
• Measurement:
Web/ App
Server Dell 1550
– Web/App server resources maxed out
– Non-scalable transaction times
SQL • Solution:
DB Server Dell 2450 Server
– Short-term: Move “Chat” function to
dedicated server
SQL Server
– Long-term: Re-architect system in java,
separate Web and App tiers, introduce
dedicated server for chat and email
functions
21
22. Network Metrics & Cures
Cause Measurement Cure
Load balancing ineffective Uneven load at web servers Revise load balancing policy
Insufficient overall bandwidth Low, maxed throughput; high Get hoster to raise bw ceiling;
collision rate increase system bw; add NICs
for failover functions
Security too tight High traffic btw firewall & Loosen security policies;
servers redesign application security
Poorly configured/insufficient Low throughput btw servers Tune NIC buffers; add 2nd
network interface cards NIC for failover heartbeat
Poor network architecture Hi latency values in network Review/tune configuration of
delay monitor; low throughput NICs, Routers, other devices
Other ??? ???
22
23. Network Causes
Poor network architecture Load balancing ineffective
20% 22%
Insufficent overall
Other bandwidth
20% 13%
Poorly Security too tight
configured/insufficient NICs 15%
10%
No single major cause; often problem is load
balancing, security, or network architecture.
23
24. Example:
B2C On-line Printing Services
• Symptom:
Cisco Load – Low transaction performance scalability
Director under load
– High latency across load balancer
Web Server Sun E420
• Measurement:
App Server Sun E420
– Unbalanced load on web server tier
• Solution:
DB Server Sun E4500
– Replace load balancer (bad hardware)
– Change load balancer policies from IP-
Oracle
based to server-load based
24
27. Lessons Learned
1. 80% of the time it is the application or system software, not
the infrastructure!
2. Make friends with your app server, db server, and hardware
monitoring tools!
3. Application architect, DBA, and App Server experts are
indispensable and must be involved during load tests!
4. Arrive armed with the Top 10 Things to check for each
component!
5. Id the measurements you need to be able to make
6. Systems Engineer with networking, firewall, and load
balancer expertise is very handy!
27