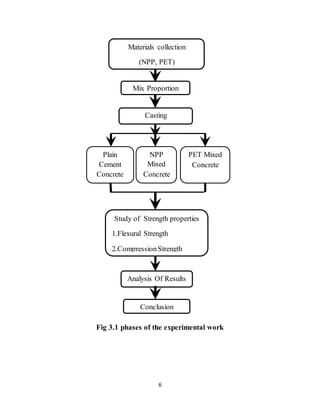
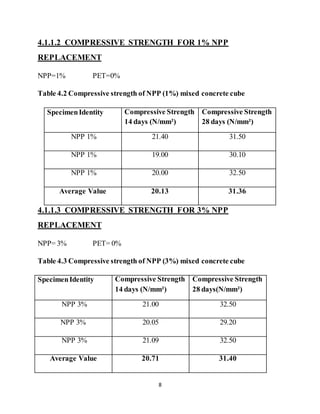
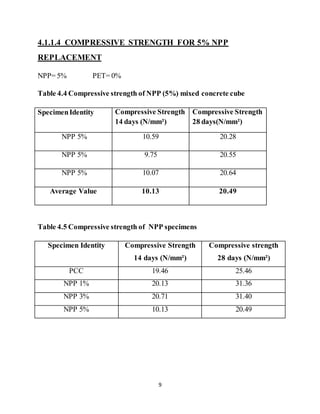
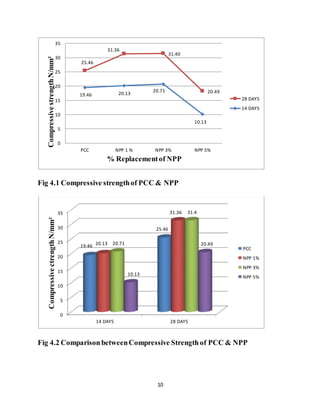
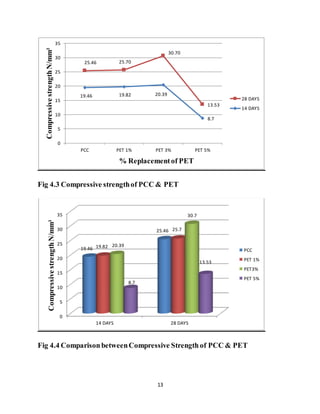
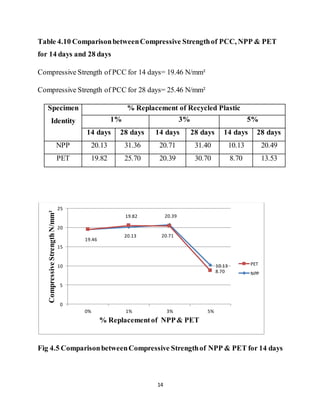
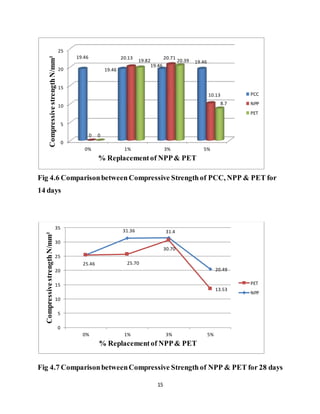
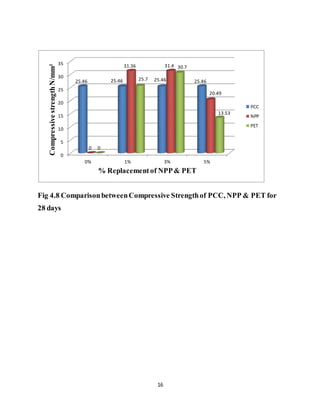
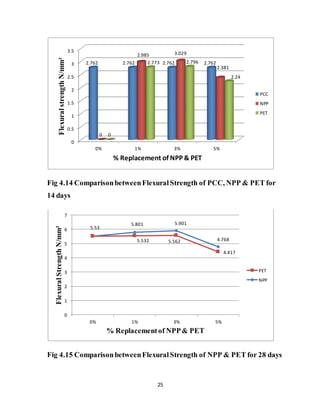
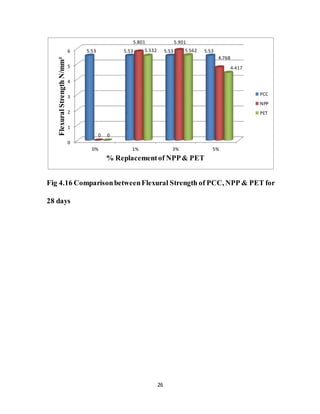
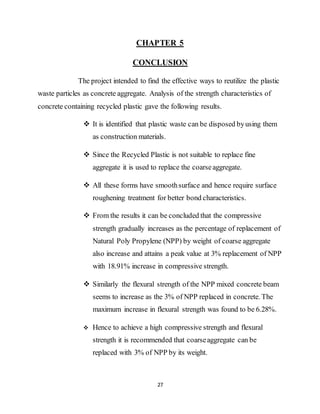
1
PERFORMANCE STUDY ON RECYCLED PLASTICS IN CONCRETE
1. INTRODUCTION
1.1 Background of plastic
1.2 Need for study
1.3 Scope and Objectives
2. LITERATURE REVIEW
2.1 Recycled plastic
3. EXPERIMENTAL WORK PHASE
3.1 Introduction
3.2 Work plan
3.3 Scheme of the work
4. RESULTS AND DISCUSSION
4.1 Test results
4.1.1 Compressive strength
4.1.2Flexural strength
5. CONCLUSION
2
CHAPTER 1
INTRODUCTION
1.1 BACK GROUND OF PLASTIC
The changed life style and endlessly increasing population has resulted
in a significant rise in the quantity of plastic waste. The world’s annual
consumption of plastic materials has increased from around 5million tons in the
1950’s to nearly 100 million tons in recent times, resulting in a significant increase
in the amount of plastic waste generation. Out of this waste , a significant part is
recycled but the majority of post - consumer plastic wastes , like shampoo sachets,
carry – bags , nitro packs , milk and water pouches etc., though recyclable,
remains comparatively untouched as they are difficult to separate from household
garbage.
In most of the cases, suchpost – consumer waste either litters all
around or is disposed offby land filling. The disposalof post – consumer plastic
waste in this manner poses significant environmental hazards as it results in
reduction in soil fertility , reduction in water percolation , emission of toxic gases ,
health hazard to animals and birds consuming the wastes , poordrainage due to
land fill , pollution of ground water due to leaching of chemicals from these waste
products etc.Looking to the global issue of environmental pollution by post –
consumer plastic waste , research efforts have been focused on consuming this
waste on massive scale in efficient and environmental friendly manner .
Researchers planned to use plastic waste in form of concrete ingredient
as the concrete is second mostsought material by human beings after water . The
use of post – consumer plastic waste in concrete will not only be its safe disposal
3
method but may also improve the concrete properties like tensile strength ,
chemical resistance , drying shrinkage and creep on short and long term basis.
1.2 NEED FOR STUDY
Nowadays one of the major problems in construction industries is
insufficient and unavailability of construction materials , on the other side the main
environmental problem is the disposalof the waste plastics.
In this experimental study , an attempt has been made to use the
plastics in concrete and studies have been conducted to focus on the behavior of
flexural and compressionmembers under various proportions of plastics.
Types of plastics will be selected and mixed with concrete in various
proportions and the specimens are casted and tested for its compression and
flexural strength respectively.
1.3 SCOPE AND OBJECTIVES
The scopeofthis work is limited to the development of a suitable
mix design and to compare the compressibility and flexural aspectof Natural Poly
Propylene (NPP) mixed concrete and Polyethylene Terephthalate (PET) mixed
concrete against the plain cement concrete.
The main objective of this project is to enhance the best
environmental alternative for solving the problem of disposal.
The development of new construction materials using recycled
plastics is important to both the constructions and the plastic recycling industries.
4
CHAPTER 2
LITERATURE REVIEW
2.1 RECYCLED PLASTICS
Plastics are the organic polymer materials having carbonas the
common element in their make up. The polymers consistof combination of carbon
with oxygen , hydrogen , nitrogen and other organic substances. Plastic are
normally stable and not bio – degradable, so , their disposalposes problems.
Research works are going on in make use of plastic wastes
effectively as additives in bitumen mixes for the road pavements (Lakshmipathy
et., al, 2003) , (Vasudevan 2004) , repair and upgradation of reinforced concrete
silos using fiber reinforced plastics (FRP), (Bhedasgaonkaret., al 2004).
A laboratory experimental study carried out to utilize waste
plastics(in the form of strips) obtained from milk pouches in the pavement
constructions (Chandrakaran 2004) , pilot level studies using industrial PVC scrap
to develop PVC board (Agarwal 2004).Re engineered plastics are used for solving
the solid waste management problems to great extent.
This study attempt is to give a contribution to the effective use of
domestic waste plastics in concrete in order to prevent the environmental strains
caused by them, also to limit the consumption of high amount of natural resources.
5
CHAPTER 3
EXPERIMENTAL WORK PHASE
3.1 INTRODUCTION
In this chapter, a work plan is formulated, which outlines the entire
procedure carried out during the experimental investigation.
3.2 WORK PLAN
The experimental investigation was carried out in different phases.
The various phases involved have been explained as follows.
The first phase involved the collection of materials Natural Poly
Propylene (NPP), Polyethylene Terephthalate (PET).
The second phase involved the calculation of a suitable design mix
for plain cement concrete so that it satisfies the requirements of a high strength
concrete, when coarse aggregate is replaced with suitable recycled plastics.
The third phase included the casting, curing and testing of the
plain cement concrete cubes and beams, recycled plastics cubes and beams.
A general overview of the phases involved is shown in figure 3.1
6
Fig 3.1 phases of the experimental work
Materials collection
(NPP, PET)
Mix Proportion
Casting
Plain
Cement
Concrete
NPP
Mixed
Concrete
PET Mixed
Concrete
Study of Strength properties
1.Flexural Strength
2.CompressionStrength
Analysis Of Results
Conclusion
7
CHAPTER 4
RESULTS AND DISCUSSION
4.1 TEST RESULTS
4.1.1 Compressive Strength
Most of the desirable characteristics properties of concrete
are qualitatively related to its compressive strength. Therefore it is necessary to
calculate the performance and strength of the concrete. The compressive strength is
calculated from the failure load divided by the cross sectional area resisting the
load and reported in units of Mpa.
4.1.1.1 COMPRESSIVE STRENGTH OF PLAIN CEMENT
CONCRETE (PCC) CUBE
NPP = 0%
PET= 0%
Table 4.1 Compressive strength of plain cement concrete cube
Specimen Identity
Compressive strength
14 days (N/mm²)
Compressive strength
28 days (N/mm²)
PCC 16.70 24.20
PCC 21.00 26.60
PCC 20.70 25.60
Average Value 19.46 25.46
8
4.1.1.2 COMPRESSIVE STRENGTH FOR 1% NPP
REPLACEMENT
NPP=1% PET=0%
Table 4.2 Compressive strength of NPP (1%) mixed concrete cube
SpecimenIdentity Compressive Strength
14 days (N/mm²)
Compressive Strength
28 days (N/mm²)
NPP 1% 21.40 31.50
NPP 1% 19.00 30.10
NPP 1% 20.00 32.50
Average Value 20.13 31.36
4.1.1.3 COMPRESSIVE STRENGTH FOR 3% NPP
REPLACEMENT
NPP= 3% PET= 0%
Table 4.3 Compressive strength of NPP (3%) mixed concrete cube
SpecimenIdentity Compressive Strength
14 days (N/mm²)
Compressive Strength
28 days(N/mm²)
NPP 3% 21.00 32.50
NPP 3% 20.05 29.20
NPP 3% 21.09 32.50
Average Value 20.71 31.40
9
4.1.1.4 COMPRESSIVE STRENGTH FOR 5% NPP
REPLACEMENT
NPP= 5% PET= 0%
Table 4.4 Compressive strength of NPP (5%) mixed concrete cube
SpecimenIdentity Compressive Strength
14 days (N/mm²)
Compressive Strength
28 days(N/mm²)
NPP 5% 10.59 20.28
NPP 5% 9.75 20.55
NPP 5% 10.07 20.64
Average Value 10.13 20.49
Table 4.5 Compressive strength of NPP specimens
Specimen Identity Compressive Strength
14 days (N/mm²)
Compressive strength
28 days (N/mm²)
PCC 19.46 25.46
NPP 1% 20.13 31.36
NPP 3% 20.71 31.40
NPP 5% 10.13 20.49
10
Fig 4.1 Compressive strengthof PCC & NPP
Fig 4.2 ComparisonbetweenCompressive Strength of PCC & NPP
19.46 20.13
20.71
10.13
25.46
31.36
31.40
20.49
0
5
10
15
20
25
30
35
PCC NPP 1 % NPP 3% NPP 5%
CompressivestrengthN/mm²
% Replacementof NPP
28 DAYS
14 DAYS
0
5
10
15
20
25
30
35
14 DAYS 28 DAYS
19.46
25.46
20.13
31.36
20.71
31.4
10.13
20.49
CompressivectrengthN/mm²
PCC
NPP 1%
NPP 3%
NPP 5%
11
4.1.1.5 COMPRESSIVE STRENGTH FOR 1% PET
REPLACEMENT
PET= 1% NPP= 0%
Table 4.6 Compressive strength of PET (1%) mixed concrete cube
Specimen Identity Compressive Strength
14 days (N/mm²)
Compressive Strength
28 days (N/mm²)
PET 1% 19.60 26.06
PET 1% 19.43 23.45
PET 1% 20.45 27.60
Average Value 19.82 25.70
4.1.1.6 COMPRESSIVE STRENGTH FOR 3% PET
REPLACEMENT
PET= 3% NPP= 0%
Table 4.7 Compressive strength of PET (3%) mixed concrete cube
Specimen Identity Compressive Strength
14 days (N/mm²)
Compressive Strength
28 days (N/mm²)
PET 3% 21.06 32.20
PET 3% 20.05 30.50
PET 3% 20.08 29.40
Average Value 20.39 30.70
12
4.1.1.7 COMPRESSIVE STRENGTH FOR 5% PET
REPLACEMENT
PET= 5% NPP= 0%
Table 4.8 Compressive strength of PET (5%) mixed concrete cube
Specimen Identity Compressive Strength
14 days (N/mm²)
Compressive Strength
28 days (N/mm²)
PET 5% 8.70 13.50
PET 5% 8.90 13.90
PET 5% 8.50 13.20
Average Value 8.70 13.53
Table 4.9 Compressive strength of PET specimens
Specimen Identity Compressive Strength
14 days (N/mm²)
Compressive Strength
28 days (N/mm²)
PCC 19.46 25.46
PET 1% 19.82 25.70
PET 3% 20.39 30.70
PET 5% 8.70 13.53
13
Fig 4.3 Compressive strengthof PCC & PET
Fig 4.4 ComparisonbetweenCompressive Strength of PCC & PET
19.46 19.82 20.39
8.7
25.46 25.70
30.70
13.53
0
5
10
15
20
25
30
35
PCC PET 1% PET 3% PET 5%
CompressivestrengthN/mm²
% Replacementof PET
28 DAYS
14 DAYS
0
5
10
15
20
25
30
35
14 DAYS 28 DAYS
19.46
25.46
19.82
25.7
20.39
30.7
8.7
13.53
CompressivestrengthN/mm²
PCC
PET 1%
PET3%
PET 5%
14
Table 4.10 ComparisonbetweenCompressive Strengthof PCC, NPP & PET
for 14 days and 28 days
Compressive Strength of PCC for 14 days= 19.46 N/mm²
Compressive Strength of PCC for 28 days= 25.46 N/mm²
Specimen
Identity
% Replacement of Recycled Plastic
1% 3% 5%
14 days 28 days 14 days 28 days 14 days 28 days
NPP 20.13 31.36 20.71 31.40 10.13 20.49
PET 19.82 25.70 20.39 30.70 8.70 13.53
Fig 4.5 ComparisonbetweenCompressive Strengthof NPP & PET for 14 days
19.46
20.13 20.71
10.13
19.82 20.39
8.70
0
5
10
15
20
25
0% 1% 3% 5%
CompressiveStrengthN/mm²
% Replacementof NPP& PET
PET
NPP
15
Fig 4.6 Comparisonbetween Compressive Strengthof PCC, NPP & PET for
14 days
Fig 4.7 ComparisonbetweenCompressive Strength of NPP & PET for 28 days
0
5
10
15
20
25
0% 1% 3% 5%
19.46
19.46
19.46
19.46
0
20.13 20.71
10.13
0
19.82 20.39
8.7
CompressivestrengthN/mm²
% Replacementof NPP& PET
PCC
NPP
PET
25.46
31.36 31.4
20.49
25.70
30.70
13.53
0
5
10
15
20
25
30
35
0% 1% 3% 5%
CompressivestrengthN/mm²
% Replacementof NPP& PET
PET
NPP
16
Fig 4.8 ComparisonbetweenCompressive Strengthof PCC, NPP & PET for
28 days
0
5
10
15
20
25
30
35
0% 1% 3% 5%
25.46 25.46 25.46 25.46
0
31.36 31.4
20.49
0
25.7
30.7
13.53
CompressivestrengthN/mm²
% Replacementof NPP& PET
PCC
NPP
PET
17
4.1.2 Flexuralstrength
It is the ability of a beam or slab to resist failure in bending. It is
measured by loading un- reinforced concrete beams with a span three times the
depth. Flexural strength is expressed as Mpa.
4.1.2.1 FLEXURAL STRENGTH OF PLAIN CEMENT
CONCRETE (PCC) BEAM
NPP= 0%
PET= 0%
Table 4.11 Flexural strength of plain cement concrete beam
Specimen Identity Flexural Strength
14 days (N/mm²)
Flexural Strength
28 days (N/mm²)
PCC 0% 2.728 5.437
PCC 0% 2.895 5.800
PCC 0% 2.665 5.357
Average Value 2.762 5.530
18
4.1.2.2 FLEXURAL STRENGTH FOR 1% NPP REPLACEMENT
NPP= 1% PET= 0%
Table 4.12 Flexural strength of NPP (1%) mixed concrete beam
Specimen Identity Flexural Strength
14 days (N/mm²)
Flexural Strength
28 days (N/mm²)
NPP 1% 2.795 5.300
NPP 1% 3.012 6.005
NPP 1% 3.150 6.100
Average Value 2.985 5.801
4.1.2.3 FLEXURAL STRENGTH FOR 3% NPP REPLACEMENT
NPP= 3% PET= 0%
Table 4.13 Flexural strength of NPP (3%) mixed concrete beam
Specimen Identity Flexural Strength
14 days (N/mm²)
Flexural Strength
28 days (N/mm²)
NPP 3% 2.673 5.950
NPP 3% 3.620 5.854
NPP 3% 2.795 5.900
Average Value 3.029 5.901
19
4.1.2.4 FLEXURAL STRENGTH FOR 5% NPP REPLACEMENT
NPP= 5% PET= 0%
Table 4.14 Flexural strength of NPP (5%) mixed concrete beam
Specimen Identity Flexural Strength
14 days (N/mm²)
Flexural Strength
28 days (N/mm²)
NPP 5% 2.360 4.725
NPP 5% 2.421 4.850
NPP 5% 2.364 4.730
Average Value 2.381 4.768
Table 4.15 Flexural strength of NPP specimens
Specimen Identity Flexural Strength
14 days (N/mm²)
Flexural Strength
28 days (N/mm²)
PCC 2.762 5.530
NPP 1% 2.985 5.801
NPP 3% 3.029 5.901
NPP 5% 2.381 4.768
20
Fig 4.9 Flexural Strength of PCC & NPP
Fig 4.10 ComparisonbetweenFlexuralStrength of PCC & PET
2.762 2.985 3.029 2.381
5.530
5.801 5.901
4.768
0
1
2
3
4
5
6
7
PCC NPP 1% NPP 3% NPP 5%
FlexuralStrengthN/mm²
% Replacementof NPP
28 DAYS
14 DAYS
0
1
2
3
4
5
6
14 DAYS 28 DAYS
2.762
5.53
2.985
5.801
3.029
5.901
2.381
4.417
FlexuralstrengthN/mm²
PCC
NPP 1%
NPP 3%
NPP 5%
21
4.1.2.5 FLEXURAL STRENGTH FOR 1% PET REPLACEMENT
PET= 1% NPP= 0%
Table 4.16 Flexural strength of PET (1%) mixed concrete beam
Specimen Identity Flexural Strength
14 days (N/mm²)
Flexural Strength
28 days (N/mm²)
PET 1% 2.695 5.502
PET 1% 2.675 5.525
PET 1% 2.950 5.569
Average Value 2.773 5.532
4.1.2.6 FLEXURAL STRENGTH FOR 3% PET REPLACEMENT
PET= 3% NPP= 0%
Table 4.17 Flexural strength of PET (3%) mixed concrete beam
Specimen Identity Flexural Strength
14 days (N/mm²)
Flexural Strength
28 days (N/mm²)
PET 3% 2.669 5.350
PET 3% 2.785 5.937
PET 3% 2.935 5.401
Average Value 2.796 5.562
22
4.1.2.7 FLEXURAL STRENGTH FOR 5% PET REPLACEMENT
PET= 5% NPP= 0%
Table 4.18 Flexural strength of PET (5%) mixed concrete beam
Specimen Identity Flexural Strength
14 days (N/mm²)
Flexural Strength
28 days (N/mm²)
PET 5% 2.107 4.205
PET 5% 2.440 4.675
PET 5% 2.175 4.373
Average Value 2.240 4.417
Table 4.19 Flexural strength of PET specimens
Specimen Identity Flexural Strength
14 days (N/mm²)
Flexural Strength
28 days (N/mm²)
PCC 2.762 5.530
PET 1% 2.773 5.532
PET 3% 2.796 5.562
PET 5% 2.240 4.417
23
Fig 4.11 FlexuralStrength of PCC & PET
Fig 4.12 ComparisonbetweenFlexuralStrength of PCC & PET
2.762 2.773 2.796
2.24
5.530 5.532 5.562
4.417
0
1
2
3
4
5
6
PCC PET 1% PET 3% PET 5%
FlexuralStrengthN/mm²
% Replacementof PET
28 DAYS
14 DAYS
0
1
2
3
4
5
6
14 DAYS 28 DAYS
2.762
5.53
2.773
5.532
2.796
5.562
2.24
4.768
FlexuralStrengthN/mm²
PCC
PET 1%
PET 3%
PET 5%
24
Table 4.20 ComparisonbetweenFlexural Strength of PCC, NPP & PET for
14 days and 28 days
Flexural Strength of PCC for 14 days= 2.762 N/mm²
Flexural Strength of PCC for 28 days= 5.530 N/mm²
Specimen
Identity
% Replacement of Recycled Plastic
1% 3% 5%
14 days 28 days 14 days 28 days 14 days 28 days
NPP 2.985 5.801 3.029 5.901 2.381 4.768
PET 2.773 5.532 2.796 5.562 2.240 4.417
Fig 4.13 ComparisonbetweenFlexuralStrength of NPP & PET for 14 days
2.762
2.985 3.029
2.3812.773 2.796
2.240
0
0.5
1
1.5
2
2.5
3
3.5
0% 1% 3% 5%
FlexuralStrengthN/mm²
% Replacementof NPP& PET
PET
NPP
25
Fig 4.14 ComparisonbetweenFlexuralStrength of PCC, NPP & PET for
14 days
Fig 4.15 ComparisonbetweenFlexuralStrength of NPP & PET for 28 days
0
0.5
1
1.5
2
2.5
3
3.5
0% 1% 3% 5%
2.762 2.762 2.762 2.762
0
2.985 3.029
2.381
0
2.773 2.796
2.24
FlexuralstrengthN/mm²
% Replacement of NPP & PET
PCC
NPP
PET
5.53
5.801 5.901
4.7685.532 5.562
4.417
0
1
2
3
4
5
6
7
0% 1% 3% 5%
FlexuralStrengthN/mm²
% Replacementof NPP& PET
PET
NPP
26
Fig 4.16 ComparisonbetweenFlexural Strength of PCC, NPP & PET for
28 days
0
1
2
3
4
5
6
0% 1% 3% 5%
5.53 5.53 5.53 5.53
0
5.801 5.901
4.768
0
5.532 5.562
4.417
FlexuralStrengthN/mm²
% Replacementof NPP& PET
PCC
NPP
PET
27
CHAPTER 5
CONCLUSION
The project intended to find the effective ways to reutilize the plastic
waste particles as concrete aggregate. Analysis of the strength characteristics of
concrete containing recycled plastic gave the following results.
 It is identified that plastic waste can be disposed byusing them
as construction materials.
 Since the Recycled Plastic is not suitable to replace fine
aggregate it is used to replace the coarseaggregate.
 All these forms have smoothsurface and hence require surface
roughening treatment for better bond characteristics.
 From the results it can be concluded that the compressive
strength gradually increases as the percentage of replacement of
Natural Poly Propylene (NPP) by weight of coarse aggregate
also increase and attains a peak value at 3% replacement of NPP
with 18.91% increase in compressive strength.
 Similarly the flexural strength of the NPP mixed concrete beam
seems to increase as the 3% of NPP replaced in concrete. The
maximum increase in flexural strength was found to be 6.28%.
 Hence to achieve a high compressive strength and flexural
strength it is recommended that coarseaggregate can be
replaced with 3% of NPP by its weight.

PERFORMANCE STUDY ON RECYCLED PLASTICS IN CONCRETE

  • 1.
    1 PERFORMANCE STUDY ONRECYCLED PLASTICS IN CONCRETE 1. INTRODUCTION 1.1 Background of plastic 1.2 Need for study 1.3 Scope and Objectives 2. LITERATURE REVIEW 2.1 Recycled plastic 3. EXPERIMENTAL WORK PHASE 3.1 Introduction 3.2 Work plan 3.3 Scheme of the work 4. RESULTS AND DISCUSSION 4.1 Test results 4.1.1 Compressive strength 4.1.2Flexural strength 5. CONCLUSION
  • 2.
    2 CHAPTER 1 INTRODUCTION 1.1 BACKGROUND OF PLASTIC The changed life style and endlessly increasing population has resulted in a significant rise in the quantity of plastic waste. The world’s annual consumption of plastic materials has increased from around 5million tons in the 1950’s to nearly 100 million tons in recent times, resulting in a significant increase in the amount of plastic waste generation. Out of this waste , a significant part is recycled but the majority of post - consumer plastic wastes , like shampoo sachets, carry – bags , nitro packs , milk and water pouches etc., though recyclable, remains comparatively untouched as they are difficult to separate from household garbage. In most of the cases, suchpost – consumer waste either litters all around or is disposed offby land filling. The disposalof post – consumer plastic waste in this manner poses significant environmental hazards as it results in reduction in soil fertility , reduction in water percolation , emission of toxic gases , health hazard to animals and birds consuming the wastes , poordrainage due to land fill , pollution of ground water due to leaching of chemicals from these waste products etc.Looking to the global issue of environmental pollution by post – consumer plastic waste , research efforts have been focused on consuming this waste on massive scale in efficient and environmental friendly manner . Researchers planned to use plastic waste in form of concrete ingredient as the concrete is second mostsought material by human beings after water . The use of post – consumer plastic waste in concrete will not only be its safe disposal
  • 3.
    3 method but mayalso improve the concrete properties like tensile strength , chemical resistance , drying shrinkage and creep on short and long term basis. 1.2 NEED FOR STUDY Nowadays one of the major problems in construction industries is insufficient and unavailability of construction materials , on the other side the main environmental problem is the disposalof the waste plastics. In this experimental study , an attempt has been made to use the plastics in concrete and studies have been conducted to focus on the behavior of flexural and compressionmembers under various proportions of plastics. Types of plastics will be selected and mixed with concrete in various proportions and the specimens are casted and tested for its compression and flexural strength respectively. 1.3 SCOPE AND OBJECTIVES The scopeofthis work is limited to the development of a suitable mix design and to compare the compressibility and flexural aspectof Natural Poly Propylene (NPP) mixed concrete and Polyethylene Terephthalate (PET) mixed concrete against the plain cement concrete. The main objective of this project is to enhance the best environmental alternative for solving the problem of disposal. The development of new construction materials using recycled plastics is important to both the constructions and the plastic recycling industries.
  • 4.
    4 CHAPTER 2 LITERATURE REVIEW 2.1RECYCLED PLASTICS Plastics are the organic polymer materials having carbonas the common element in their make up. The polymers consistof combination of carbon with oxygen , hydrogen , nitrogen and other organic substances. Plastic are normally stable and not bio – degradable, so , their disposalposes problems. Research works are going on in make use of plastic wastes effectively as additives in bitumen mixes for the road pavements (Lakshmipathy et., al, 2003) , (Vasudevan 2004) , repair and upgradation of reinforced concrete silos using fiber reinforced plastics (FRP), (Bhedasgaonkaret., al 2004). A laboratory experimental study carried out to utilize waste plastics(in the form of strips) obtained from milk pouches in the pavement constructions (Chandrakaran 2004) , pilot level studies using industrial PVC scrap to develop PVC board (Agarwal 2004).Re engineered plastics are used for solving the solid waste management problems to great extent. This study attempt is to give a contribution to the effective use of domestic waste plastics in concrete in order to prevent the environmental strains caused by them, also to limit the consumption of high amount of natural resources.
  • 5.
    5 CHAPTER 3 EXPERIMENTAL WORKPHASE 3.1 INTRODUCTION In this chapter, a work plan is formulated, which outlines the entire procedure carried out during the experimental investigation. 3.2 WORK PLAN The experimental investigation was carried out in different phases. The various phases involved have been explained as follows. The first phase involved the collection of materials Natural Poly Propylene (NPP), Polyethylene Terephthalate (PET). The second phase involved the calculation of a suitable design mix for plain cement concrete so that it satisfies the requirements of a high strength concrete, when coarse aggregate is replaced with suitable recycled plastics. The third phase included the casting, curing and testing of the plain cement concrete cubes and beams, recycled plastics cubes and beams. A general overview of the phases involved is shown in figure 3.1
  • 6.
    6 Fig 3.1 phasesof the experimental work Materials collection (NPP, PET) Mix Proportion Casting Plain Cement Concrete NPP Mixed Concrete PET Mixed Concrete Study of Strength properties 1.Flexural Strength 2.CompressionStrength Analysis Of Results Conclusion
  • 7.
    7 CHAPTER 4 RESULTS ANDDISCUSSION 4.1 TEST RESULTS 4.1.1 Compressive Strength Most of the desirable characteristics properties of concrete are qualitatively related to its compressive strength. Therefore it is necessary to calculate the performance and strength of the concrete. The compressive strength is calculated from the failure load divided by the cross sectional area resisting the load and reported in units of Mpa. 4.1.1.1 COMPRESSIVE STRENGTH OF PLAIN CEMENT CONCRETE (PCC) CUBE NPP = 0% PET= 0% Table 4.1 Compressive strength of plain cement concrete cube Specimen Identity Compressive strength 14 days (N/mm²) Compressive strength 28 days (N/mm²) PCC 16.70 24.20 PCC 21.00 26.60 PCC 20.70 25.60 Average Value 19.46 25.46
  • 8.
    8 4.1.1.2 COMPRESSIVE STRENGTHFOR 1% NPP REPLACEMENT NPP=1% PET=0% Table 4.2 Compressive strength of NPP (1%) mixed concrete cube SpecimenIdentity Compressive Strength 14 days (N/mm²) Compressive Strength 28 days (N/mm²) NPP 1% 21.40 31.50 NPP 1% 19.00 30.10 NPP 1% 20.00 32.50 Average Value 20.13 31.36 4.1.1.3 COMPRESSIVE STRENGTH FOR 3% NPP REPLACEMENT NPP= 3% PET= 0% Table 4.3 Compressive strength of NPP (3%) mixed concrete cube SpecimenIdentity Compressive Strength 14 days (N/mm²) Compressive Strength 28 days(N/mm²) NPP 3% 21.00 32.50 NPP 3% 20.05 29.20 NPP 3% 21.09 32.50 Average Value 20.71 31.40
  • 9.
    9 4.1.1.4 COMPRESSIVE STRENGTHFOR 5% NPP REPLACEMENT NPP= 5% PET= 0% Table 4.4 Compressive strength of NPP (5%) mixed concrete cube SpecimenIdentity Compressive Strength 14 days (N/mm²) Compressive Strength 28 days(N/mm²) NPP 5% 10.59 20.28 NPP 5% 9.75 20.55 NPP 5% 10.07 20.64 Average Value 10.13 20.49 Table 4.5 Compressive strength of NPP specimens Specimen Identity Compressive Strength 14 days (N/mm²) Compressive strength 28 days (N/mm²) PCC 19.46 25.46 NPP 1% 20.13 31.36 NPP 3% 20.71 31.40 NPP 5% 10.13 20.49
  • 10.
    10 Fig 4.1 Compressivestrengthof PCC & NPP Fig 4.2 ComparisonbetweenCompressive Strength of PCC & NPP 19.46 20.13 20.71 10.13 25.46 31.36 31.40 20.49 0 5 10 15 20 25 30 35 PCC NPP 1 % NPP 3% NPP 5% CompressivestrengthN/mm² % Replacementof NPP 28 DAYS 14 DAYS 0 5 10 15 20 25 30 35 14 DAYS 28 DAYS 19.46 25.46 20.13 31.36 20.71 31.4 10.13 20.49 CompressivectrengthN/mm² PCC NPP 1% NPP 3% NPP 5%
  • 11.
    11 4.1.1.5 COMPRESSIVE STRENGTHFOR 1% PET REPLACEMENT PET= 1% NPP= 0% Table 4.6 Compressive strength of PET (1%) mixed concrete cube Specimen Identity Compressive Strength 14 days (N/mm²) Compressive Strength 28 days (N/mm²) PET 1% 19.60 26.06 PET 1% 19.43 23.45 PET 1% 20.45 27.60 Average Value 19.82 25.70 4.1.1.6 COMPRESSIVE STRENGTH FOR 3% PET REPLACEMENT PET= 3% NPP= 0% Table 4.7 Compressive strength of PET (3%) mixed concrete cube Specimen Identity Compressive Strength 14 days (N/mm²) Compressive Strength 28 days (N/mm²) PET 3% 21.06 32.20 PET 3% 20.05 30.50 PET 3% 20.08 29.40 Average Value 20.39 30.70
  • 12.
    12 4.1.1.7 COMPRESSIVE STRENGTHFOR 5% PET REPLACEMENT PET= 5% NPP= 0% Table 4.8 Compressive strength of PET (5%) mixed concrete cube Specimen Identity Compressive Strength 14 days (N/mm²) Compressive Strength 28 days (N/mm²) PET 5% 8.70 13.50 PET 5% 8.90 13.90 PET 5% 8.50 13.20 Average Value 8.70 13.53 Table 4.9 Compressive strength of PET specimens Specimen Identity Compressive Strength 14 days (N/mm²) Compressive Strength 28 days (N/mm²) PCC 19.46 25.46 PET 1% 19.82 25.70 PET 3% 20.39 30.70 PET 5% 8.70 13.53
  • 13.
    13 Fig 4.3 Compressivestrengthof PCC & PET Fig 4.4 ComparisonbetweenCompressive Strength of PCC & PET 19.46 19.82 20.39 8.7 25.46 25.70 30.70 13.53 0 5 10 15 20 25 30 35 PCC PET 1% PET 3% PET 5% CompressivestrengthN/mm² % Replacementof PET 28 DAYS 14 DAYS 0 5 10 15 20 25 30 35 14 DAYS 28 DAYS 19.46 25.46 19.82 25.7 20.39 30.7 8.7 13.53 CompressivestrengthN/mm² PCC PET 1% PET3% PET 5%
  • 14.
    14 Table 4.10 ComparisonbetweenCompressiveStrengthof PCC, NPP & PET for 14 days and 28 days Compressive Strength of PCC for 14 days= 19.46 N/mm² Compressive Strength of PCC for 28 days= 25.46 N/mm² Specimen Identity % Replacement of Recycled Plastic 1% 3% 5% 14 days 28 days 14 days 28 days 14 days 28 days NPP 20.13 31.36 20.71 31.40 10.13 20.49 PET 19.82 25.70 20.39 30.70 8.70 13.53 Fig 4.5 ComparisonbetweenCompressive Strengthof NPP & PET for 14 days 19.46 20.13 20.71 10.13 19.82 20.39 8.70 0 5 10 15 20 25 0% 1% 3% 5% CompressiveStrengthN/mm² % Replacementof NPP& PET PET NPP
  • 15.
    15 Fig 4.6 ComparisonbetweenCompressive Strengthof PCC, NPP & PET for 14 days Fig 4.7 ComparisonbetweenCompressive Strength of NPP & PET for 28 days 0 5 10 15 20 25 0% 1% 3% 5% 19.46 19.46 19.46 19.46 0 20.13 20.71 10.13 0 19.82 20.39 8.7 CompressivestrengthN/mm² % Replacementof NPP& PET PCC NPP PET 25.46 31.36 31.4 20.49 25.70 30.70 13.53 0 5 10 15 20 25 30 35 0% 1% 3% 5% CompressivestrengthN/mm² % Replacementof NPP& PET PET NPP
  • 16.
    16 Fig 4.8 ComparisonbetweenCompressiveStrengthof PCC, NPP & PET for 28 days 0 5 10 15 20 25 30 35 0% 1% 3% 5% 25.46 25.46 25.46 25.46 0 31.36 31.4 20.49 0 25.7 30.7 13.53 CompressivestrengthN/mm² % Replacementof NPP& PET PCC NPP PET
  • 17.
    17 4.1.2 Flexuralstrength It isthe ability of a beam or slab to resist failure in bending. It is measured by loading un- reinforced concrete beams with a span three times the depth. Flexural strength is expressed as Mpa. 4.1.2.1 FLEXURAL STRENGTH OF PLAIN CEMENT CONCRETE (PCC) BEAM NPP= 0% PET= 0% Table 4.11 Flexural strength of plain cement concrete beam Specimen Identity Flexural Strength 14 days (N/mm²) Flexural Strength 28 days (N/mm²) PCC 0% 2.728 5.437 PCC 0% 2.895 5.800 PCC 0% 2.665 5.357 Average Value 2.762 5.530
  • 18.
    18 4.1.2.2 FLEXURAL STRENGTHFOR 1% NPP REPLACEMENT NPP= 1% PET= 0% Table 4.12 Flexural strength of NPP (1%) mixed concrete beam Specimen Identity Flexural Strength 14 days (N/mm²) Flexural Strength 28 days (N/mm²) NPP 1% 2.795 5.300 NPP 1% 3.012 6.005 NPP 1% 3.150 6.100 Average Value 2.985 5.801 4.1.2.3 FLEXURAL STRENGTH FOR 3% NPP REPLACEMENT NPP= 3% PET= 0% Table 4.13 Flexural strength of NPP (3%) mixed concrete beam Specimen Identity Flexural Strength 14 days (N/mm²) Flexural Strength 28 days (N/mm²) NPP 3% 2.673 5.950 NPP 3% 3.620 5.854 NPP 3% 2.795 5.900 Average Value 3.029 5.901
  • 19.
    19 4.1.2.4 FLEXURAL STRENGTHFOR 5% NPP REPLACEMENT NPP= 5% PET= 0% Table 4.14 Flexural strength of NPP (5%) mixed concrete beam Specimen Identity Flexural Strength 14 days (N/mm²) Flexural Strength 28 days (N/mm²) NPP 5% 2.360 4.725 NPP 5% 2.421 4.850 NPP 5% 2.364 4.730 Average Value 2.381 4.768 Table 4.15 Flexural strength of NPP specimens Specimen Identity Flexural Strength 14 days (N/mm²) Flexural Strength 28 days (N/mm²) PCC 2.762 5.530 NPP 1% 2.985 5.801 NPP 3% 3.029 5.901 NPP 5% 2.381 4.768
  • 20.
    20 Fig 4.9 FlexuralStrength of PCC & NPP Fig 4.10 ComparisonbetweenFlexuralStrength of PCC & PET 2.762 2.985 3.029 2.381 5.530 5.801 5.901 4.768 0 1 2 3 4 5 6 7 PCC NPP 1% NPP 3% NPP 5% FlexuralStrengthN/mm² % Replacementof NPP 28 DAYS 14 DAYS 0 1 2 3 4 5 6 14 DAYS 28 DAYS 2.762 5.53 2.985 5.801 3.029 5.901 2.381 4.417 FlexuralstrengthN/mm² PCC NPP 1% NPP 3% NPP 5%
  • 21.
    21 4.1.2.5 FLEXURAL STRENGTHFOR 1% PET REPLACEMENT PET= 1% NPP= 0% Table 4.16 Flexural strength of PET (1%) mixed concrete beam Specimen Identity Flexural Strength 14 days (N/mm²) Flexural Strength 28 days (N/mm²) PET 1% 2.695 5.502 PET 1% 2.675 5.525 PET 1% 2.950 5.569 Average Value 2.773 5.532 4.1.2.6 FLEXURAL STRENGTH FOR 3% PET REPLACEMENT PET= 3% NPP= 0% Table 4.17 Flexural strength of PET (3%) mixed concrete beam Specimen Identity Flexural Strength 14 days (N/mm²) Flexural Strength 28 days (N/mm²) PET 3% 2.669 5.350 PET 3% 2.785 5.937 PET 3% 2.935 5.401 Average Value 2.796 5.562
  • 22.
    22 4.1.2.7 FLEXURAL STRENGTHFOR 5% PET REPLACEMENT PET= 5% NPP= 0% Table 4.18 Flexural strength of PET (5%) mixed concrete beam Specimen Identity Flexural Strength 14 days (N/mm²) Flexural Strength 28 days (N/mm²) PET 5% 2.107 4.205 PET 5% 2.440 4.675 PET 5% 2.175 4.373 Average Value 2.240 4.417 Table 4.19 Flexural strength of PET specimens Specimen Identity Flexural Strength 14 days (N/mm²) Flexural Strength 28 days (N/mm²) PCC 2.762 5.530 PET 1% 2.773 5.532 PET 3% 2.796 5.562 PET 5% 2.240 4.417
  • 23.
    23 Fig 4.11 FlexuralStrengthof PCC & PET Fig 4.12 ComparisonbetweenFlexuralStrength of PCC & PET 2.762 2.773 2.796 2.24 5.530 5.532 5.562 4.417 0 1 2 3 4 5 6 PCC PET 1% PET 3% PET 5% FlexuralStrengthN/mm² % Replacementof PET 28 DAYS 14 DAYS 0 1 2 3 4 5 6 14 DAYS 28 DAYS 2.762 5.53 2.773 5.532 2.796 5.562 2.24 4.768 FlexuralStrengthN/mm² PCC PET 1% PET 3% PET 5%
  • 24.
    24 Table 4.20 ComparisonbetweenFlexuralStrength of PCC, NPP & PET for 14 days and 28 days Flexural Strength of PCC for 14 days= 2.762 N/mm² Flexural Strength of PCC for 28 days= 5.530 N/mm² Specimen Identity % Replacement of Recycled Plastic 1% 3% 5% 14 days 28 days 14 days 28 days 14 days 28 days NPP 2.985 5.801 3.029 5.901 2.381 4.768 PET 2.773 5.532 2.796 5.562 2.240 4.417 Fig 4.13 ComparisonbetweenFlexuralStrength of NPP & PET for 14 days 2.762 2.985 3.029 2.3812.773 2.796 2.240 0 0.5 1 1.5 2 2.5 3 3.5 0% 1% 3% 5% FlexuralStrengthN/mm² % Replacementof NPP& PET PET NPP
  • 25.
    25 Fig 4.14 ComparisonbetweenFlexuralStrengthof PCC, NPP & PET for 14 days Fig 4.15 ComparisonbetweenFlexuralStrength of NPP & PET for 28 days 0 0.5 1 1.5 2 2.5 3 3.5 0% 1% 3% 5% 2.762 2.762 2.762 2.762 0 2.985 3.029 2.381 0 2.773 2.796 2.24 FlexuralstrengthN/mm² % Replacement of NPP & PET PCC NPP PET 5.53 5.801 5.901 4.7685.532 5.562 4.417 0 1 2 3 4 5 6 7 0% 1% 3% 5% FlexuralStrengthN/mm² % Replacementof NPP& PET PET NPP
  • 26.
    26 Fig 4.16 ComparisonbetweenFlexuralStrength of PCC, NPP & PET for 28 days 0 1 2 3 4 5 6 0% 1% 3% 5% 5.53 5.53 5.53 5.53 0 5.801 5.901 4.768 0 5.532 5.562 4.417 FlexuralStrengthN/mm² % Replacementof NPP& PET PCC NPP PET
  • 27.
    27 CHAPTER 5 CONCLUSION The projectintended to find the effective ways to reutilize the plastic waste particles as concrete aggregate. Analysis of the strength characteristics of concrete containing recycled plastic gave the following results.  It is identified that plastic waste can be disposed byusing them as construction materials.  Since the Recycled Plastic is not suitable to replace fine aggregate it is used to replace the coarseaggregate.  All these forms have smoothsurface and hence require surface roughening treatment for better bond characteristics.  From the results it can be concluded that the compressive strength gradually increases as the percentage of replacement of Natural Poly Propylene (NPP) by weight of coarse aggregate also increase and attains a peak value at 3% replacement of NPP with 18.91% increase in compressive strength.  Similarly the flexural strength of the NPP mixed concrete beam seems to increase as the 3% of NPP replaced in concrete. The maximum increase in flexural strength was found to be 6.28%.  Hence to achieve a high compressive strength and flexural strength it is recommended that coarseaggregate can be replaced with 3% of NPP by its weight.