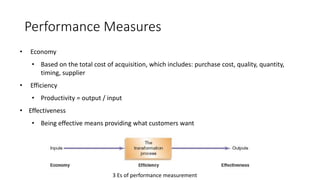
Performance Measurement
and Process Analysis
Learning Objectives
To understand and critically analyse
• Performance measures
• Performance measurement systems
• Performance standards
• Process analysis and process improvement
The Strategic Importance of Performance
Measurement
• Plays a central role in operations management
• The means of linking strategy to action
• Will influence people’s behaviour
Performance Measures
• Economy
• Based on the total cost of acquisition, which includes: purchase cost, quality, quantity,
timing, supplier
• Efficiency
• Productivity = output / input
• Effectiveness
• Being effective means providing what customers want
3 Es of performance measurement
Performance Measurement Systems
The balanced scorecard
Performance Standards
• Standards may be based upon:
• The organization’s past performance
• The organization’s own targets
• Competitors’ performance
• Best practice
• Market requirements
Benchmarking
• Acts as a springboard to drive performance improvements by:
• Signals the importance of activities to the organization
• Encompassing the study of the practices of the benchmarked
organizations
• There are three main approaches to practice benchmarking:
• Internal benchmarking
• Competitive benchmarking
• Best practice benchmarking
Performance Improvement
• Three key issues
• The scale and scope of the performance improvement required
• The priorities for performance improvement
• The approach to making the performance improvement
Determining the Scale and Scope
• The choice of performance measures used within an organization
sets the scope of performance improvement being considered.
• The scale of improvement required will depend upon the choice of
performance standard.
Setting the Priorities
The performance importance matrix
Determining the Approach to Performance
Improvement
• Step change
• New technology
• New working methods
• Business process Reengineering
• Continuous improvement-Kaizen
Process Analysis
The set of tools used to identify opportunities for
improvement, document current processes, evaluate
processes to find performance gaps, redesign processes, and
implement desired changes.
Process Analysis Steps
Mapping processes
Flow Charts
A tool to trace the flow of information, customers, equipment and
materials through the various steps of a process.
Flow chart of consulting
Swim Lane Flowchart in Manufacturing
A visual
representation that
groups functional
areas responsible for
different sub-
processes into lanes
Service Blueprint
A special flowchart
of a service process
that shows which
steps have high
customer contact.
Delayed
flight
departures
Weather
Air traffic delays
Other Aircraft late to gate
Mechanical failures
Equipment
Passenger processing at gate
Late cabin cleaners
Unavailable cockpit crew
Late cabin crew
Personnel
Poor announcement of departures
Weight/balance sheet late
Delayed check-in procedure
Waiting for late passengers
Procedures
Late baggage to aircraft
Late fuel
Late food service
Contractor not
provided with
updated schedule
Materials
Fish Bone Analysis- Example of Delayed Flight
Departures
What is a Constraint?
• Constraint
Any factor that limits the performance of a system and restricts
its output.
• Bottleneck
A capacity constraint resource whose available capacity limits
the organization’s ability to meet the product volume or mix, or
demand fluctuations.
Theory of Constraints
1. Identify the system bottleneck(s)
2. Exploit the bottleneck(s)
3. Subordinate all other decisions to step 2
4. Elevate the bottleneck(s)
5. Do not let Inertia set in
07 - 020
Key Principles of the TOC
• The focus should be on balancing flow, not on balancing
capacity.
• Maximizing the output and efficiency of every resource may
not maximize the throughput of the entire system.
• An hour lost at a bottleneck or constrained resource is an
hour lost for the whole system.
• Inventory is only needed in front of bottlenecks and in front
of assembly and shipping points.
References
• Barnes, D. (2008). Operations Management: An International
Perspective. Cengage Learning EMEA.
• Krajewski, L. J., Malhotra, M. K., and Ritzman, L. P. (2015). Operations
Management: Processes and Supply Chains. Pearson Higher Ed.
• Slack, N., Brandon-Jones, A. and Johnston, R. (2011). Essentials of
operations management. Financial Times Prentice Hall.

Performance measurement and process analysis.pptx

  • 1.
  • 2.
    Learning Objectives To understandand critically analyse • Performance measures • Performance measurement systems • Performance standards • Process analysis and process improvement
  • 3.
    The Strategic Importanceof Performance Measurement • Plays a central role in operations management • The means of linking strategy to action • Will influence people’s behaviour
  • 4.
    Performance Measures • Economy •Based on the total cost of acquisition, which includes: purchase cost, quality, quantity, timing, supplier • Efficiency • Productivity = output / input • Effectiveness • Being effective means providing what customers want 3 Es of performance measurement
  • 5.
  • 6.
    Performance Standards • Standardsmay be based upon: • The organization’s past performance • The organization’s own targets • Competitors’ performance • Best practice • Market requirements
  • 7.
    Benchmarking • Acts asa springboard to drive performance improvements by: • Signals the importance of activities to the organization • Encompassing the study of the practices of the benchmarked organizations • There are three main approaches to practice benchmarking: • Internal benchmarking • Competitive benchmarking • Best practice benchmarking
  • 8.
    Performance Improvement • Threekey issues • The scale and scope of the performance improvement required • The priorities for performance improvement • The approach to making the performance improvement
  • 9.
    Determining the Scaleand Scope • The choice of performance measures used within an organization sets the scope of performance improvement being considered. • The scale of improvement required will depend upon the choice of performance standard.
  • 10.
    Setting the Priorities Theperformance importance matrix
  • 11.
    Determining the Approachto Performance Improvement • Step change • New technology • New working methods • Business process Reengineering • Continuous improvement-Kaizen
  • 12.
    Process Analysis The setof tools used to identify opportunities for improvement, document current processes, evaluate processes to find performance gaps, redesign processes, and implement desired changes.
  • 13.
  • 14.
  • 15.
    Flow Charts A toolto trace the flow of information, customers, equipment and materials through the various steps of a process. Flow chart of consulting
  • 16.
    Swim Lane Flowchartin Manufacturing A visual representation that groups functional areas responsible for different sub- processes into lanes
  • 17.
    Service Blueprint A specialflowchart of a service process that shows which steps have high customer contact.
  • 18.
    Delayed flight departures Weather Air traffic delays OtherAircraft late to gate Mechanical failures Equipment Passenger processing at gate Late cabin cleaners Unavailable cockpit crew Late cabin crew Personnel Poor announcement of departures Weight/balance sheet late Delayed check-in procedure Waiting for late passengers Procedures Late baggage to aircraft Late fuel Late food service Contractor not provided with updated schedule Materials Fish Bone Analysis- Example of Delayed Flight Departures
  • 19.
    What is aConstraint? • Constraint Any factor that limits the performance of a system and restricts its output. • Bottleneck A capacity constraint resource whose available capacity limits the organization’s ability to meet the product volume or mix, or demand fluctuations.
  • 20.
    Theory of Constraints 1.Identify the system bottleneck(s) 2. Exploit the bottleneck(s) 3. Subordinate all other decisions to step 2 4. Elevate the bottleneck(s) 5. Do not let Inertia set in 07 - 020
  • 21.
    Key Principles ofthe TOC • The focus should be on balancing flow, not on balancing capacity. • Maximizing the output and efficiency of every resource may not maximize the throughput of the entire system. • An hour lost at a bottleneck or constrained resource is an hour lost for the whole system. • Inventory is only needed in front of bottlenecks and in front of assembly and shipping points.
  • 22.
    References • Barnes, D.(2008). Operations Management: An International Perspective. Cengage Learning EMEA. • Krajewski, L. J., Malhotra, M. K., and Ritzman, L. P. (2015). Operations Management: Processes and Supply Chains. Pearson Higher Ed. • Slack, N., Brandon-Jones, A. and Johnston, R. (2011). Essentials of operations management. Financial Times Prentice Hall.