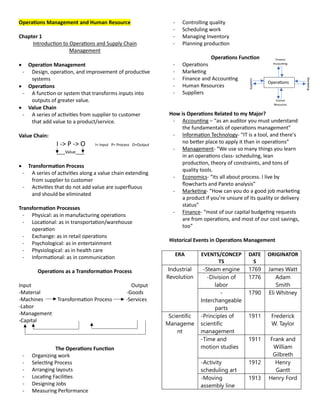
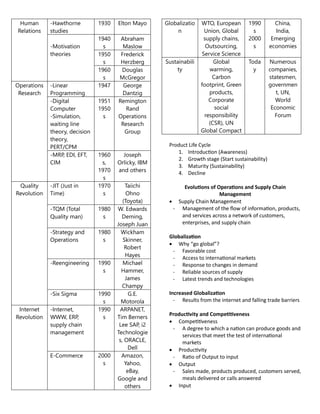
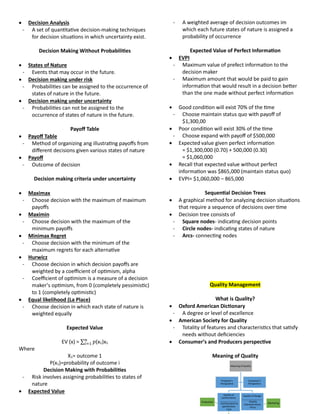
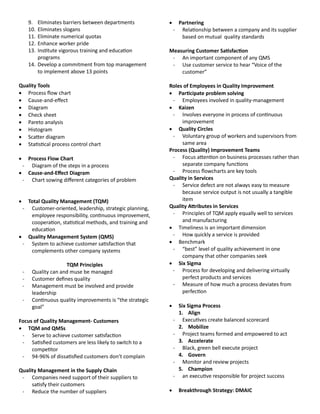
Operations Management and Human Resource
Chapter 1
Introduction to Operations and Supply Chain
Management
 Operation Management
- Design, operation, and improvement of productive
systems
 Operations
- A function or system that transforms inputs into
outputs of greater value.
 Value Chain
- A series of activities from supplier to customer
that add value to a product/service.
Value Chain:
I -> P -> O I= Input P= Process O=Output
___Value___
 Transformation Process
- A series of activities along a value chain extending
from supplier to customer
- Activities that do not add value are superfluous
and should be eliminated
Transformation Processes
- Physical: as in manufacturing operations
- Locational: as in transportation/warehouse
operation
- Exchange: as in retail operations
- Psychological: as in entertainment
- Physiological: as in health care
- Informational: as in communication
Operations as a Transformation Process
Input Output
-Material -Goods
-Machines Transformation Process -Services
-Labor
-Management
-Capital
The Operations Function
- Organizing work
- Selecting Process
- Arranging layouts
- Locating Facilities
- Designing Jobs
- Measuring Performance
- Controlling quality
- Scheduling work
- Managing Inventory
- Planning production
Operations Function
- Operations
- Marketing
- Finance and Accounting
- Human Resources
- Suppliers
How is Operations Related to my Major?
- Accounting – “as an auditor you must understand
the fundamentals of operations management”
- Information Technology- “IT is a tool, and there’s
no better place to apply it than in operations”
- Management- “We use so many things you learn
in an operations class- scheduling, lean
production, theory of constraints, and tons of
quality tools.
- Economics- “its all about process. I live by
flowcharts and Pareto analysis”
- Marketing- “How can you do a good job marketing
a product if you’re unsure of its quality or delivery
status”
- Finance- “most of our capital budgeting requests
are from operations, and most of our cost savings,
too”
Historical Events in Operations Management
ERA EVENTS/CONCEP
TS
DATE
S
ORIGINATOR
Industrial
Revolution
-Steam engine 1769 James Watt
-Division of
labor
1776 Adam
Smith
-
Interchangeable
parts
1790 Eli Whitney
Scientific
Manageme
nt
-Principles of
scientific
management
1911 Frederick
W. Taylor
-Time and
motion studies
1911 Frank and
William
Gilbreth
-Activity
scheduling art
1912 Henry
Gantt
-Moving
assembly line
1913 Henry Ford
Operations
Suppliers
Finance
Accounting
0
Human
Resources
Marketing
Human
Relations
-Hawthorne
studies
1930 Elton Mayo
-Motivation
theories
1940
s
Abraham
Maslow
1950
s
Frederick
Herzberg
1960
s
Douglas
McGregor
Operations
Research
-Linear
Programming
1947 George
Dantzig
-Digital
Computer
-Simulation,
waiting line
theory, decision
theory,
PERT/CPM
1951
1950
s
Remington
Rand
Operations
Research
Group
-MRP, EDI, EFT,
CIM
1960
s,
1970
s
Joseph
Orlicky, IBM
and others
Quality
Revolution
-JIT (Just in
Time)
1970
s
Taiichi
Ohno
(Toyota)
-TQM (Total
Quality man)
1980
s
W. Edwards
Deming,
Joseph Juan
-Strategy and
Operations
1980
s
Wickham
Skinner,
Robert
Hayes
-Reengineering 1990
s
Michael
Hammer,
James
Champy
-Six Sigma 1990
s
G.E.
Motorola
Internet
Revolution
-Internet,
WWW, ERP,
supply chain
management
1990
s
ARPANET,
Tim Berners
Lee SAP, i2
Technologie
s, ORACLE,
Dell
E-Commerce 2000
s
Amazon,
Yahoo,
eBay,
Google and
others
Globalizatio
n
WTO, European
Union, Global
supply chains,
Outsourcing,
Service Science
1990
s
2000
s
China,
India,
Emerging
economies
Sustainabili
ty
Global
warming,
Carbon
footprint, Green
products,
Corporate
social
responsibility
(CSR), UN
Global Compact
Toda
y
Numerous
companies,
statesmen,
governmen
t, UN,
World
Economic
Forum
Product Life Cycle
1. Introduction (Awareness)
2. Growth stage (Start sustainability)
3. Maturity (Sustainability)
4. Decline
Evolutions of Operations and Supply Chain
Management
 Supply Chain Management
- Management of the flow of information, products,
and services across a network of customers,
enterprises, and supply chain
Globalization
 Why “go global”?
- Favorable cost
- Access to international markets
- Response to changes in demand
- Reliable sources of supply
- Latest trends and technologies
Increased Globalization
- Results from the internet and falling trade barriers
Productivity and Competitiveness
 Competitiveness
- A degree to which a nation can produce goods and
services that meet the test of international
markets
 Productivity
- Ratio of Output to input
 Output
- Sales made, products produced, customers served,
meals delivered or calls answered
 Input
- Labor hours, investment in equipment, material
usage or square footage
Strategy and Operations
- How the mission of a company is accomplished
- Provides direction for achieving a mission
- Unites the organization
- Provides consistency in decisions
- Keep organization moving in the right direction
Strategy Formulation
1. Defining a primary task
- What is the firm in the business of doing?
- Represents the purpose of the firm
2. Answering core competencies
- What does the firm do better than anyone else?
- Processes, not products or services
3. Determining order winners and order qualifiers
- What qualifies an item to be considered for
purchase?
- What wins the order? -that is the order winner
4. Positioning the firm
- How will the firm compete?
5. Deploying the strategy
Strategic Planning
Positioning the firm
- Cost
- Speed
- Quality
- Flexibility
Positioning the Firm: Speed
 Fast moves, fast adaptations, tight linkage
- Internet
- Customers expect immediate responses
 Service organizations
- Always competed on speed
Positioning the Firm: Cost
 Waste eliminations
- Relentlessly pursuing the removal of all waste
 Examination of cost structure
- Looking at the entire cost structure of reduction
potential
 Lean production
- Providing low costs through disciplined operation
 Manufacturers
- Time based competition: build-to-order
production and efficient supply chains
 Fashion industry
- Two-week design-to-rack lead time of Spanish
retailer, Zara
Positioning the Firm: uuality
 Minimizing defect rates or conforming to design
specification
 Ritz- Carlton- one customer at a time
- Service system designed to “move heaven and
earth” to satisfy customer
- Employees empowered to satisfy a guests wish
- Teams set objectives and devices quality action
plans
 Each hotel has a quality leader
Positioning the Firm: Flexibility
 Ability to adjust to changes in product mis,
production volume, or design
 Mass communication
- Mass production of customized parts
 National Bicycle Industrial Company
- Offers 11,231,862 variations
- Delivers within two weeks at cost only 10% above
standard models
Policy Deployment
 Policy deployment
- Translates corporate strategy into measurable
objectives
 Hoshins
- Action plans generated from the policy
deployment process
Balance Scorecard
 Balance scorecard
- Measuring more than financial performance
- Finances, processes, customers, learning and
growing
 Key performance indicators
- Set of measures to help managers evaluate
performance in critical areas.
Decision Analysis
 uuantitative Method
- A set of tools for operations manager
Corporate Strategy
Mission and Vision
Operations
Strategy
Marketing
Strategy
 Decision Analysis
- A set of quantitative decision-making techniques
for decision situations in which uncertainty exist.
Decision Making Without Probabilities
 States of Nature
- Events that may occur in the future.
 Decision making under risk
- Probabilities can be assigned to the occurrence of
states of nature in the future.
 Decision making under uncertainty
- Probabilities can not be assigned to the
occurrence of states of nature in the future.
Payoff Table
 Payoff Table
- Method of organizing ang illustrating payoffs from
different decisions given various states of nature
 Payoff
- Outcome of decision
Decision making criteria under uncertainty
 Maximax
- Choose decision with the maximum of maximum
payoffs
 Maximin
- Choose decision with the maximum of the
minimum payoffs
 Minimax Regret
- Choose decision with the minimum of the
maximum regrets for each alternative
 Hurwicz
- Choose decision in which decision payoffs are
weighted by a coefficient of optimism, alpha
- Coefficient of optimism is a measure of a decision
maker’s optimism, from 0 (completely pessimistic)
to 1 (completely optimistic)
 Equal likelihood (La Place)
- Choose decision in which each state of nature is
weighted equally
Expected Value
EV (x) = ∑ 𝑝
𝑛
𝑖=1 (x1)x1
Where
X1= outcome 1
P(x1)=probability of outcome i
Decision Making with Probabilities
- Risk involves assigning probabilities to states of
nature
 Expected Value
- A weighted average of decision outcomes im
which each future states of nature is assigned a
probability of occurrence
Expected Value of Perfect Information
 EVPI
- Maximum value of prefect information to the
decision maker
- Maximum amount that would be paid to gain
information that would result in a decision better
than the one made without perfect information
 Good condition will exist 70% of the time
- Choose maintain status quo with payoff of
$1,300,00
 Poor condition will exist 30% of the time
- Choose expand with payoff of $500,000
 Expected value given perfect information
= $1,300,000 (0.70) + 500,000 (0.30)
= $1,060,000
 Recall that expected value without perfect
information was $865,000 (maintain status quo)
 EVPI= $1,060,000 – 865,000
Sequential Decision Trees
 A graphical method for analyzing decision situations
that require a sequence of decisions over time
 Decision tree consists of
- Square nodes- indicating decision points
- Circle nodes- indicating states of nature
- Arcs- connecting nodes
uuality Management
What is uuality?
 Oxford American Dictionary
- A degree or level of excellence
 American Society for uuality
- Totality of features and characteristics that satisfy
needs without deficiencies
 Consumer’s and Producers perspective
Meaning of uuality
Meaning of Quality
Quality of
conformance
_____________
- Conformance to
specification
-Cost
Production
Quality of Design
_______________
- Quality
characteristices
- Price
Marketing
Producer's
Perspective
Consumer's
Perspective
What is uuality:
Customer’s Perspective
 Fitness for use
- How well product or service does what it is
supposed to
 uuality of design
- Designing quality characteristics into a product or
service
- A Mercedes and a Ford are equally “fit for use” but
with different design dimensions
Dimensions of uuality:
Manufactured Products
 Performance
- Basic operating characteristics of a product; how
well a car handles or its gas mileage
 Features
- “extra” items added to basic features, such as a
stereo CD or a leather interior in a car
 Reliability
- Probability that a product will operate properly
within an expected time frame; that is, a TV will
work without repair for about seven years
 Conformance
- Degree to which a product meets pre-established
standards
 Durability
- how long product lasts before replacement
 Serviceability
- Ease of getting repairs, speed of repairs, courtesy
and competence of repair person
 Aesthetic
- How a product looks, feels, sounds, smells, or
tastes
 Safety
- Assurance that customer will not suffer injury or
harm from a product; an especially important
consideration for automobiles
 Perceptions
- Subjective perceptions based on brand name,
advertising, etc.
Dimensions of uuality: Services
 Time and timeliness
- How long must a customer wait for service
 Completeness
- Everything customer asked for is provided
 Courtesy
- Customers treated by employees
 Consistency
- Same level of service provided to each customer
each time
 Accessibility and Convenience
- How easy service is obtained
 Accuracy
- Service performed right every time
 Responsiveness
- Company react to unusual situations
Producer’s Perspective in uuality
 uuality of conformance
- Making sure product or service is produced
according to design
Final Perspective in uuality
Customer’s and producer’s perspectives depend on
each other
 Producer’s perspective
- Production process and COST
 Customer’s perspective
- Fitness for use and Price
Evolution of uuality Management: uuality Gurus
 Walter Shewhart
- 1920s, develop control charts
 W. Edwards Deming
- Develop courses WWII to teach statistical quality-
control techniques
 Joseph M. Juran
- Focused on strategic quality planning
 Armand V. Feigenbaum
- Introduced concepts of total quality control and
continuous quality improvement
 Philip Crosby
- Emphasized that cost of poor quality far outweigh
cost
 Kaoru Ishikawa
- Promoted use of quality circles
Deming’s 14 Points
1. Create consistency of purpose
2. Adopt philosophy of prevention
3. Cease mass inspection
4. Select a few suppliers based on quality
5. Constantly improve system and workers
6. Institute worker training
7. Instill leadership among supervisors
8. Eliminates fear among employees
9. Eliminates barriers between departments
10. Eliminates slogans
11. Eliminate numerical quotas
12. Enhance worker pride
13. Institute vigorous training and education
programs
14. Develop a commitment from top management
to implement above 13 points
uuality Tools
 Process flow chart
 Cause-and-effect
 Diagram
 Check sheet
 Pareto analysis
 Histogram
 Scatter diagram
 Statistical process control chart
 Process Flow Chart
- Diagram of the steps in a process
 Cause-and-Effect Diagram
- Chart sowing different categories of problem
 Total uuality Management (TuM)
- Customer-oriented, leadership, strategic planning,
employee responsibility, continuous improvement,
cooperation, statistical methods, and training and
education
 uuality Management System (uMS)
- System to achieve customer satisfaction that
complements other company systems
TuM Principles
- Quality can and muse be managed
- Customer defines quality
- Management must be involved and provide
leadership
- Continuous quality improvements is “the strategic
goal”
Focus of uuality Management- Customers
 TuM and uMSs
- Serve to achieve customer satisfaction
- Satisfied customers are less likely to switch to a
competitor
- 94-96% of dissatisfied customers don’t complain
uuality Management in the Supply Chain
- Companies need support of their suppliers to
satisfy their customers
- Reduce the number of suppliers
 Partnering
- Relationship between a company and its supplier
based on mutual quality standards
Measuring Customer Satisfaction
- An important component of any QMS
- Use customer service to hear “Voice of the
customer”
Roles of Employees in uuality Improvement
 Participate problem solving
- Employees involved in quality-management
 Kaizen
- Involves everyone in process of continuous
improvement
 uuality Circles
- Voluntary group of workers and supervisors from
same area
Process (uuality) Improvement Teams
- Focus attention on business processes rather than
separate company functions
- Process flowcharts are key tools
uuality in Services
- Service defect are not always easy to measure
because service output is not usually a tangible
item
uuality Attributes in Services
- Principles of TQM apply equally well to services
and manufacturing
 Timeliness is an important dimension
- How quickly a service is provided
 Benchmark
- “best” level of quality achievement in one
company that other companies seek
 Six Sigma
- Process for developing and delivering virtually
perfect products and services
- Measure of how much a process deviates from
perfection
 Six Sigma Process
1. Align
- Executives create balanced scorecard
2. Mobilize
- Project teams formed and empowered to act
3. Accelerate
- Black, green bell execute project
4. Govern
- Monitor and review projects
5. Champion
- an executive responsible for project success
 Breakthrough Strategy: DMAIC
1. Define
- Problem is defined
2. Measure
- Process measured, data collected
3. Analyze
- Data analysis to find cause of problem
4. Improve
- Develop solutions to problem
5. Control
- Ensure improvements in continued
 Black Belt
- Project leader
 Master Black Belt
- A teacher and mentor for Black Belts
 Green Belts
- Project team members
Six Sigma Tools -1
 uuality Function Deployment (uFD)
- Capture the “voice of the customer”
 Cause and Effect Matrix
- Identify and prioritize cause of a problem
 Failure Modes and Affects Analysis (FMEA)
- Analyze potential problems before they occur
Six Sigma Tools- 2
 I-Test
- Test for difference between groups
 Statistical Process Control (SPC) Chart
- Monitor a process over time for variations
 Design of Experiments (DOE)
- Determining relationships between factors
affecting inputs and outputs of a process
Design for Six Sigma (DFSS)
- Systematic approach to designing products and
process
- Use some basic approach as breakthrough strategy
Lean Six Sigma
 Integrate six Sigma and lean system
 Lean seeks to optimize process flows
 Lean extends earlier efforts in efficiency
 Lean process improvement steps
1. Determine what creates value for customers
2. Identify ‘value stream’
3. Remove waste in the value stream
4. Make process responsive to customer needs
5. Continually repeat attempts to remove waste
 Six sigma and lean seek
- Process improvements
- Increased value to customers
 They approach the goals in different,
complementary ways
Cost of uuality
 Cost of achieving Good quality
Prevention cost
- Costs incurred during product design
Appraisal Cost
- Cost measuring, testing and analyzing
 Cost of Poor quality
Internal failure costs
- Include scrap, rework, process failure, downtime
and price reductions
External failure costs
- Include complaints, returns, warranty claims,
liability and lost sales

Operations Management and Human Resource.docx

  • 1.
    Operations Management andHuman Resource Chapter 1 Introduction to Operations and Supply Chain Management  Operation Management - Design, operation, and improvement of productive systems  Operations - A function or system that transforms inputs into outputs of greater value.  Value Chain - A series of activities from supplier to customer that add value to a product/service. Value Chain: I -> P -> O I= Input P= Process O=Output ___Value___  Transformation Process - A series of activities along a value chain extending from supplier to customer - Activities that do not add value are superfluous and should be eliminated Transformation Processes - Physical: as in manufacturing operations - Locational: as in transportation/warehouse operation - Exchange: as in retail operations - Psychological: as in entertainment - Physiological: as in health care - Informational: as in communication Operations as a Transformation Process Input Output -Material -Goods -Machines Transformation Process -Services -Labor -Management -Capital The Operations Function - Organizing work - Selecting Process - Arranging layouts - Locating Facilities - Designing Jobs - Measuring Performance - Controlling quality - Scheduling work - Managing Inventory - Planning production Operations Function - Operations - Marketing - Finance and Accounting - Human Resources - Suppliers How is Operations Related to my Major? - Accounting – “as an auditor you must understand the fundamentals of operations management” - Information Technology- “IT is a tool, and there’s no better place to apply it than in operations” - Management- “We use so many things you learn in an operations class- scheduling, lean production, theory of constraints, and tons of quality tools. - Economics- “its all about process. I live by flowcharts and Pareto analysis” - Marketing- “How can you do a good job marketing a product if you’re unsure of its quality or delivery status” - Finance- “most of our capital budgeting requests are from operations, and most of our cost savings, too” Historical Events in Operations Management ERA EVENTS/CONCEP TS DATE S ORIGINATOR Industrial Revolution -Steam engine 1769 James Watt -Division of labor 1776 Adam Smith - Interchangeable parts 1790 Eli Whitney Scientific Manageme nt -Principles of scientific management 1911 Frederick W. Taylor -Time and motion studies 1911 Frank and William Gilbreth -Activity scheduling art 1912 Henry Gantt -Moving assembly line 1913 Henry Ford Operations Suppliers Finance Accounting 0 Human Resources Marketing
  • 2.
    Human Relations -Hawthorne studies 1930 Elton Mayo -Motivation theories 1940 s Abraham Maslow 1950 s Frederick Herzberg 1960 s Douglas McGregor Operations Research -Linear Programming 1947George Dantzig -Digital Computer -Simulation, waiting line theory, decision theory, PERT/CPM 1951 1950 s Remington Rand Operations Research Group -MRP, EDI, EFT, CIM 1960 s, 1970 s Joseph Orlicky, IBM and others Quality Revolution -JIT (Just in Time) 1970 s Taiichi Ohno (Toyota) -TQM (Total Quality man) 1980 s W. Edwards Deming, Joseph Juan -Strategy and Operations 1980 s Wickham Skinner, Robert Hayes -Reengineering 1990 s Michael Hammer, James Champy -Six Sigma 1990 s G.E. Motorola Internet Revolution -Internet, WWW, ERP, supply chain management 1990 s ARPANET, Tim Berners Lee SAP, i2 Technologie s, ORACLE, Dell E-Commerce 2000 s Amazon, Yahoo, eBay, Google and others Globalizatio n WTO, European Union, Global supply chains, Outsourcing, Service Science 1990 s 2000 s China, India, Emerging economies Sustainabili ty Global warming, Carbon footprint, Green products, Corporate social responsibility (CSR), UN Global Compact Toda y Numerous companies, statesmen, governmen t, UN, World Economic Forum Product Life Cycle 1. Introduction (Awareness) 2. Growth stage (Start sustainability) 3. Maturity (Sustainability) 4. Decline Evolutions of Operations and Supply Chain Management  Supply Chain Management - Management of the flow of information, products, and services across a network of customers, enterprises, and supply chain Globalization  Why “go global”? - Favorable cost - Access to international markets - Response to changes in demand - Reliable sources of supply - Latest trends and technologies Increased Globalization - Results from the internet and falling trade barriers Productivity and Competitiveness  Competitiveness - A degree to which a nation can produce goods and services that meet the test of international markets  Productivity - Ratio of Output to input  Output - Sales made, products produced, customers served, meals delivered or calls answered  Input
  • 3.
    - Labor hours,investment in equipment, material usage or square footage Strategy and Operations - How the mission of a company is accomplished - Provides direction for achieving a mission - Unites the organization - Provides consistency in decisions - Keep organization moving in the right direction Strategy Formulation 1. Defining a primary task - What is the firm in the business of doing? - Represents the purpose of the firm 2. Answering core competencies - What does the firm do better than anyone else? - Processes, not products or services 3. Determining order winners and order qualifiers - What qualifies an item to be considered for purchase? - What wins the order? -that is the order winner 4. Positioning the firm - How will the firm compete? 5. Deploying the strategy Strategic Planning Positioning the firm - Cost - Speed - Quality - Flexibility Positioning the Firm: Speed  Fast moves, fast adaptations, tight linkage - Internet - Customers expect immediate responses  Service organizations - Always competed on speed Positioning the Firm: Cost  Waste eliminations - Relentlessly pursuing the removal of all waste  Examination of cost structure - Looking at the entire cost structure of reduction potential  Lean production - Providing low costs through disciplined operation  Manufacturers - Time based competition: build-to-order production and efficient supply chains  Fashion industry - Two-week design-to-rack lead time of Spanish retailer, Zara Positioning the Firm: uuality  Minimizing defect rates or conforming to design specification  Ritz- Carlton- one customer at a time - Service system designed to “move heaven and earth” to satisfy customer - Employees empowered to satisfy a guests wish - Teams set objectives and devices quality action plans  Each hotel has a quality leader Positioning the Firm: Flexibility  Ability to adjust to changes in product mis, production volume, or design  Mass communication - Mass production of customized parts  National Bicycle Industrial Company - Offers 11,231,862 variations - Delivers within two weeks at cost only 10% above standard models Policy Deployment  Policy deployment - Translates corporate strategy into measurable objectives  Hoshins - Action plans generated from the policy deployment process Balance Scorecard  Balance scorecard - Measuring more than financial performance - Finances, processes, customers, learning and growing  Key performance indicators - Set of measures to help managers evaluate performance in critical areas. Decision Analysis  uuantitative Method - A set of tools for operations manager Corporate Strategy Mission and Vision Operations Strategy Marketing Strategy
  • 4.
     Decision Analysis -A set of quantitative decision-making techniques for decision situations in which uncertainty exist. Decision Making Without Probabilities  States of Nature - Events that may occur in the future.  Decision making under risk - Probabilities can be assigned to the occurrence of states of nature in the future.  Decision making under uncertainty - Probabilities can not be assigned to the occurrence of states of nature in the future. Payoff Table  Payoff Table - Method of organizing ang illustrating payoffs from different decisions given various states of nature  Payoff - Outcome of decision Decision making criteria under uncertainty  Maximax - Choose decision with the maximum of maximum payoffs  Maximin - Choose decision with the maximum of the minimum payoffs  Minimax Regret - Choose decision with the minimum of the maximum regrets for each alternative  Hurwicz - Choose decision in which decision payoffs are weighted by a coefficient of optimism, alpha - Coefficient of optimism is a measure of a decision maker’s optimism, from 0 (completely pessimistic) to 1 (completely optimistic)  Equal likelihood (La Place) - Choose decision in which each state of nature is weighted equally Expected Value EV (x) = ∑ 𝑝 𝑛 𝑖=1 (x1)x1 Where X1= outcome 1 P(x1)=probability of outcome i Decision Making with Probabilities - Risk involves assigning probabilities to states of nature  Expected Value - A weighted average of decision outcomes im which each future states of nature is assigned a probability of occurrence Expected Value of Perfect Information  EVPI - Maximum value of prefect information to the decision maker - Maximum amount that would be paid to gain information that would result in a decision better than the one made without perfect information  Good condition will exist 70% of the time - Choose maintain status quo with payoff of $1,300,00  Poor condition will exist 30% of the time - Choose expand with payoff of $500,000  Expected value given perfect information = $1,300,000 (0.70) + 500,000 (0.30) = $1,060,000  Recall that expected value without perfect information was $865,000 (maintain status quo)  EVPI= $1,060,000 – 865,000 Sequential Decision Trees  A graphical method for analyzing decision situations that require a sequence of decisions over time  Decision tree consists of - Square nodes- indicating decision points - Circle nodes- indicating states of nature - Arcs- connecting nodes uuality Management What is uuality?  Oxford American Dictionary - A degree or level of excellence  American Society for uuality - Totality of features and characteristics that satisfy needs without deficiencies  Consumer’s and Producers perspective Meaning of uuality Meaning of Quality Quality of conformance _____________ - Conformance to specification -Cost Production Quality of Design _______________ - Quality characteristices - Price Marketing Producer's Perspective Consumer's Perspective
  • 5.
    What is uuality: Customer’sPerspective  Fitness for use - How well product or service does what it is supposed to  uuality of design - Designing quality characteristics into a product or service - A Mercedes and a Ford are equally “fit for use” but with different design dimensions Dimensions of uuality: Manufactured Products  Performance - Basic operating characteristics of a product; how well a car handles or its gas mileage  Features - “extra” items added to basic features, such as a stereo CD or a leather interior in a car  Reliability - Probability that a product will operate properly within an expected time frame; that is, a TV will work without repair for about seven years  Conformance - Degree to which a product meets pre-established standards  Durability - how long product lasts before replacement  Serviceability - Ease of getting repairs, speed of repairs, courtesy and competence of repair person  Aesthetic - How a product looks, feels, sounds, smells, or tastes  Safety - Assurance that customer will not suffer injury or harm from a product; an especially important consideration for automobiles  Perceptions - Subjective perceptions based on brand name, advertising, etc. Dimensions of uuality: Services  Time and timeliness - How long must a customer wait for service  Completeness - Everything customer asked for is provided  Courtesy - Customers treated by employees  Consistency - Same level of service provided to each customer each time  Accessibility and Convenience - How easy service is obtained  Accuracy - Service performed right every time  Responsiveness - Company react to unusual situations Producer’s Perspective in uuality  uuality of conformance - Making sure product or service is produced according to design Final Perspective in uuality Customer’s and producer’s perspectives depend on each other  Producer’s perspective - Production process and COST  Customer’s perspective - Fitness for use and Price Evolution of uuality Management: uuality Gurus  Walter Shewhart - 1920s, develop control charts  W. Edwards Deming - Develop courses WWII to teach statistical quality- control techniques  Joseph M. Juran - Focused on strategic quality planning  Armand V. Feigenbaum - Introduced concepts of total quality control and continuous quality improvement  Philip Crosby - Emphasized that cost of poor quality far outweigh cost  Kaoru Ishikawa - Promoted use of quality circles Deming’s 14 Points 1. Create consistency of purpose 2. Adopt philosophy of prevention 3. Cease mass inspection 4. Select a few suppliers based on quality 5. Constantly improve system and workers 6. Institute worker training 7. Instill leadership among supervisors 8. Eliminates fear among employees
  • 6.
    9. Eliminates barriersbetween departments 10. Eliminates slogans 11. Eliminate numerical quotas 12. Enhance worker pride 13. Institute vigorous training and education programs 14. Develop a commitment from top management to implement above 13 points uuality Tools  Process flow chart  Cause-and-effect  Diagram  Check sheet  Pareto analysis  Histogram  Scatter diagram  Statistical process control chart  Process Flow Chart - Diagram of the steps in a process  Cause-and-Effect Diagram - Chart sowing different categories of problem  Total uuality Management (TuM) - Customer-oriented, leadership, strategic planning, employee responsibility, continuous improvement, cooperation, statistical methods, and training and education  uuality Management System (uMS) - System to achieve customer satisfaction that complements other company systems TuM Principles - Quality can and muse be managed - Customer defines quality - Management must be involved and provide leadership - Continuous quality improvements is “the strategic goal” Focus of uuality Management- Customers  TuM and uMSs - Serve to achieve customer satisfaction - Satisfied customers are less likely to switch to a competitor - 94-96% of dissatisfied customers don’t complain uuality Management in the Supply Chain - Companies need support of their suppliers to satisfy their customers - Reduce the number of suppliers  Partnering - Relationship between a company and its supplier based on mutual quality standards Measuring Customer Satisfaction - An important component of any QMS - Use customer service to hear “Voice of the customer” Roles of Employees in uuality Improvement  Participate problem solving - Employees involved in quality-management  Kaizen - Involves everyone in process of continuous improvement  uuality Circles - Voluntary group of workers and supervisors from same area Process (uuality) Improvement Teams - Focus attention on business processes rather than separate company functions - Process flowcharts are key tools uuality in Services - Service defect are not always easy to measure because service output is not usually a tangible item uuality Attributes in Services - Principles of TQM apply equally well to services and manufacturing  Timeliness is an important dimension - How quickly a service is provided  Benchmark - “best” level of quality achievement in one company that other companies seek  Six Sigma - Process for developing and delivering virtually perfect products and services - Measure of how much a process deviates from perfection  Six Sigma Process 1. Align - Executives create balanced scorecard 2. Mobilize - Project teams formed and empowered to act 3. Accelerate - Black, green bell execute project 4. Govern - Monitor and review projects 5. Champion - an executive responsible for project success  Breakthrough Strategy: DMAIC
  • 7.
    1. Define - Problemis defined 2. Measure - Process measured, data collected 3. Analyze - Data analysis to find cause of problem 4. Improve - Develop solutions to problem 5. Control - Ensure improvements in continued  Black Belt - Project leader  Master Black Belt - A teacher and mentor for Black Belts  Green Belts - Project team members Six Sigma Tools -1  uuality Function Deployment (uFD) - Capture the “voice of the customer”  Cause and Effect Matrix - Identify and prioritize cause of a problem  Failure Modes and Affects Analysis (FMEA) - Analyze potential problems before they occur Six Sigma Tools- 2  I-Test - Test for difference between groups  Statistical Process Control (SPC) Chart - Monitor a process over time for variations  Design of Experiments (DOE) - Determining relationships between factors affecting inputs and outputs of a process Design for Six Sigma (DFSS) - Systematic approach to designing products and process - Use some basic approach as breakthrough strategy Lean Six Sigma  Integrate six Sigma and lean system  Lean seeks to optimize process flows  Lean extends earlier efforts in efficiency  Lean process improvement steps 1. Determine what creates value for customers 2. Identify ‘value stream’ 3. Remove waste in the value stream 4. Make process responsive to customer needs 5. Continually repeat attempts to remove waste  Six sigma and lean seek - Process improvements - Increased value to customers  They approach the goals in different, complementary ways Cost of uuality  Cost of achieving Good quality Prevention cost - Costs incurred during product design Appraisal Cost - Cost measuring, testing and analyzing  Cost of Poor quality Internal failure costs - Include scrap, rework, process failure, downtime and price reductions External failure costs - Include complaints, returns, warranty claims, liability and lost sales