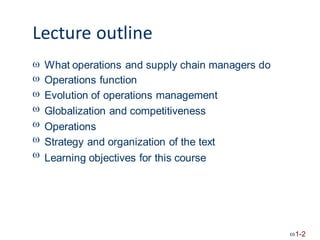
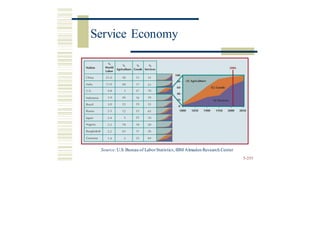
This document provides an overview of operations management and supply chain management concepts. It discusses the functions of operations managers in transforming inputs into outputs through production processes. Key historical developments in the field are outlined, including scientific management, quality management approaches, and more recent supply chain innovations. Globalization and competitiveness are addressed in relation to productivity and positioning firms based on competitive priorities like cost, quality, speed, and flexibility. The roles of operations strategy and strategic decision making in various areas are also introduced.


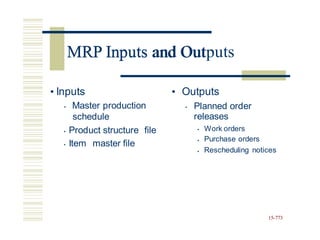
![Advanced Lot Sizing Rules: EOQ
2(30)(60 minimum order quantity
EOQ 60
1
T
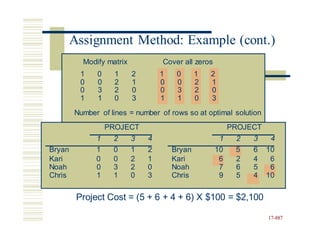
otal cost of EOQ = (2 X $60) + [(10 + 50 + 40) X $1)] = $220
15-804
Advanced Lot Sizing R](https://image.slidesharecdn.com/2ch1-17operationsmanagement6jan2023-230107102124-8b754f20/85/2_Ch1-17_Operations-Management_6-Jan-2023-pdf-464-320.jpg)
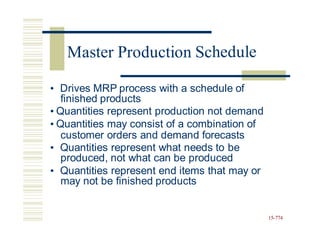
![Advanced Lot Sizing Rules: POQ
periods worth of requirements
POQ Q / d 60/30 2
T
otal cost of POQ = (2 X $60) + [(20 + 40) X $1] = $180
15-805
Advanced Lot Sizing R](https://image.slidesharecdn.com/2ch1-17operationsmanagement6jan2023-230107102124-8b754f20/85/2_Ch1-17_Operations-Management_6-Jan-2023-pdf-465-320.jpg)