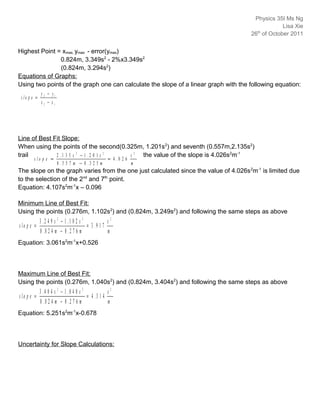
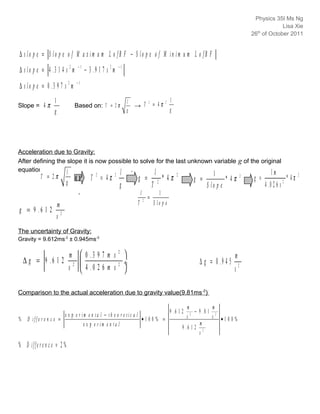
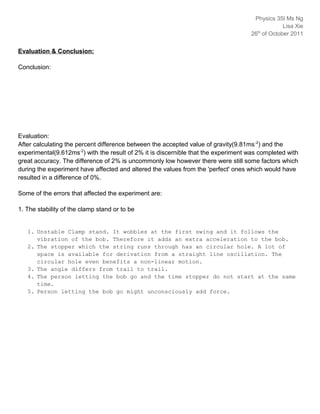
Pendulum Lap investigating the relationship between the length of the pendlum string and the time needed for the oscillations
Score archieved: 5/6 in the DCP section.
This presentation is all about how to calculate the acceleration due to gravity with formulae and pictures. the whole procedure is explained to you in a very elegant manner. Hope this is helpful to you. for any further details and information wait for my next upload.
This paper presents the Physics Rotational Method of the simple gravity pendulum, and it also applies Physics Direct Method to represent these equations, in addition to the numerical solutions discusses. This research investigates the relationship between angular acceleration and angle to find out different numerical solution by using simulation to see their behavior which shows in last part of this article.
A tale of scale & speed: How the US Navy is enabling software delivery from l...sonjaschweigert1
Rapid and secure feature delivery is a goal across every application team and every branch of the DoD. The Navy’s DevSecOps platform, Party Barge, has achieved:
- Reduction in onboarding time from 5 weeks to 1 day
- Improved developer experience and productivity through actionable findings and reduction of false positives
- Maintenance of superior security standards and inherent policy enforcement with Authorization to Operate (ATO)
Development teams can ship efficiently and ensure applications are cyber ready for Navy Authorizing Officials (AOs). In this webinar, Sigma Defense and Anchore will give attendees a look behind the scenes and demo secure pipeline automation and security artifacts that speed up application ATO and time to production.
We will cover:
- How to remove silos in DevSecOps
- How to build efficient development pipeline roles and component templates
- How to deliver security artifacts that matter for ATO’s (SBOMs, vulnerability reports, and policy evidence)
- How to streamline operations with automated policy checks on container images
Elevating Tactical DDD Patterns Through Object CalisthenicsDorra BARTAGUIZ
After immersing yourself in the blue book and its red counterpart, attending DDD-focused conferences, and applying tactical patterns, you're left with a crucial question: How do I ensure my design is effective? Tactical patterns within Domain-Driven Design (DDD) serve as guiding principles for creating clear and manageable domain models. However, achieving success with these patterns requires additional guidance. Interestingly, we've observed that a set of constraints initially designed for training purposes remarkably aligns with effective pattern implementation, offering a more ‘mechanical’ approach. Let's explore together how Object Calisthenics can elevate the design of your tactical DDD patterns, offering concrete help for those venturing into DDD for the first time!
Accelerate your Kubernetes clusters with Varnish CachingThijs Feryn
A presentation about the usage and availability of Varnish on Kubernetes. This talk explores the capabilities of Varnish caching and shows how to use the Varnish Helm chart to deploy it to Kubernetes.
This presentation was delivered at K8SUG Singapore. See https://feryn.eu/presentations/accelerate-your-kubernetes-clusters-with-varnish-caching-k8sug-singapore-28-2024 for more details.
Builder.ai Founder Sachin Dev Duggal's Strategic Approach to Create an Innova...Ramesh Iyer
In today's fast-changing business world, Companies that adapt and embrace new ideas often need help to keep up with the competition. However, fostering a culture of innovation takes much work. It takes vision, leadership and willingness to take risks in the right proportion. Sachin Dev Duggal, co-founder of Builder.ai, has perfected the art of this balance, creating a company culture where creativity and growth are nurtured at each stage.
Transcript: Selling digital books in 2024: Insights from industry leaders - T...BookNet Canada
The publishing industry has been selling digital audiobooks and ebooks for over a decade and has found its groove. What’s changed? What has stayed the same? Where do we go from here? Join a group of leading sales peers from across the industry for a conversation about the lessons learned since the popularization of digital books, best practices, digital book supply chain management, and more.
Link to video recording: https://bnctechforum.ca/sessions/selling-digital-books-in-2024-insights-from-industry-leaders/
Presented by BookNet Canada on May 28, 2024, with support from the Department of Canadian Heritage.
SAP Sapphire 2024 - ASUG301 building better apps with SAP Fiori.pdfPeter Spielvogel
Building better applications for business users with SAP Fiori.
• What is SAP Fiori and why it matters to you
• How a better user experience drives measurable business benefits
• How to get started with SAP Fiori today
• How SAP Fiori elements accelerates application development
• How SAP Build Code includes SAP Fiori tools and other generative artificial intelligence capabilities
• How SAP Fiori paves the way for using AI in SAP apps
Welocme to ViralQR, your best QR code generator.ViralQR
Welcome to ViralQR, your best QR code generator available on the market!
At ViralQR, we design static and dynamic QR codes. Our mission is to make business operations easier and customer engagement more powerful through the use of QR technology. Be it a small-scale business or a huge enterprise, our easy-to-use platform provides multiple choices that can be tailored according to your company's branding and marketing strategies.
Our Vision
We are here to make the process of creating QR codes easy and smooth, thus enhancing customer interaction and making business more fluid. We very strongly believe in the ability of QR codes to change the world for businesses in their interaction with customers and are set on making that technology accessible and usable far and wide.
Our Achievements
Ever since its inception, we have successfully served many clients by offering QR codes in their marketing, service delivery, and collection of feedback across various industries. Our platform has been recognized for its ease of use and amazing features, which helped a business to make QR codes.
Our Services
At ViralQR, here is a comprehensive suite of services that caters to your very needs:
Static QR Codes: Create free static QR codes. These QR codes are able to store significant information such as URLs, vCards, plain text, emails and SMS, Wi-Fi credentials, and Bitcoin addresses.
Dynamic QR codes: These also have all the advanced features but are subscription-based. They can directly link to PDF files, images, micro-landing pages, social accounts, review forms, business pages, and applications. In addition, they can be branded with CTAs, frames, patterns, colors, and logos to enhance your branding.
Pricing and Packages
Additionally, there is a 14-day free offer to ViralQR, which is an exceptional opportunity for new users to take a feel of this platform. One can easily subscribe from there and experience the full dynamic of using QR codes. The subscription plans are not only meant for business; they are priced very flexibly so that literally every business could afford to benefit from our service.
Why choose us?
ViralQR will provide services for marketing, advertising, catering, retail, and the like. The QR codes can be posted on fliers, packaging, merchandise, and banners, as well as to substitute for cash and cards in a restaurant or coffee shop. With QR codes integrated into your business, improve customer engagement and streamline operations.
Comprehensive Analytics
Subscribers of ViralQR receive detailed analytics and tracking tools in light of having a view of the core values of QR code performance. Our analytics dashboard shows aggregate views and unique views, as well as detailed information about each impression, including time, device, browser, and estimated location by city and country.
So, thank you for choosing ViralQR; we have an offer of nothing but the best in terms of QR code services to meet business diversity!
GraphRAG is All You need? LLM & Knowledge GraphGuy Korland
Guy Korland, CEO and Co-founder of FalkorDB, will review two articles on the integration of language models with knowledge graphs.
1. Unifying Large Language Models and Knowledge Graphs: A Roadmap.
https://arxiv.org/abs/2306.08302
2. Microsoft Research's GraphRAG paper and a review paper on various uses of knowledge graphs:
https://www.microsoft.com/en-us/research/blog/graphrag-unlocking-llm-discovery-on-narrative-private-data/
Essentials of Automations: Optimizing FME Workflows with ParametersSafe Software
Are you looking to streamline your workflows and boost your projects’ efficiency? Do you find yourself searching for ways to add flexibility and control over your FME workflows? If so, you’re in the right place.
Join us for an insightful dive into the world of FME parameters, a critical element in optimizing workflow efficiency. This webinar marks the beginning of our three-part “Essentials of Automation” series. This first webinar is designed to equip you with the knowledge and skills to utilize parameters effectively: enhancing the flexibility, maintainability, and user control of your FME projects.
Here’s what you’ll gain:
- Essentials of FME Parameters: Understand the pivotal role of parameters, including Reader/Writer, Transformer, User, and FME Flow categories. Discover how they are the key to unlocking automation and optimization within your workflows.
- Practical Applications in FME Form: Delve into key user parameter types including choice, connections, and file URLs. Allow users to control how a workflow runs, making your workflows more reusable. Learn to import values and deliver the best user experience for your workflows while enhancing accuracy.
- Optimization Strategies in FME Flow: Explore the creation and strategic deployment of parameters in FME Flow, including the use of deployment and geometry parameters, to maximize workflow efficiency.
- Pro Tips for Success: Gain insights on parameterizing connections and leveraging new features like Conditional Visibility for clarity and simplicity.
We’ll wrap up with a glimpse into future webinars, followed by a Q&A session to address your specific questions surrounding this topic.
Don’t miss this opportunity to elevate your FME expertise and drive your projects to new heights of efficiency.
Smart TV Buyer Insights Survey 2024 by 91mobiles.pdf91mobiles
91mobiles recently conducted a Smart TV Buyer Insights Survey in which we asked over 3,000 respondents about the TV they own, aspects they look at on a new TV, and their TV buying preferences.
PHP Frameworks: I want to break free (IPC Berlin 2024)Ralf Eggert
In this presentation, we examine the challenges and limitations of relying too heavily on PHP frameworks in web development. We discuss the history of PHP and its frameworks to understand how this dependence has evolved. The focus will be on providing concrete tips and strategies to reduce reliance on these frameworks, based on real-world examples and practical considerations. The goal is to equip developers with the skills and knowledge to create more flexible and future-proof web applications. We'll explore the importance of maintaining autonomy in a rapidly changing tech landscape and how to make informed decisions in PHP development.
This talk is aimed at encouraging a more independent approach to using PHP frameworks, moving towards a more flexible and future-proof approach to PHP development.
Encryption in Microsoft 365 - ExpertsLive Netherlands 2024Albert Hoitingh
In this session I delve into the encryption technology used in Microsoft 365 and Microsoft Purview. Including the concepts of Customer Key and Double Key Encryption.
Encryption in Microsoft 365 - ExpertsLive Netherlands 2024
IB Phyiscs SL - Pendulum Lab
1. Physics 35IB
th
26 of October 2011
Background:
A simple pendulum consists of a mass called the pendulum bob suspended from a support by a thread. The
time for a complete vibration is called the period ( T ) of the pendulum. When a pendulum swings through a
small arc its bob is undergoing simple harmonic motion. This investigation attempts to verify Galileo’s early
observation that the period of a pendulum depends only upon the length of the thread, also to verify that the
acceleration due to gravity is
9.81 m / s .The concept of oscillatory motion is used. The equation related to this concept is
2
l
T = 2π
g
Problem:
The two problems that need to be solved with this Lab is to prove the dependance of the period on the length of
the rope as well as the value of gravity.
Hypothesis:
An increase in the ropes length will cause the period to grow as well. That those two variables are proportional
can be deducted in two ways. First when taking a look at the equation one can see that a multiplication of one of
the two (given that the others are constant) results in a change of the other in the same direction.
Design:
The pendulum will be set up by running a threat through a stopper which is clamped into a clamp stand. A sheet
of paper with a line indicating 20 degrees is placed some centimeters behind the string. At the bottom a
pendulum bob is tied to the string. At each trial the string is placed into the same position of 20 degrees. After
taking the time of 10 oscillations the bob is lowered and the new length is measured with a meter. This
procedure is repeated for 10 trails.
Pendulum bob 20 Degree angle
indicated on paper
2. Physics 35IB
th
26 of October 2011
Variables:
Independent: The length of the rope which was increased after every trail and measured by the same meter
stick by the same person.
Corresponding: The time the pendulum bobs needs to complete 10 swings; the weight of the bob stays
constant, and so does the timer.
Controlled:
1. The stopper - the person who was in charge of the stop watch was always the same, this was to ensure that
the reaction time variations do not add additional errors to the measurement of time.
2. The same pendulum bob was used - interchanging the pendulum bob would have resulted in a different
momentum of the Pendulum for each different trial, as well as and alternation in acceleration due to the change
in mass.
3. The angle – A differentiation of the angle would have resulted in an extension/reduction of the way the bob
would swing, therefore the time needed to complete one round would have been altered.
4. The person that took the measurements - The job of measuring the length of the rope was assigned to a
single person. This way, adding unnecessary errors while taking the length was avoided as there was just one
value of uncertainty, that of the analyzer.
5. The environment – The set up was not moved in between the trails so the environment was kept more or less
the same from trail to trail. Factors like wind, pressure or temperature did not change greatly since the
apparatus was not displaced. Neither was any window or door opened which could have caused wind gushes to
influence the results.
Materials:
• A pendulum bob with a certain mass
• Pendulum clamps
• Stop watch
• String
• Paper with 20 degree angle indicated
• Ruler
• Stopper with hole
Procedure:
1. Attach String to Pendulum clamps and run it through the hole of the Stopper
2. Tie Pendulum bob to lose end of String
3. Measure and record the length of the rope
4. Align String so it is in line with the indicated 20 degree angle
5. Release Pendulum and start the Stop watch.
6. Count 10 oscillations and record the time
7. Modify length and repeat steps 4.-6. until 10 trails have been performed
3. Physics 35IB
th
26 of October 2011
In order to attain a linear graph from the first parabolic graph created using the data from table 1.0. the
Period must to be squared. This can be deduced from the original equation l where we
T = 2π
find the length (l ) under a square root. g
The equation for the first graph can be obtained by replacing square rooted l the of the original
equation by l as shown here: 1 The gradient for the first graph is 1
T = 2π *l 2π
g g
Calculations for T2:
T = period
T2 = (period)2
ex. Data from trial 1
T2 = (1.035 s)2
T2 = 1.071 s2
Length ± 0.001 Period2 ± 2%
(m) (s2)
0.276 1.071
0.325 1.201
0.386 1.543
0.439 1.703
0.479 1.869
0.518 1.999
0.557 2.135
0.646 2.605
0.754 2.938
0.824 3.349
Table 1.1 – Period squared as a function of the length of the rope
Uncertainties:
The uncertainty of the length 0.001m (1cm) was set by the person who measured the rope. The max.
uncertainty of 0.0005m could not be reached because of the combination of her bad eye sight and the
faded unit indications of the ruler.
The beforehand measured reaction time of the stopper (0.15s) was used as uncertainty with the 'Time
of 10 oscillations'.
The error for the actual Period was calculated in the following manner:
1
∆P = ∆ t t = time for ten oscillations
10
In order to define the error of T2 another calculation must be made.
The formula needed to receive the error of a power equation is like z=xn
∆T
∆T 2
= T 2
2
T
4. Physics 35IB
th
26 of October 2011
∆ x After in to manipulating the formula to fit the needs:
∆z = z n
x
When replacing the variables with the real values one finds that the values vary from Data Point to
Data Point. So to solve the problem one can, instead of taking the exact values of uncertainty,
calculate the percent uncertainty. The equation needs to be modified slightly
2
∆T
T 2
T
P e r c e n ta g e ∆T 2
= •1 0 0 %
T 2
ex. using Data from 7th trail
0 .0 1 5 s 0 .0 4 3 8 4
2 .1 3 5 s 2 2 P e r c e n ta g e ∆ 2 .1 3 5 s 2 = •1 0 0 %
1 .4 6 1 s • 1 0 0 % 2 .1 3 5 s 2
P e r c e n ta g e ∆ 2 .1 3 5 s =
2
2 .1 3 5 s 2 P e r c e n ta g e ∆ 2 .1 3 5 s 2 = 2 %
After computing all of the percent uncertainty one comes to the conclusion that the average
percentage error is 2%.
Error Bars:
Error Bars are assigned to the higher Percent Uncertainty. From the calculations above one can see
the error of Period squared is 2%.
Percent Uncertainty of length is 0.4%, this result can be attained from the following process:
0 .0 0 1 m
P e r c e n ta g e ∆ l =
0 .2 7 6 m
•100% P e r c e n ta g e ∆ l = 0 .4 %
Two percent is the greater value here and therefore only vertical Error Bars are used in the graph.
Maximum and Minimum Line of Best Fit:
Data Points for Max. LofBF:
Lowest Point = xmin, ymin - error(ymin) Highest Point = xmax, ymax + error(ymax)
0.276m, 1.071s2 – 2%x1.071s2 0.824m, 3.349s2 + 2%x3.349s2
(0.276m, 1.040s2) (0.824m, 3.404s2)
Data Points for Min. LofBF:
Lowest Point: xmin, ymin + error(ymin)
0.276m, 1.071s2 + 2%x1.071s2
(0.276m, 1.102s2)
5. Physics 35IB
th
26 of October 2011
Highest Point = xmax, ymax - error(ymax)
0.824m, 3.349s2 - 2%x3.349s2
(0.824m, 3.294s2)
Equations of Graphs:
Using two points of the graph one can calculate the slope of a linear graph with the following equation:
y − y1
s lo p e = 2
x 2 − x1
Line of Best Fit Slope:
When using the points of the second(0.325m, 1.201s 2) and seventh (0.557m,2.135s2)
trail 2 .1 3 5 s 2 − 1 .2 0 1 s 2 s2 the value of the slope is 4.026s2m-1
s lo p e = = 4 .0 2 6
0 .5 5 7 m − 0 .3 2 5 m m
The slope on the graph varies from the one just calculated since the value of 4.026s 2m-1 is limited due
to the selection of the 2nd and 7th point.
Equation: 4.107s2m-1x – 0.096
Minimum Line of Best Fit:
Using the points (0.276m, 1.102s2) and (0.824m, 3.249s2) and following the same steps as above
3 .2 4 9 s 2 − 1 .1 0 2 s 2 s2
s lo p e = = 3 .9 1 7
0 .8 2 4 m − 0 .2 7 6 m m
Equation: 3.061s2m-1x+0.526
Maximum Line of Best Fit:
Using the points (0.276m, 1.040s2) and (0.824m, 3.404s2) and following the same steps as above
3 .4 0 4 s 2 − 1 .0 4 0 s 2 s2
s lo p e = = 4 .3 1 4
0 .8 2 4 m − 0 .2 7 6 m m
Equation: 5.251s2m-1x-0.678
Uncertainty for Slope Calculations:
6. Physics 35IB
th
26 of October 2011
∆ s lo p e = S lo p e o f M a x im u m L o fB F − S lo p e o f M in im u m L o fB F
−1 −1
∆ s lo p e = 4 .3 1 4 s 2 m − 3 .9 1 7 s 2 m
−1
∆ s lo p e = 0 .3 9 7 s 2 m
1 l l
Slope = 4 π Based on: T = 2 π → T
2
= 4π 2
g g g
Acceleration due to Gravity:
After defining the slope it is now possible to solve for the last unknown variable g of the original
equation
T = 2π
l l . l 1 1m
g
( )2 T 2 = 4π 2
g = * 4π 2
g = * 4π 2
g = * 4π 2
g T 2
S lo p e 4 .0 2 6 s 2
l 1
2
=
m T S lo p e
g = 9 .6 1 2
s2
The uncertainty of Gravity:
Gravity = 9.612ms-2 ± 0.945ms-2
∆ S lo p m 0 .3 9 7 m s
2
e m
∆∆g g = =g 9 . 6 1 2 2÷ 2 ÷ ∆ g = 0 .9 4 5
S l o p es 4 . 0 2 6 m s s2
Comparison to the actual acceleration due to gravity value(9.81ms -2):
m m
9 .6 1 2 − 9 .8 1 2
e x p e r im e n ta l − th e o r e tic a l s 2
s •10 0%
% D iffe r e n c e = •100% =
e x p e r im e n ta l m
9 .6 1 2 2
s
% D iffe r e n c e = 2 %
7. Physics 35IB
th
26 of October 2011
Evaluation & Conclusion:
Conclusion:
Evaluation:
After calculating the percent difference between the accepted value of gravity(9.81ms -2) and the
experimental(9.612ms-2) with the result of 2% it is discernible that the experiment was completed with
great accuracy. The difference of 2% is uncommonly low however there were still some factors which
during the experiment have affected and altered the values from the 'perfect' ones which would have
resulted in a difference of 0%.
Some of the errors that affected the experiment are:
1. The stability of the clamp stand or to be
1. Unstable Clamp stand. It wobbles at the first swing and it follows the
vibration of the bob. Therefore it adds an extra acceleration to the bob.
2. The stopper which the string runs through has an circular hole. A lot of
space is available for derivation from a straight line oscillation. The
circular hole even benefits a non-linear motion.
3. The angle differs from trail to trail.
4. The person letting the bob go and the time stopper do not start at the same
time.
5. Person letting the bob go might unconsciously add force.