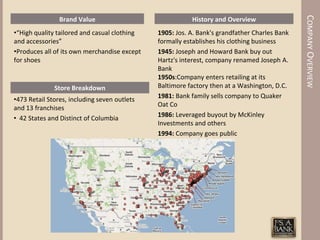
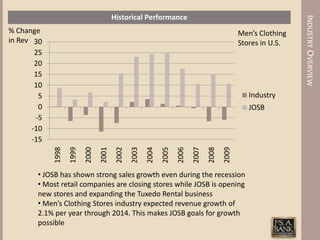
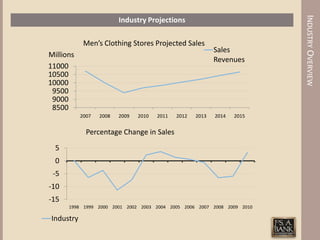
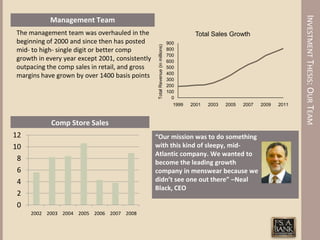
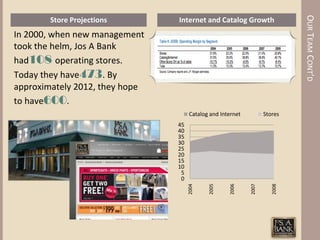
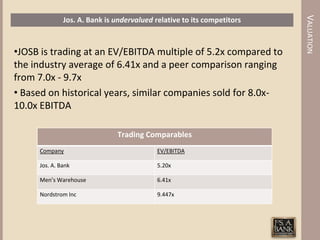
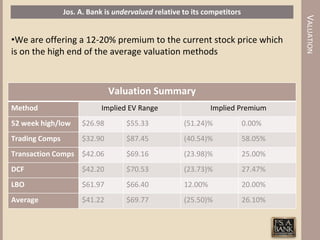
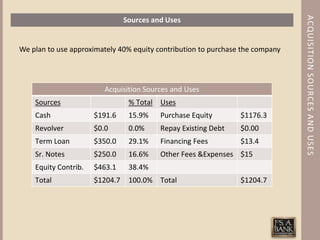
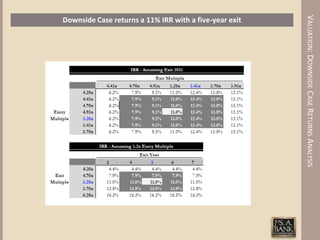
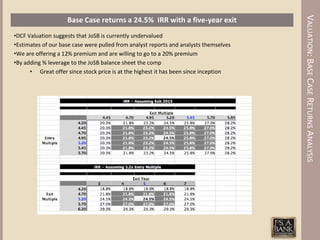
JOSEPH A BANKS: LBO

Team 7
AGENDA
Company Overview

Industry Overview

Investment Thesis

          Top Line Growth

          Strong Cash Flow

          Management

          Growth Going Forward

Risks

Exit Strategy

Competitive Advantage

Valuation and Deal

          Industry comparison

          Sources & uses

          Financial summary downside

          Financial Summary Upside
COMPANY OVERVIEW
COMPANY OVERVIEW
                Brand Value                              History and Overview
•“High quality tailored and casual clothing   1905: Jos. A. Bank's grandfather Charles Bank
and accessories”                              formally establishes his clothing business
•Produces all of its own merchandise except   1945: Joseph and Howard Bank buy out
for shoes                                     Hartz's interest, company renamed Joseph A.
                                              Bank
                                              1950s:Company enters retailing at its
              Store Breakdown                 Baltimore factory then at a Washington, D.C.
•473 Retail Stores, including seven outlets   1981: Bank family sells company to Quaker
and 13 franchises                             Oat Co
• 42 States and Distinct of Columbia          1986: Leveraged buyout by McKinley
                                              Investments and others
                                              1994: Company goes public
INDUSTRY OVERVIEW
Historical Performance


                                                                                                                  INDUSTRY OVERVIEW
% Change                                                                                         Men’s Clothing
in Rev 30                                                                                        Stores in U.S.
       25
       20
       15
       10
        5                                                                                           Industry
        0                                                                                           JOSB
       -5
      -10
      -15
            1998


                                                              2005
                   1999
                          2000
                                 2001
                                         2002
                                                2003
                                                       2004


                                                                     2006
                                                                            2007
                                                                                   2008
                                                                                          2009
       • JOSB has shown strong sales growth even during the recession
       • Most retail companies are closing stores while JOSB is opening
       new stores and expanding the Tuxedo Rental business
       • Men’s Clothing Stores industry expected revenue growth of
       2.1% per year through 2014. This makes JOSB goals for growth
       possible
INDUSTRY OVERVIEW
                          Industry Projections

             Men’s Clothing Stores Projected Sales
                                                             Sales
Millions
                                                             Revenues
11000
10500
10000
 9500
 9000
 8500
            2007   2008   2009   2010   2011   2012   2013   2014   2015


              Percentage Change in Sales
  5
  0
 -5
-10
-15
      1998 1999 2000 2001 2002 2003 2004 2005 2006 2007 2008 2009 2010

 Industry
INVESTMENT THESIS
INVESTMENT THESIS: TOP LINE GROWTH
                            Strong Top Line Growth


                                              Industry Revenue Growth Rate


•Doubled revenue
      $299.7 (2004) to $739.5 (2009)
•Store growth
      California
•Comparable Sales
      8.9% up from low of 3.8%
        (2007)
•Website
INVESTMENT THESIS: STRONG CASH FLOW
                                EBITDA & CAPEX

$160
$140
$120
$100
$80
$60
$40                                                        EBITDA
$20                                                        CAPEX
 $0
       2000 2001 2002 2003 2004 2005 2006 2007 2008 2009

  JOSB has strong, stable cash flows
      • Strong EBITDA margin
      • Capital Efficiency
            - Only $877,000 for a new store
            - Strong cash flow during recession
HIGH MARGIN BUSINESS
                              High Margin Business


20%

15%
                                                                          JOSB
10%
                                                                          MW
5%                                                                        Macy's
0%
        2004       2005      2006       2007       2008       2009
                            EBITDA Margin %

 JOSB has an excellent EBITDA Margin of 17.8%, 10.0% higher than the industry avg.
 Accomplished by:
     •Renegotiation of rent
     •Lower freight cost than competitors
     •Lower product cost than competitors

 Gross Margin increased from 57.5% in Jan 04 to 61.2% in Oct 09
INVESTMENT THESIS: OUR TEAM
           Management Team
The management team was overhauled in the                                                  Total Sales Growth
beginning of 2000 and since then has posted                                     900


                                                  Total Revenue (in millions)
mid- to high- single digit or better comp                                       800
                                                                                700
growth in every year except 2001, consistently                                  600
outpacing the comp sales in retail, and gross                                   500
                                                                                400
margins have grown by over 1400 basis points                                    300
                                                                                200
                                                                                100
                                                                                  0
                                                                                   1999   2001   2003   2005   2007   2009   2011


           Comp Store Sales
12                                               “Our mission was to do something
10                                               with this kind of sleepy, mid-
                                                 Atlantic company. We wanted to
 8                                               become the leading growth
 6                                               company in menswear because we
 4                                               didn’t see one out there” –Neal
                                                 Black, CEO
 2
 0
     2002 2003 2004 2005 2006 2007 2008
OUR TEAM CONT’D
        Store Projections       Internet and Catalog Growth
In 2000, when new management
took the helm, Jos A Bank
had108 operating stores.
Today they have473. By
approximately 2012, they hope
to have600.
                                     Catalog and Internet          Stores
                                45
                                40
                                35
                                30
                                25
                                20
                                15
                                10
                                 5
                                 0
                                     2004


                                            2005


                                                    2006


                                                            2007


                                                                      2008
Four Pillars of Success


                                                                          OUR TEAM CONT’D
Quality
• Key to Brand Identity
• “Three Levels of Luxury”
  • Executive
  • Signature
  • Signature Gold

Inventory In-Stock
• Consistent availability for customers


Design Innovation
• Eliminating middlemen and streamlining design process
• Introducing pieces that are “wrinkle-free,” “stain resistant”


Service
• Sales Associates develop meaningful business relations with customers
Growth Going Forward


                                                                       INVESTMENT THESIS: GROWTH GOING FORWARD
•With the exception of 2009, JoSB has built 40-60 new stores in the
past four years while maintaining a strong EBITDA CapEx margin
•Lean growth structure – Growth CapEx has been 2.7% of sales
•43% of its stores are less than five years old. In a 5-year
period, younger store sales growth is typically ~ 55% ( JPMorgan)
•Expanding the Tuxedo Rental business, which represents 16.7% of
sales for competitors (MW 10-K)
•Direct Marketing segment is continually growing with an increase of
21.2% last year
Growth Going Forward


                                                               INVESTMENT THESIS CONT’D
• In the process of renegotiating rent contracts, which will
  reduce maintenance CapEx
• Increase Inventory turnover from 1.51 to ~2.30 in 3 years
• The increase in revenues from Tuxedo Rental sales will
  increase our EBITDA margin by ~2.2% because of decrease in
  COGS
RISKS
RISKS: RISKS AND MITIGATING FACTORS
                          Risks                                                    Mitigating Factors
• Consumer demand                                                 • Consumer demand
      -   Company does not have a track record of quickly                 -    Trends in high quality men’s apparel have
          responding to changes in customer taste                              historically proceeded at one of the slowest
      -   Largest relative inventory in the sector increases                   rates in the apparel industry
          the company’s exposure to obsolete inventory
                                                                  • Real estate risk
• Real estate risk                                                        -    Management has a solid track record of
        -    The market is mature and already penetrated                       identifying high performing locations
             with competitive offerings                                   -    Management will be retained through an equity
        -    Continuing to find excellent real estate locations                incentive program
             is a significant challenge
                                                                  • Pricing risk
• Pricing risk                                                            -    Conservative assumptions in the base case
        -    Company has engaged in heavy discounting                          project that there is some permanent
             during the recession to maintain sales volume
        -    Customers may be conditioned to lower prices         • Margin risk
             and reduce spend levels if prices increase again             -    Growth in the higher margin tuxedo business
                                                                               can significantly offset decreased margins from
•Margin risk                                                                   apparel sales
      -     If continued use of discounts are required to
            maintain sales volume, gross margin will be           • Supply risk
            impaired relative to the historical average                   -    This risk can be addressed post closing through a
                                                                               disciplined supply chain diversification effort
•Supply risk
       -     Company has an unusually high supplier
             concentration
       -     Supply chain disruption could cause significant
             business interruption
EXIT STRATEGY
Three Options


                                                                   EXIT STRATEGIES
1. Initial Public Offering - This option would help us realize a
   growth on our investment
2. Sponsor-to-sponsor Sale - We anticipate that this strategy
   would bring in multiple offers as we would have more than
   doubled EBITDA
3. Strategic Buyer Sale - Selling to another company that is
   looking to expand
COMPETITIVE ADVANTAGES
                 Jos. A. Bank’s 4 Forces


•Website
    -For customer use and sales associates
•Branding
    -High level of quality in all aspects of business
    -Three Levels of Luxury
•Innovative clothing line
    -Separate Collection
    -Wrinkle resistant and stain resistant shirts
•Focus
VALUATION
VALUATION
              Jos. A. Bank is undervalued relative to its competitors


•JOSB is trading at an EV/EBITDA multiple of 5.2x compared to
the industry average of 6.41x and a peer comparison ranging
from 7.0x - 9.7x
• Based on historical years, similar companies sold for 8.0x-
10.0x EBITDA

                              Trading Comparables
     Company                               EV/EBITDA

     Jos. A. Bank                          5.20x

     Men’s Warehouse                       6.41x

     Nordstrom Inc                         9.447x
Jos. A. Bank is undervalued relative to its competitors


                                                                                   VALUATION
•We are offering a 12-20% premium to the current stock price which
is on the high end of the average valuation methods


                              Valuation Summary
Method                     Implied EV Range                   Implied Premium
52 week high/low     $26.98        $55.33            (51.24)%             0.00%
Trading Comps        $32.90        $87.45            (40.54)%             58.05%
Transaction Comps $42.06           $69.16            (23.98)%             25.00%
DCF                  $42.20        $70.53            (23.73)%             27.47%
LBO                  $61.97        $66.40            12.00%               20.00%
Average              $41.22        $69.77            (25.50)%             26.10%
ACQUISITION SOURCES AND USES
                                Sources and Uses


We plan to use approximately 40% equity contribution to purchase the company


                         Acquisition Sources and Uses
    Sources                      % Total Uses
    Cash              $191.6     15.9%    Purchase Equity       $1176.3
    Revolver          $0.0       0.0%     Repay Existing Debt   $0.00
    Term Loan         $350.0     29.1%    Financing Fees        $13.4
    Sr. Notes         $250.0     16.6%    Other Fees &Expenses $15
    Equity Contrib.   $463.1     38.4%
    Total             $1204.7    100.0% Total                   $1204.7
SOURCES AND USES
                  Dividend Recapitalization-No More


•Interest rates in the future
•Stress on the company, prior to exit strategy
•Higher MoM returns in year 3 and exit year
VALUATION: DOWNSIDE CASE FINANCIAL SUMMARY
DC - Financial Summary
VALUATION: DOWNSIDE CASE BALANCE SHEET
DC - Balance Sheet
VALUATION: DOWNSIDE CASE INCOME STATEMENT
DC - Income Statement
VALUATION: DOWNSIDE CASE RETURNS ANALYSIS
Downside Case returns a 11% IRR with a five-year exit
VALUATION: BASE CASE FINANCIAL SUMMARY
BC - Financial Summary
VALUATION: BASE CASE BALANCE SHEET
BC - Balance Sheet
VALUATION: BASE CASE INCOME STATEMENT
BC - Income Statement
VALUATION: BASE CASE RETURNS ANALYSIS
                    Base Case returns a 24.5% IRR with a five-year exit
•DCF Valuation suggests that JoSB is currently undervalued
•Estimates of our base case were pulled from analyst reports and analysts themselves
•We are offering a 12% premium and are willing to go to a 20% premium
•By adding % leverage to the JoSB balance sheet the comp
      • Great offer since stock price is at the highest it has been since inception
JOSEPH A BANKS: Q&A

Team 7

Joseph A Banks

  • 1.
    JOSEPH A BANKS:LBO Team 7
  • 2.
    AGENDA Company Overview Industry Overview InvestmentThesis Top Line Growth Strong Cash Flow Management Growth Going Forward Risks Exit Strategy Competitive Advantage Valuation and Deal Industry comparison Sources & uses Financial summary downside Financial Summary Upside
  • 3.
  • 4.
    COMPANY OVERVIEW Brand Value History and Overview •“High quality tailored and casual clothing 1905: Jos. A. Bank's grandfather Charles Bank and accessories” formally establishes his clothing business •Produces all of its own merchandise except 1945: Joseph and Howard Bank buy out for shoes Hartz's interest, company renamed Joseph A. Bank 1950s:Company enters retailing at its Store Breakdown Baltimore factory then at a Washington, D.C. •473 Retail Stores, including seven outlets 1981: Bank family sells company to Quaker and 13 franchises Oat Co • 42 States and Distinct of Columbia 1986: Leveraged buyout by McKinley Investments and others 1994: Company goes public
  • 5.
  • 6.
    Historical Performance INDUSTRY OVERVIEW % Change Men’s Clothing in Rev 30 Stores in U.S. 25 20 15 10 5 Industry 0 JOSB -5 -10 -15 1998 2005 1999 2000 2001 2002 2003 2004 2006 2007 2008 2009 • JOSB has shown strong sales growth even during the recession • Most retail companies are closing stores while JOSB is opening new stores and expanding the Tuxedo Rental business • Men’s Clothing Stores industry expected revenue growth of 2.1% per year through 2014. This makes JOSB goals for growth possible
  • 7.
    INDUSTRY OVERVIEW Industry Projections Men’s Clothing Stores Projected Sales Sales Millions Revenues 11000 10500 10000 9500 9000 8500 2007 2008 2009 2010 2011 2012 2013 2014 2015 Percentage Change in Sales 5 0 -5 -10 -15 1998 1999 2000 2001 2002 2003 2004 2005 2006 2007 2008 2009 2010 Industry
  • 8.
  • 9.
    INVESTMENT THESIS: TOPLINE GROWTH Strong Top Line Growth Industry Revenue Growth Rate •Doubled revenue  $299.7 (2004) to $739.5 (2009) •Store growth  California •Comparable Sales  8.9% up from low of 3.8% (2007) •Website
  • 10.
    INVESTMENT THESIS: STRONGCASH FLOW EBITDA & CAPEX $160 $140 $120 $100 $80 $60 $40 EBITDA $20 CAPEX $0 2000 2001 2002 2003 2004 2005 2006 2007 2008 2009 JOSB has strong, stable cash flows • Strong EBITDA margin • Capital Efficiency - Only $877,000 for a new store - Strong cash flow during recession
  • 11.
    HIGH MARGIN BUSINESS High Margin Business 20% 15% JOSB 10% MW 5% Macy's 0% 2004 2005 2006 2007 2008 2009 EBITDA Margin % JOSB has an excellent EBITDA Margin of 17.8%, 10.0% higher than the industry avg. Accomplished by: •Renegotiation of rent •Lower freight cost than competitors •Lower product cost than competitors Gross Margin increased from 57.5% in Jan 04 to 61.2% in Oct 09
  • 12.
    INVESTMENT THESIS: OURTEAM Management Team The management team was overhauled in the Total Sales Growth beginning of 2000 and since then has posted 900 Total Revenue (in millions) mid- to high- single digit or better comp 800 700 growth in every year except 2001, consistently 600 outpacing the comp sales in retail, and gross 500 400 margins have grown by over 1400 basis points 300 200 100 0 1999 2001 2003 2005 2007 2009 2011 Comp Store Sales 12 “Our mission was to do something 10 with this kind of sleepy, mid- Atlantic company. We wanted to 8 become the leading growth 6 company in menswear because we 4 didn’t see one out there” –Neal Black, CEO 2 0 2002 2003 2004 2005 2006 2007 2008
  • 13.
    OUR TEAM CONT’D Store Projections Internet and Catalog Growth In 2000, when new management took the helm, Jos A Bank had108 operating stores. Today they have473. By approximately 2012, they hope to have600. Catalog and Internet Stores 45 40 35 30 25 20 15 10 5 0 2004 2005 2006 2007 2008
  • 14.
    Four Pillars ofSuccess OUR TEAM CONT’D Quality • Key to Brand Identity • “Three Levels of Luxury” • Executive • Signature • Signature Gold Inventory In-Stock • Consistent availability for customers Design Innovation • Eliminating middlemen and streamlining design process • Introducing pieces that are “wrinkle-free,” “stain resistant” Service • Sales Associates develop meaningful business relations with customers
  • 15.
    Growth Going Forward INVESTMENT THESIS: GROWTH GOING FORWARD •With the exception of 2009, JoSB has built 40-60 new stores in the past four years while maintaining a strong EBITDA CapEx margin •Lean growth structure – Growth CapEx has been 2.7% of sales •43% of its stores are less than five years old. In a 5-year period, younger store sales growth is typically ~ 55% ( JPMorgan) •Expanding the Tuxedo Rental business, which represents 16.7% of sales for competitors (MW 10-K) •Direct Marketing segment is continually growing with an increase of 21.2% last year
  • 16.
    Growth Going Forward INVESTMENT THESIS CONT’D • In the process of renegotiating rent contracts, which will reduce maintenance CapEx • Increase Inventory turnover from 1.51 to ~2.30 in 3 years • The increase in revenues from Tuxedo Rental sales will increase our EBITDA margin by ~2.2% because of decrease in COGS
  • 17.
  • 18.
    RISKS: RISKS ANDMITIGATING FACTORS Risks Mitigating Factors • Consumer demand • Consumer demand - Company does not have a track record of quickly - Trends in high quality men’s apparel have responding to changes in customer taste historically proceeded at one of the slowest - Largest relative inventory in the sector increases rates in the apparel industry the company’s exposure to obsolete inventory • Real estate risk • Real estate risk - Management has a solid track record of - The market is mature and already penetrated identifying high performing locations with competitive offerings - Management will be retained through an equity - Continuing to find excellent real estate locations incentive program is a significant challenge • Pricing risk • Pricing risk - Conservative assumptions in the base case - Company has engaged in heavy discounting project that there is some permanent during the recession to maintain sales volume - Customers may be conditioned to lower prices • Margin risk and reduce spend levels if prices increase again - Growth in the higher margin tuxedo business can significantly offset decreased margins from •Margin risk apparel sales - If continued use of discounts are required to maintain sales volume, gross margin will be • Supply risk impaired relative to the historical average - This risk can be addressed post closing through a disciplined supply chain diversification effort •Supply risk - Company has an unusually high supplier concentration - Supply chain disruption could cause significant business interruption
  • 19.
  • 20.
    Three Options EXIT STRATEGIES 1. Initial Public Offering - This option would help us realize a growth on our investment 2. Sponsor-to-sponsor Sale - We anticipate that this strategy would bring in multiple offers as we would have more than doubled EBITDA 3. Strategic Buyer Sale - Selling to another company that is looking to expand
  • 21.
    COMPETITIVE ADVANTAGES Jos. A. Bank’s 4 Forces •Website -For customer use and sales associates •Branding -High level of quality in all aspects of business -Three Levels of Luxury •Innovative clothing line -Separate Collection -Wrinkle resistant and stain resistant shirts •Focus
  • 22.
  • 23.
    VALUATION Jos. A. Bank is undervalued relative to its competitors •JOSB is trading at an EV/EBITDA multiple of 5.2x compared to the industry average of 6.41x and a peer comparison ranging from 7.0x - 9.7x • Based on historical years, similar companies sold for 8.0x- 10.0x EBITDA Trading Comparables Company EV/EBITDA Jos. A. Bank 5.20x Men’s Warehouse 6.41x Nordstrom Inc 9.447x
  • 24.
    Jos. A. Bankis undervalued relative to its competitors VALUATION •We are offering a 12-20% premium to the current stock price which is on the high end of the average valuation methods Valuation Summary Method Implied EV Range Implied Premium 52 week high/low $26.98 $55.33 (51.24)% 0.00% Trading Comps $32.90 $87.45 (40.54)% 58.05% Transaction Comps $42.06 $69.16 (23.98)% 25.00% DCF $42.20 $70.53 (23.73)% 27.47% LBO $61.97 $66.40 12.00% 20.00% Average $41.22 $69.77 (25.50)% 26.10%
  • 25.
    ACQUISITION SOURCES ANDUSES Sources and Uses We plan to use approximately 40% equity contribution to purchase the company Acquisition Sources and Uses Sources % Total Uses Cash $191.6 15.9% Purchase Equity $1176.3 Revolver $0.0 0.0% Repay Existing Debt $0.00 Term Loan $350.0 29.1% Financing Fees $13.4 Sr. Notes $250.0 16.6% Other Fees &Expenses $15 Equity Contrib. $463.1 38.4% Total $1204.7 100.0% Total $1204.7
  • 26.
    SOURCES AND USES Dividend Recapitalization-No More •Interest rates in the future •Stress on the company, prior to exit strategy •Higher MoM returns in year 3 and exit year
  • 27.
    VALUATION: DOWNSIDE CASEFINANCIAL SUMMARY DC - Financial Summary
  • 28.
    VALUATION: DOWNSIDE CASEBALANCE SHEET DC - Balance Sheet
  • 29.
    VALUATION: DOWNSIDE CASEINCOME STATEMENT DC - Income Statement
  • 30.
    VALUATION: DOWNSIDE CASERETURNS ANALYSIS Downside Case returns a 11% IRR with a five-year exit
  • 31.
    VALUATION: BASE CASEFINANCIAL SUMMARY BC - Financial Summary
  • 32.
    VALUATION: BASE CASEBALANCE SHEET BC - Balance Sheet
  • 33.
    VALUATION: BASE CASEINCOME STATEMENT BC - Income Statement
  • 34.
    VALUATION: BASE CASERETURNS ANALYSIS Base Case returns a 24.5% IRR with a five-year exit •DCF Valuation suggests that JoSB is currently undervalued •Estimates of our base case were pulled from analyst reports and analysts themselves •We are offering a 12% premium and are willing to go to a 20% premium •By adding % leverage to the JoSB balance sheet the comp • Great offer since stock price is at the highest it has been since inception
  • 35.
    JOSEPH A BANKS:Q&A Team 7