Download as PDF, PPTX

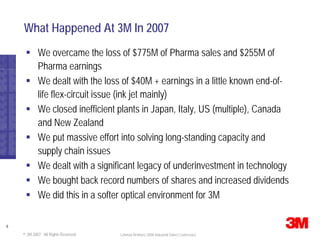
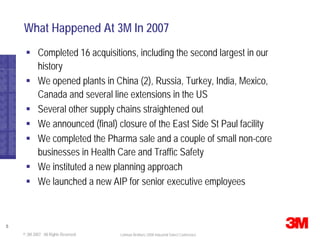
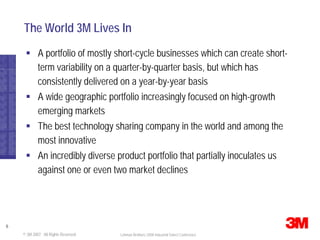
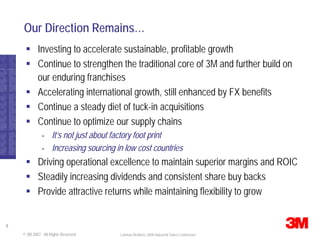
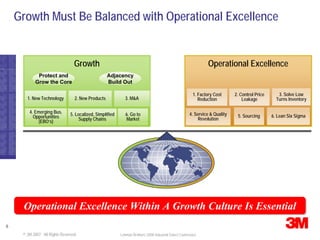
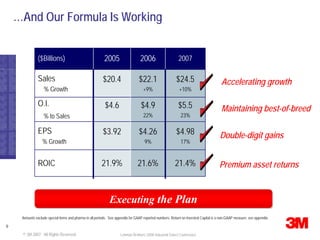
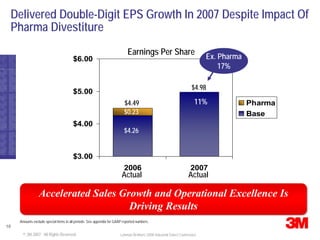
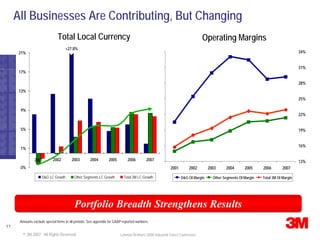
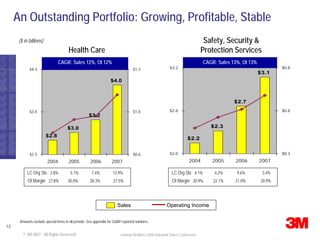
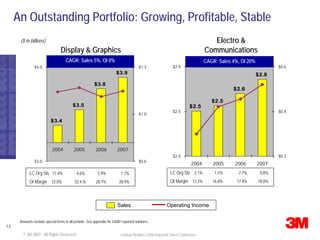
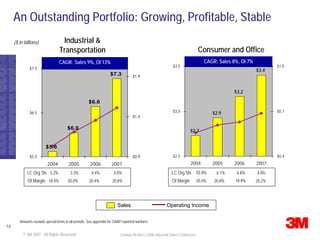
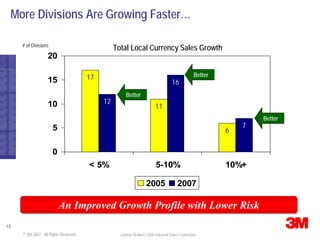
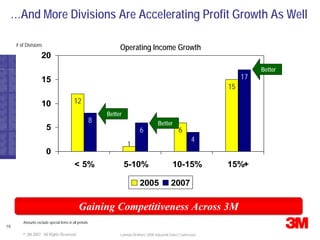


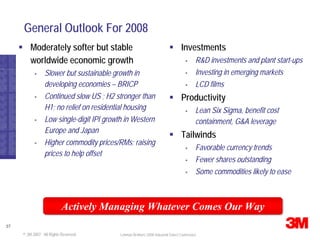
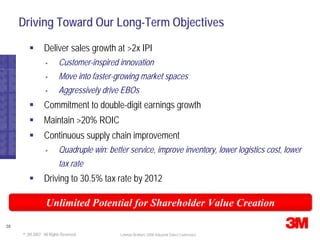
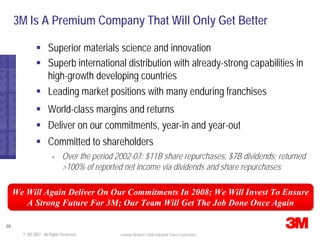
The document provides an overview of 3M Company's performance in 2007 and outlook for 2008 from the perspective of George Buckley, Chairman and CEO. Some key points: - 3M overcame challenges like the sale of its pharmaceutical business but still delivered double-digit earnings growth in 2007. - The company has a diverse portfolio of businesses that provides stability. It focuses on innovation, international expansion, and operational excellence. - 3M expects to continue investing in growth while maintaining strong margins and returns through actions like acquisitions, supply chain optimization, and productivity gains.


