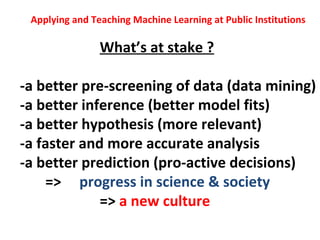
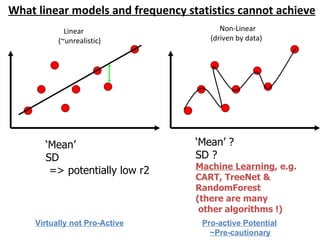
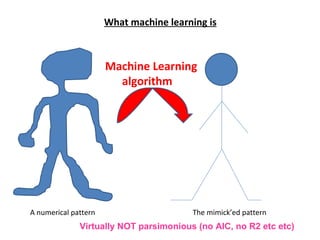
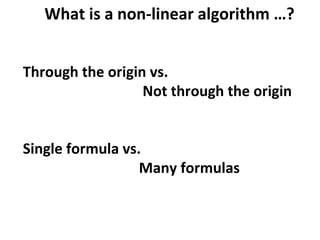
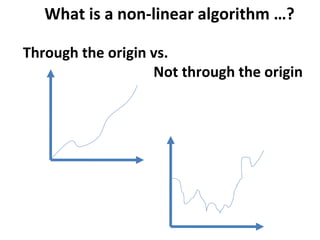
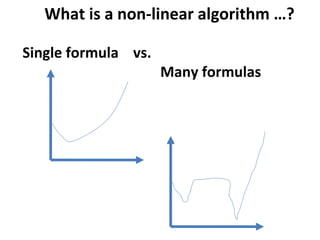
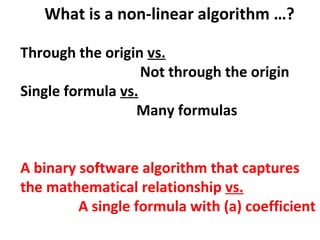
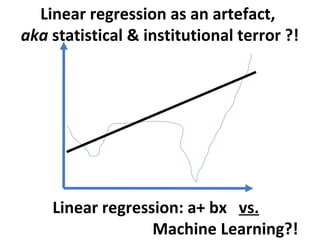
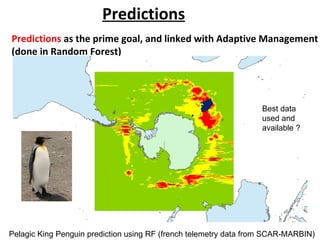
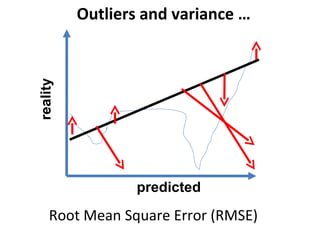
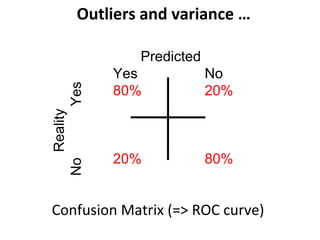
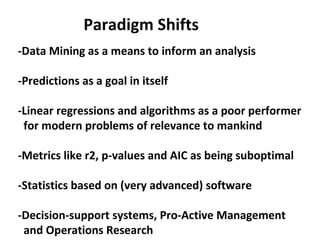
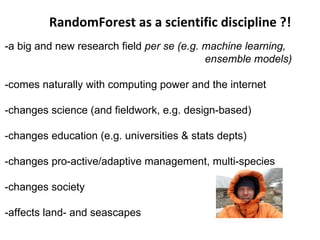
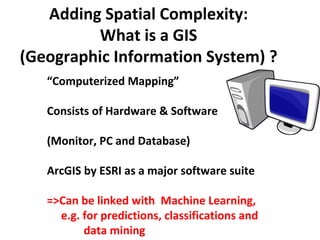
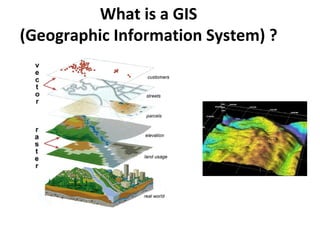
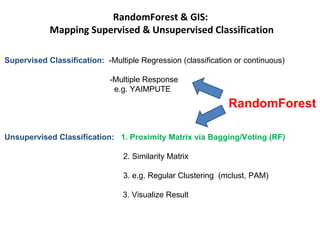
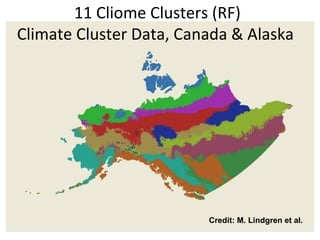
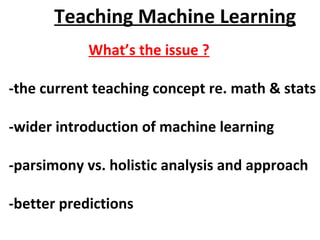
Machine Learning in the Environmental Discipline:
      Statistical Paradigm Shifts, Combining Data Mining
with Geographic Information Systems (GIS), and Educating the
        Next Generation of Environmental Researchers

                                   Falk Huettmann
                                   -EWHALE lab-
                                   419 Irving 1
                                   Inst. of Arctic Biology
                                   Biology & Wildlife Dept
                                   Fairbanks, Alaska 99775 USA
                                   fhuettmann@alaska.edu
Applying and Teaching Machine Learning at Public Institutions

                What’s at stake ?

-a better pre-screening of data (data mining)
-a better inference (better model fits)
-a better hypothesis (more relevant)
-a faster and more accurate analysis
-a better prediction (pro-active decisions)
    => progress in science & society
             => a new culture
This presentation

-Environmental Sciences (Sustainability)

-Paradigm Shift in the Sciences

-Geographic Information Systems (GIS)

-Teaching Machine Learning at Public
 Institutions
The earth and its atmosphere ...we only have one ...
The atmosphere
Rio Convention 1992 and its goals
The Earth at night…


     …people are everywhere these days,
     mostly at the coast, affecting Wildlife,
     Habitats and Ecological Services
An Earth Sampler: The Three Poles
1.

                             3.


                 2.
Three poles: Ice, glaciers and snow

 => A cool (or a hot?) place to be...


1.                      2.              3.
No data …and “nothing is known” …?
Climbing and Understanding Data Mountains with Data Mining:
           A free copy of GBIF data… www.gbif.org,
      seamap.env.duke.edu/ , mountainbiodiversity.org


   Megascience
Examples of people using and publishing on
Machine Learning in the Biodiversity, Wildlife
and Sustainability Sciences…
Classify, pre-screen, explain and predict data


                      A heap of data,
                   e.g. online and merged,
                   free of research design


Response ~ Predictor1 + Predictor2 + Predictor3 + Predictor4 +….
             (e.g. clustering & multiple regression)
Multiple Regressions: Are they any good ?!
Response ~ Predictor1 + Predictor2 + Predictor3 + Predictor4 +….

The issues are for instance:
                -Many predictors, e.g. 30

                -Correlations

                -Interactions (2-way, 3-way and higher)

                -Coefficients + Offset

                -(Multi-) hypothesis testing

                -Model Selection

                -Parsimony
    = > A single formula vs a software code as a result ?!
What statistical philosophies
    and schools exist ?

          -Frequency Statistics
 R. A. Fisher
                                     Occam
                                  (Parsimony)
          -Bayesian Statistics
Bayes


          -Machine Learning

 L. Breiman
What statistical philosophies
    and schools exist ?
  e.g. Frequency Statistics
  -Normal distribution
  -Independence
  -Linear functions
  -Variance explained
  -Parsimony
What statistical philosophies
    and schools exist ?
 e.g. Bayesian Statistics
 -Priors
 -Fit a function
 -Variance explained
 -(alternative) confidence intervals
 -Linear functions (usually)
What statistical philosophies
    and schools exist ?
 e.g. Machine Learning
 -Inherently non-linear
 -No prior assumptions (non-parametric)
 -Fast
 -Computationally intense
What linear models and frequency statistics cannot achieve
             Linear                      Non-Linear
           (~unrealistic)             (driven by data)


       ‘Mean’                      ‘Mean’ ?
       SD                          SD ?
                                   Machine Learning, e.g.
        => potentially low r2
                                   CART, TreeNet &
                                   RandomForest
                                   (there are many
                                    other algorithms !)
     Virtually not Pro-Active       Pro-active Potential
                                      ~Pre-cautionary
What machine learning is


                      Machine Learning
                        algorithm


A numerical pattern                     The mimick’ed pattern
              Virtually NOT parsimonious (no AIC, no R2 etc etc)
What is a non-linear algorithm …?


Through the origin vs.
                  Not through the origin


Single formula vs.
                  Many formulas
What is a non-linear algorithm …?

Through the origin vs.
                   Not through the origin
What is a non-linear algorithm …?

Single formula vs.
                     Many formulas
What is a non-linear algorithm …?

Through the origin vs.
                   Not through the origin
Single formula vs.
                  Many formulas


A binary software algorithm that captures
the mathematical relationship vs.
         A single formula with (a) coefficient
Linear regression as an artefact,
aka statistical & institutional terror ?!


    Linear regression: a+ bx vs.
                  Machine Learning?!
Predictions
Predictions as the prime goal, and linked with Adaptive Management
(done in Random Forest)


                                                                   Best data
                                                                   used and
                                                                   available ?


Pelagic King Penguin prediction using RF (french telemetry data from SCAR-MARBIN)
Outliers and variance …
reality


                 predicted

    Root Mean Square Error (RMSE)
Outliers and variance …

                   Predicted
          Yes   Yes            No
                80%            20%
Reality


                20%            80%
          No


Confusion Matrix (=> ROC curve)
Moving into Data Mining
                   (non-parametric, rel. high data error)


   A heap of data,
e.g. online and merged,
free of research design

                                  Your classic Frequentist Statistician
                                  might get very scared and horrified
                                  with such data…
Moving into Data Mining


                                                                         Describe Patterns,


                                        Screening
                                                                              Outliers

                                                                      Data Quantification
                                                                         (~prediction)
                                                                           Informed
   A heap of data,                                                        Traditional
e.g. online and merged                                                      Analysis
    Craig, E., and F. Huettmann. (2008). Using “blackbox” algorithms such as           TreeNet and Random
           Forests for data-mining and for finding meaningful patterns, relationships and outliers in complex
           ecological data: an overview, an example using golden eagle satellite data and an outlook for a
           promising future. Chapter IV in Intelligent Data Analysis: Developing New Methodologies through
           Pattern Discovery and Recovery (Hsiao-fan Wang, Ed.). IGI Global, Hershey, PA, USA.
Data
                                         Mining


                                                                         Describe Patterns,


                                        Screening
                                                                              Outliers

                                                                      Data Quantification
                                                                         (~prediction)
                                                                           Informed
   A heap of data,                                                       (Traditional)
e.g. online and merged                                                      Analysis
    Craig, E., and F. Huettmann. (2008). Using “blackbox” algorithms such as           TreeNet and Random
           Forests for data-mining and for finding meaningful patterns, relationships and outliers in complex
           ecological data: an overview, an example using golden eagle satellite data and an outlook for a
           promising future. Chapter IV in Intelligent Data Analysis: Developing New Methodologies through
           Pattern Discovery and Recovery (Hsiao-fan Wang, Ed.). IGI Global, Hershey, PA, USA.

    Magness, D.R., F. Huettmann, and J.M. Morton. (2008). Using Random Forests to provide predicted
        species distribution maps as a metric for ecological inventory & monitoring programs. Pages 209-
        229 in T.G. Smolinski, M.G. Milanova & A-E. Hassanien (eds.). Applications of Computational
        Intelligence in Biology: Current Trends and Open Problems. Studies in Computational Intelligence,
        Vol. 122, Springer-Verlag Berlin Heidelberg.
Data
                                                                          ⇒     SOFTWARE
                                         Mining
                                                                           This becomes a standard,
                                                                           e.g. BEST PROFESSIONAL
                                                                               PRACTICE

                                                                         Describe Patterns,


                                        Screening
                                                                              Outliers

                                                                      Data Quantification
                                                                         (~prediction)
                                                                           Informed
   A heap of data,                                                       (Traditional)
e.g. online and merged                                                      Analysis
    Craig, E., and F. Huettmann. (2008). Using “blackbox” algorithms such as           TreeNet and Random
           Forests for data-mining and for finding meaningful patterns, relationships and outliers in complex
           ecological data: an overview, an example using golden eagle satellite data and an outlook for a
           promising future. Chapter IV in Intelligent Data Analysis: Developing New Methodologies through
           Pattern Discovery and Recovery (Hsiao-fan Wang, Ed.). IGI Global, Hershey, PA, USA.

    Magness, D.R., F. Huettmann, and J.M. Morton. (2008). Using Random Forests to provide predicted
        species distribution maps as a metric for ecological inventory & monitoring programs. Pages 209-
        229 in T.G. Smolinski, M.G. Milanova & A-E. Hassanien (eds.). Applications of Computational
        Intelligence in Biology: Current Trends and Open Problems. Studies in Computational Intelligence,
        Vol. 122, Springer-Verlag Berlin Heidelberg.
(Adaptive/Science-based)
      Wildlife Management:
         How it works…
-Identify a problem

-Do the science

-Provide a management suggestion

-Implement science-based management

-Assess and fine-tune

 =>Pro-active (before trouble occurs)
   => Predictive in Space and Time
Paradigm Shifts
-Data Mining as a means to inform an analysis

-Predictions as a goal in itself

-Linear regressions and algorithms as a poor performer
 for modern problems of relevance to mankind

-Metrics like r2, p-values and AIC as being suboptimal

-Statistics based on (very advanced) software

-Decision-support systems, Pro-Active Management
 and Operations Research
RandomForest as a scientific discipline ?!
-a big and new research field per se (e.g. machine learning,
                                           ensemble models)

-comes naturally with computing power and the internet

-changes science (and fieldwork, e.g. design-based)

-changes education (e.g. universities & stats depts)

-changes pro-active/adaptive management, multi-species

-changes society

-affects land- and seascapes
Adding Spatial Complexity:
         What is a GIS
(Geographic Information System) ?
   “Computerized Mapping”

   Consists of Hardware & Software

   (Monitor, PC and Database)

   ArcGIS by ESRI as a major software suite

   =>Can be linked with Machine Learning,
     e.g. for predictions, classifications and
          data mining
What is a GIS
(Geographic Information System) ?
RandomForest & GIS:
            Mapping Supervised & Unsupervised Classification

Supervised Classification: -Multiple Regression (classification or continuous)

                             -Multiple Response
                              e.g. YAIMPUTE
                                                              RandomForest

Unsupervised Classification: 1. Proximity Matrix via Bagging/Voting (RF)

                                 2. Similarity Matrix

                                 3. e.g. Regular Clustering (mclust, PAM)

                                3. Visualize Result
11 Cliome Clusters (RF)
Climate Cluster Data, Canada & Alaska


                         Credit: M. Lindgren et al.
Teaching Machine Learning
            What’s the issue ?

-the current teaching concept re. math & stats

-wider introduction of machine learning

-parsimony vs. holistic analysis and approach

-better predictions
Teaching math, statistics and
     machine learning…


Usually, machine learning starts where
maximum-likelihood theory ends…

=>maximum-likelihood starts at college…

 But it does not have to be that way!
Teaching math, statistics and
          machine learning…
Student’s age       Topic learned

16                  Basic Math

5                 Frequency Statistics
                     (Maximum Likelihood)

23 - 30              Machine Learning
Teaching math, statistics and
   machine learning…the better way
Student’s age   Topic learned
  15             Basic Math
  16             Frequency Statistics
  18             (Maximum Likelihood)
  19             Machine Learning

                 Why & How done ?

                 via Greybox   Blackbox
Teaching math, statistics and
         machine learning…
Parsimony (complexity   vs. variance explained)

    Model name   AIC etc
    Model 1       1000
    Model 2        900
    Model 3        600
    Model 4        500
    Model 5       1200      Breaking down a complex
    Model 6       1100      real-world problem into a single
                            linear term…and for a
                            mechanistic understanding…??
Teaching math, statistics and
         machine learning…
Predictions (knowing things ahead of time)

         For spatial predictions
         For temporal predictions
         For a pro-active management
To…Salford Systems,
Dan Steinberg and his team,
our students, L. Strecker,
S. Linke, and many many
project and research collaborators
world-wide over the years!!


                           Questions ?

Paradigm shifts in wildlife and biodiversity management through machine learning

  • 1.
    Machine Learning inthe Environmental Discipline: Statistical Paradigm Shifts, Combining Data Mining with Geographic Information Systems (GIS), and Educating the Next Generation of Environmental Researchers Falk Huettmann -EWHALE lab- 419 Irving 1 Inst. of Arctic Biology Biology & Wildlife Dept Fairbanks, Alaska 99775 USA fhuettmann@alaska.edu
  • 2.
    Applying and TeachingMachine Learning at Public Institutions What’s at stake ? -a better pre-screening of data (data mining) -a better inference (better model fits) -a better hypothesis (more relevant) -a faster and more accurate analysis -a better prediction (pro-active decisions) => progress in science & society => a new culture
  • 3.
    This presentation -Environmental Sciences(Sustainability) -Paradigm Shift in the Sciences -Geographic Information Systems (GIS) -Teaching Machine Learning at Public Institutions
  • 4.
    The earth andits atmosphere ...we only have one ...
  • 5.
  • 6.
    Rio Convention 1992and its goals
  • 7.
    The Earth atnight… …people are everywhere these days, mostly at the coast, affecting Wildlife, Habitats and Ecological Services
  • 8.
    An Earth Sampler:The Three Poles 1. 3. 2.
  • 9.
    Three poles: Ice,glaciers and snow => A cool (or a hot?) place to be... 1. 2. 3.
  • 10.
    No data …and“nothing is known” …? Climbing and Understanding Data Mountains with Data Mining: A free copy of GBIF data… www.gbif.org, seamap.env.duke.edu/ , mountainbiodiversity.org Megascience
  • 11.
    Examples of peopleusing and publishing on Machine Learning in the Biodiversity, Wildlife and Sustainability Sciences…
  • 12.
    Classify, pre-screen, explainand predict data A heap of data, e.g. online and merged, free of research design Response ~ Predictor1 + Predictor2 + Predictor3 + Predictor4 +…. (e.g. clustering & multiple regression)
  • 13.
    Multiple Regressions: Arethey any good ?! Response ~ Predictor1 + Predictor2 + Predictor3 + Predictor4 +…. The issues are for instance: -Many predictors, e.g. 30 -Correlations -Interactions (2-way, 3-way and higher) -Coefficients + Offset -(Multi-) hypothesis testing -Model Selection -Parsimony = > A single formula vs a software code as a result ?!
  • 14.
    What statistical philosophies and schools exist ? -Frequency Statistics R. A. Fisher Occam (Parsimony) -Bayesian Statistics Bayes -Machine Learning L. Breiman
  • 15.
    What statistical philosophies and schools exist ? e.g. Frequency Statistics -Normal distribution -Independence -Linear functions -Variance explained -Parsimony
  • 16.
    What statistical philosophies and schools exist ? e.g. Bayesian Statistics -Priors -Fit a function -Variance explained -(alternative) confidence intervals -Linear functions (usually)
  • 17.
    What statistical philosophies and schools exist ? e.g. Machine Learning -Inherently non-linear -No prior assumptions (non-parametric) -Fast -Computationally intense
  • 18.
    What linear modelsand frequency statistics cannot achieve Linear Non-Linear (~unrealistic) (driven by data) ‘Mean’ ‘Mean’ ? SD SD ? Machine Learning, e.g. => potentially low r2 CART, TreeNet & RandomForest (there are many other algorithms !) Virtually not Pro-Active Pro-active Potential ~Pre-cautionary
  • 19.
    What machine learningis Machine Learning algorithm A numerical pattern The mimick’ed pattern Virtually NOT parsimonious (no AIC, no R2 etc etc)
  • 20.
    What is anon-linear algorithm …? Through the origin vs. Not through the origin Single formula vs. Many formulas
  • 21.
    What is anon-linear algorithm …? Through the origin vs. Not through the origin
  • 22.
    What is anon-linear algorithm …? Single formula vs. Many formulas
  • 23.
    What is anon-linear algorithm …? Through the origin vs. Not through the origin Single formula vs. Many formulas A binary software algorithm that captures the mathematical relationship vs. A single formula with (a) coefficient
  • 24.
    Linear regression asan artefact, aka statistical & institutional terror ?! Linear regression: a+ bx vs. Machine Learning?!
  • 25.
    Predictions Predictions as theprime goal, and linked with Adaptive Management (done in Random Forest) Best data used and available ? Pelagic King Penguin prediction using RF (french telemetry data from SCAR-MARBIN)
  • 26.
    Outliers and variance… reality predicted Root Mean Square Error (RMSE)
  • 27.
    Outliers and variance… Predicted Yes Yes No 80% 20% Reality 20% 80% No Confusion Matrix (=> ROC curve)
  • 28.
    Moving into DataMining (non-parametric, rel. high data error) A heap of data, e.g. online and merged, free of research design Your classic Frequentist Statistician might get very scared and horrified with such data…
  • 29.
    Moving into DataMining Describe Patterns, Screening Outliers Data Quantification (~prediction) Informed A heap of data, Traditional e.g. online and merged Analysis Craig, E., and F. Huettmann. (2008). Using “blackbox” algorithms such as TreeNet and Random Forests for data-mining and for finding meaningful patterns, relationships and outliers in complex ecological data: an overview, an example using golden eagle satellite data and an outlook for a promising future. Chapter IV in Intelligent Data Analysis: Developing New Methodologies through Pattern Discovery and Recovery (Hsiao-fan Wang, Ed.). IGI Global, Hershey, PA, USA.
  • 30.
    Data Mining Describe Patterns, Screening Outliers Data Quantification (~prediction) Informed A heap of data, (Traditional) e.g. online and merged Analysis Craig, E., and F. Huettmann. (2008). Using “blackbox” algorithms such as TreeNet and Random Forests for data-mining and for finding meaningful patterns, relationships and outliers in complex ecological data: an overview, an example using golden eagle satellite data and an outlook for a promising future. Chapter IV in Intelligent Data Analysis: Developing New Methodologies through Pattern Discovery and Recovery (Hsiao-fan Wang, Ed.). IGI Global, Hershey, PA, USA. Magness, D.R., F. Huettmann, and J.M. Morton. (2008). Using Random Forests to provide predicted species distribution maps as a metric for ecological inventory & monitoring programs. Pages 209- 229 in T.G. Smolinski, M.G. Milanova & A-E. Hassanien (eds.). Applications of Computational Intelligence in Biology: Current Trends and Open Problems. Studies in Computational Intelligence, Vol. 122, Springer-Verlag Berlin Heidelberg.
  • 31.
    Data ⇒ SOFTWARE Mining This becomes a standard, e.g. BEST PROFESSIONAL PRACTICE Describe Patterns, Screening Outliers Data Quantification (~prediction) Informed A heap of data, (Traditional) e.g. online and merged Analysis Craig, E., and F. Huettmann. (2008). Using “blackbox” algorithms such as TreeNet and Random Forests for data-mining and for finding meaningful patterns, relationships and outliers in complex ecological data: an overview, an example using golden eagle satellite data and an outlook for a promising future. Chapter IV in Intelligent Data Analysis: Developing New Methodologies through Pattern Discovery and Recovery (Hsiao-fan Wang, Ed.). IGI Global, Hershey, PA, USA. Magness, D.R., F. Huettmann, and J.M. Morton. (2008). Using Random Forests to provide predicted species distribution maps as a metric for ecological inventory & monitoring programs. Pages 209- 229 in T.G. Smolinski, M.G. Milanova & A-E. Hassanien (eds.). Applications of Computational Intelligence in Biology: Current Trends and Open Problems. Studies in Computational Intelligence, Vol. 122, Springer-Verlag Berlin Heidelberg.
  • 32.
    (Adaptive/Science-based) Wildlife Management: How it works… -Identify a problem -Do the science -Provide a management suggestion -Implement science-based management -Assess and fine-tune =>Pro-active (before trouble occurs) => Predictive in Space and Time
  • 33.
    Paradigm Shifts -Data Miningas a means to inform an analysis -Predictions as a goal in itself -Linear regressions and algorithms as a poor performer for modern problems of relevance to mankind -Metrics like r2, p-values and AIC as being suboptimal -Statistics based on (very advanced) software -Decision-support systems, Pro-Active Management and Operations Research
  • 34.
    RandomForest as ascientific discipline ?! -a big and new research field per se (e.g. machine learning, ensemble models) -comes naturally with computing power and the internet -changes science (and fieldwork, e.g. design-based) -changes education (e.g. universities & stats depts) -changes pro-active/adaptive management, multi-species -changes society -affects land- and seascapes
  • 35.
    Adding Spatial Complexity: What is a GIS (Geographic Information System) ? “Computerized Mapping” Consists of Hardware & Software (Monitor, PC and Database) ArcGIS by ESRI as a major software suite =>Can be linked with Machine Learning, e.g. for predictions, classifications and data mining
  • 36.
    What is aGIS (Geographic Information System) ?
  • 37.
    RandomForest & GIS: Mapping Supervised & Unsupervised Classification Supervised Classification: -Multiple Regression (classification or continuous) -Multiple Response e.g. YAIMPUTE RandomForest Unsupervised Classification: 1. Proximity Matrix via Bagging/Voting (RF) 2. Similarity Matrix 3. e.g. Regular Clustering (mclust, PAM) 3. Visualize Result
  • 38.
    11 Cliome Clusters(RF) Climate Cluster Data, Canada & Alaska Credit: M. Lindgren et al.
  • 39.
    Teaching Machine Learning What’s the issue ? -the current teaching concept re. math & stats -wider introduction of machine learning -parsimony vs. holistic analysis and approach -better predictions
  • 40.
    Teaching math, statisticsand machine learning… Usually, machine learning starts where maximum-likelihood theory ends… =>maximum-likelihood starts at college… But it does not have to be that way!
  • 41.
    Teaching math, statisticsand machine learning… Student’s age Topic learned 16 Basic Math 5 Frequency Statistics (Maximum Likelihood) 23 - 30 Machine Learning
  • 42.
    Teaching math, statisticsand machine learning…the better way Student’s age Topic learned 15 Basic Math 16 Frequency Statistics 18 (Maximum Likelihood) 19 Machine Learning Why & How done ? via Greybox Blackbox
  • 43.
    Teaching math, statisticsand machine learning… Parsimony (complexity vs. variance explained) Model name AIC etc Model 1 1000 Model 2 900 Model 3 600 Model 4 500 Model 5 1200 Breaking down a complex Model 6 1100 real-world problem into a single linear term…and for a mechanistic understanding…??
  • 44.
    Teaching math, statisticsand machine learning… Predictions (knowing things ahead of time) For spatial predictions For temporal predictions For a pro-active management
  • 45.
    To…Salford Systems, Dan Steinbergand his team, our students, L. Strecker, S. Linke, and many many project and research collaborators world-wide over the years!! Questions ?